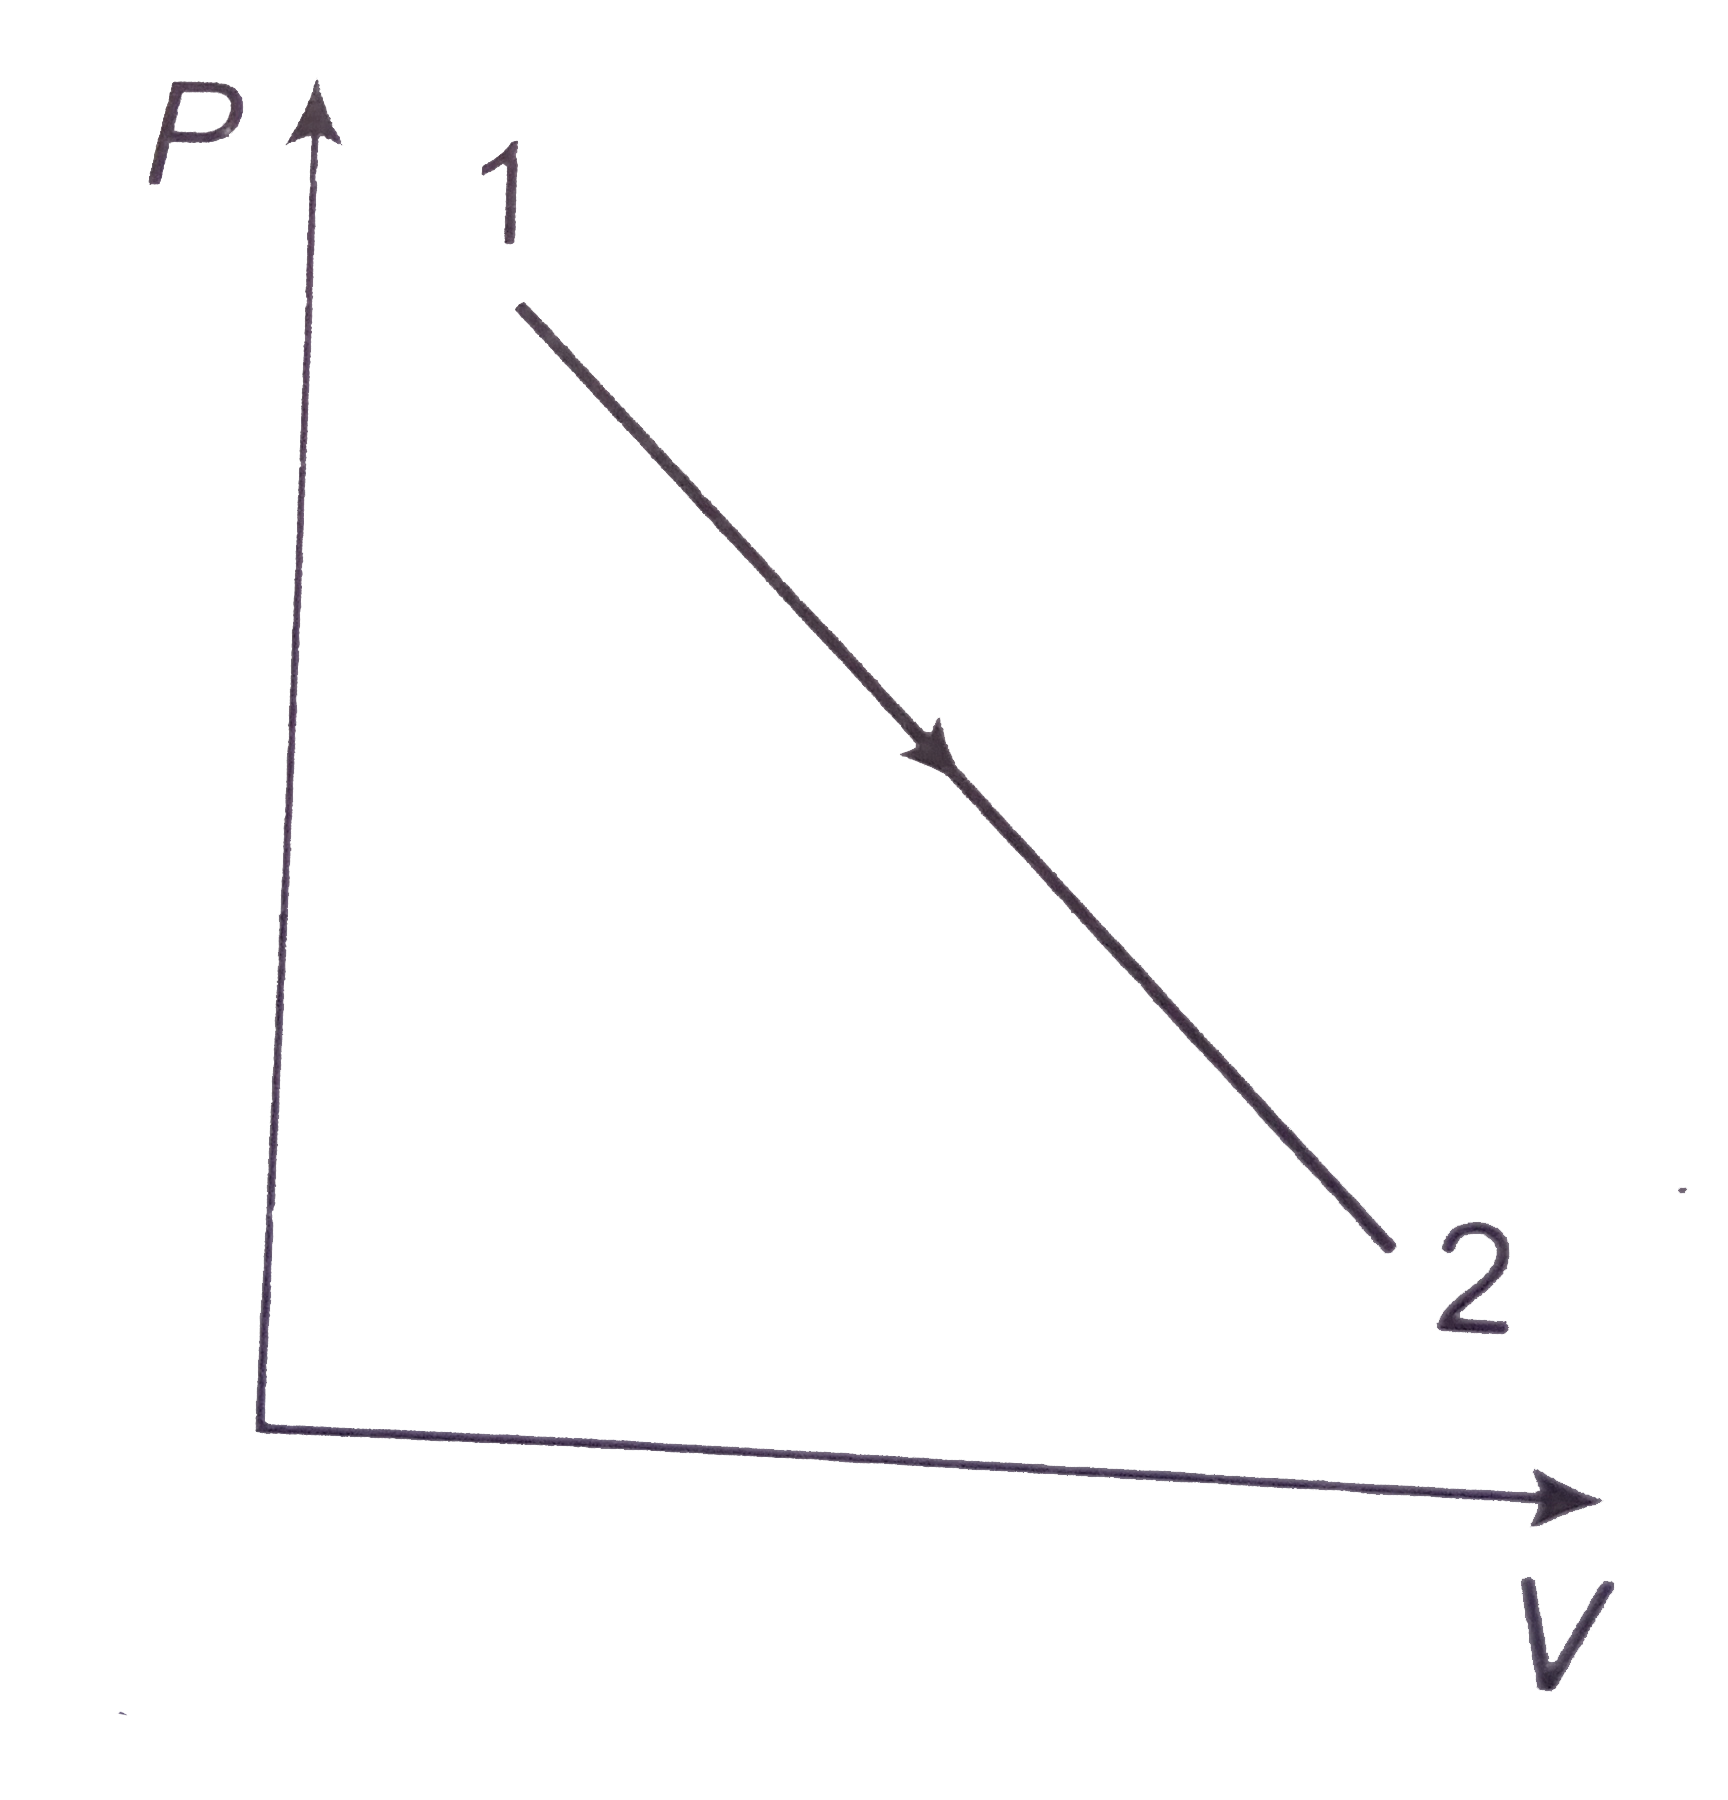
P−V graph was obtained from state 1 to state 2 when a given mass of a gas is subjected to temperature changes during the process the gas is
Heated continuously
Cooled continuously
Heated in the beginning and cooled towards the end
cooled in the biginning and heated towards the end
The correct Answer is:C
Step by step video, text & image solution for P-V graph was obtained from state 1 to state 2 when a given mass of a gas is subjected to temperature changes during the process the gas is by Physics experts to help you in doubts & scoring excellent marks in Class 11 exams.
Updated on:21/07/2023Topper's Solved these Questions
Similar Questions
Knowledge Check
V−T diagram for a process of given mass of ideal gas is as shown in fig. During the process pressure of the gas
_E01_072_Q01.png) AFirst increases then decreasesBFirst decreases then increasesCcontinously decreasesDcontinously increases
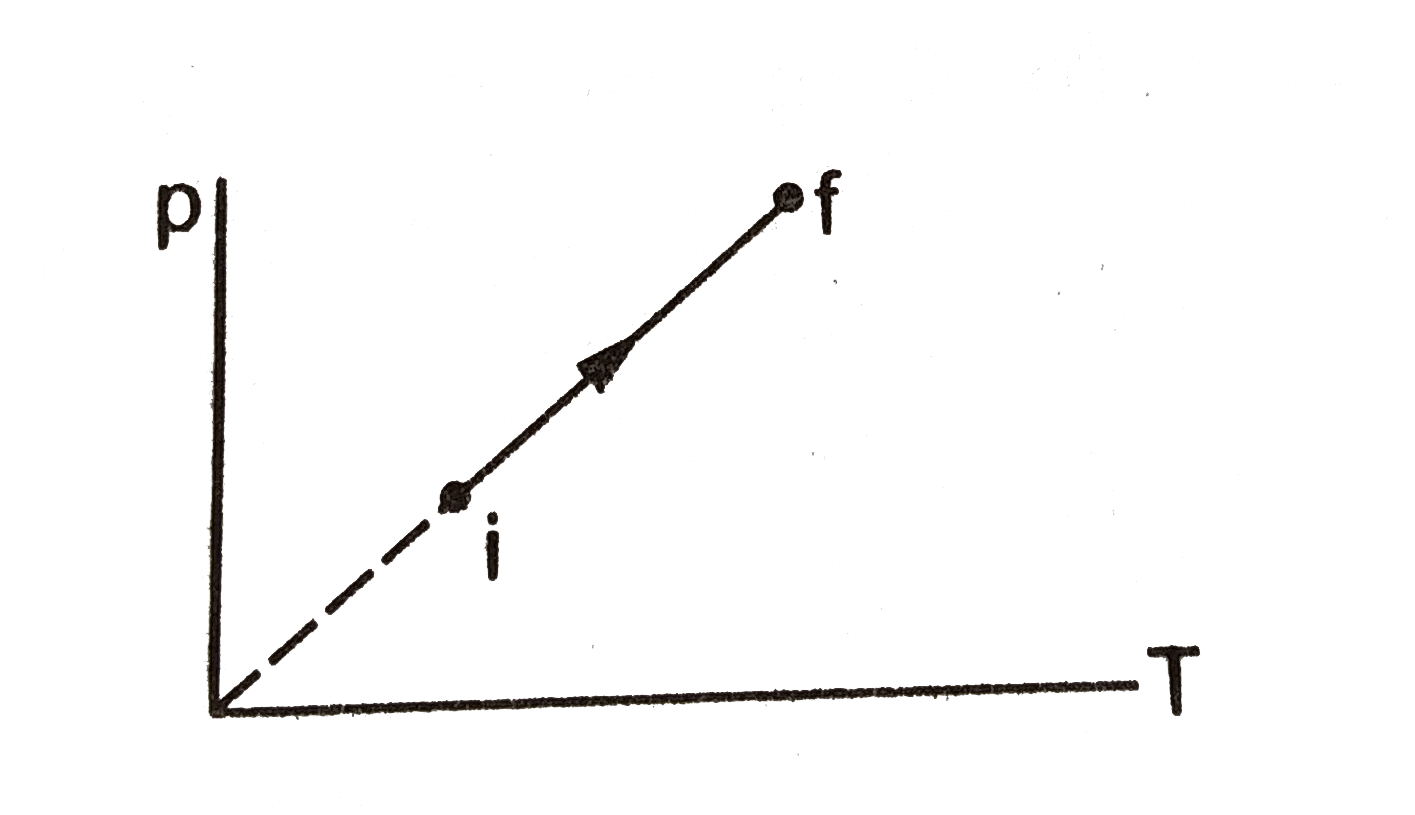
AFirst increases then decreasesBFirst decreases then increasesCcontinously decreasesDcontinously increasesAn ideal gas goes from the state i to the state ∫ as shown in .the work done by the gas during the process
 Ais positiveBis negativeCis zeroDcannot be obtained from this information.
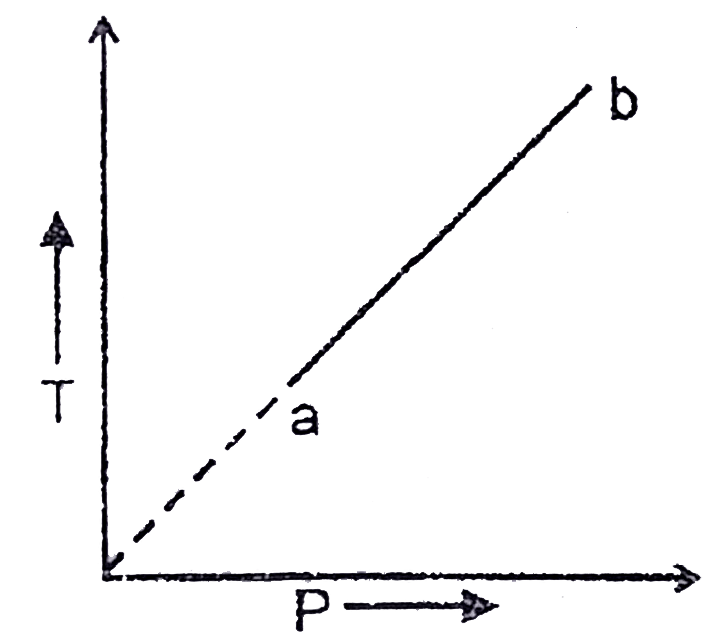
An ideal gas change from state a to state b as shown in Fig. what is the work done by the gas in the process?
 AzeroBpositiveCnegativeDinfinite
For a given mass of a gas at a fixed temperature, what is the nature of graph between pressure P and volume V?
View SolutionAn ideal gas change from state a to state b as shown in Fig. what is the work done by the gas in the process?

View SolutionA P−V diagram is obtained by changing the temeprature of the gas as shown. During the proces the gas is
_E01_020_Q01.png)
View Solution
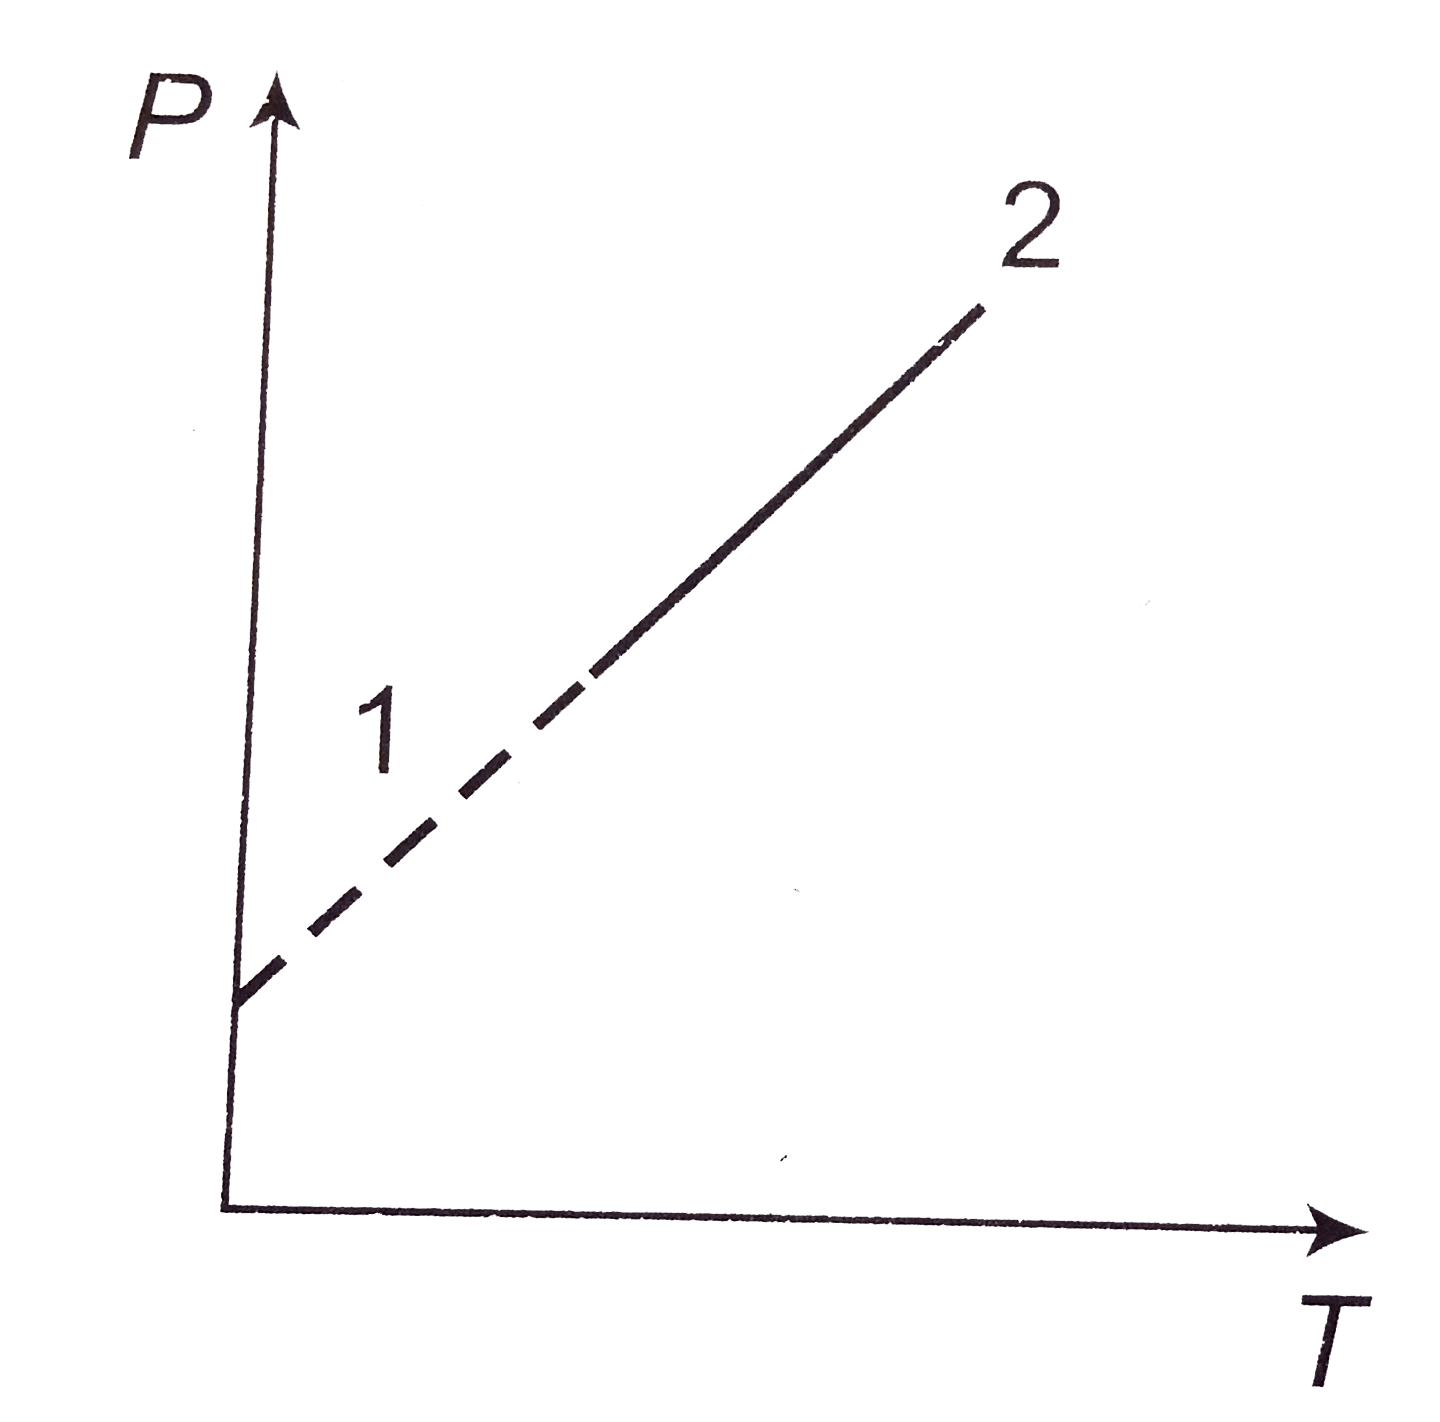
A pressure P, absolute temperature T, graph was obtained whe a given mass of a gas heated. During the heating process from the state 1 to the state 2, the volume
View SolutionWhat is the nature of graph of PV versus P for a given mass of a gas at constant temperature?
View Solution
