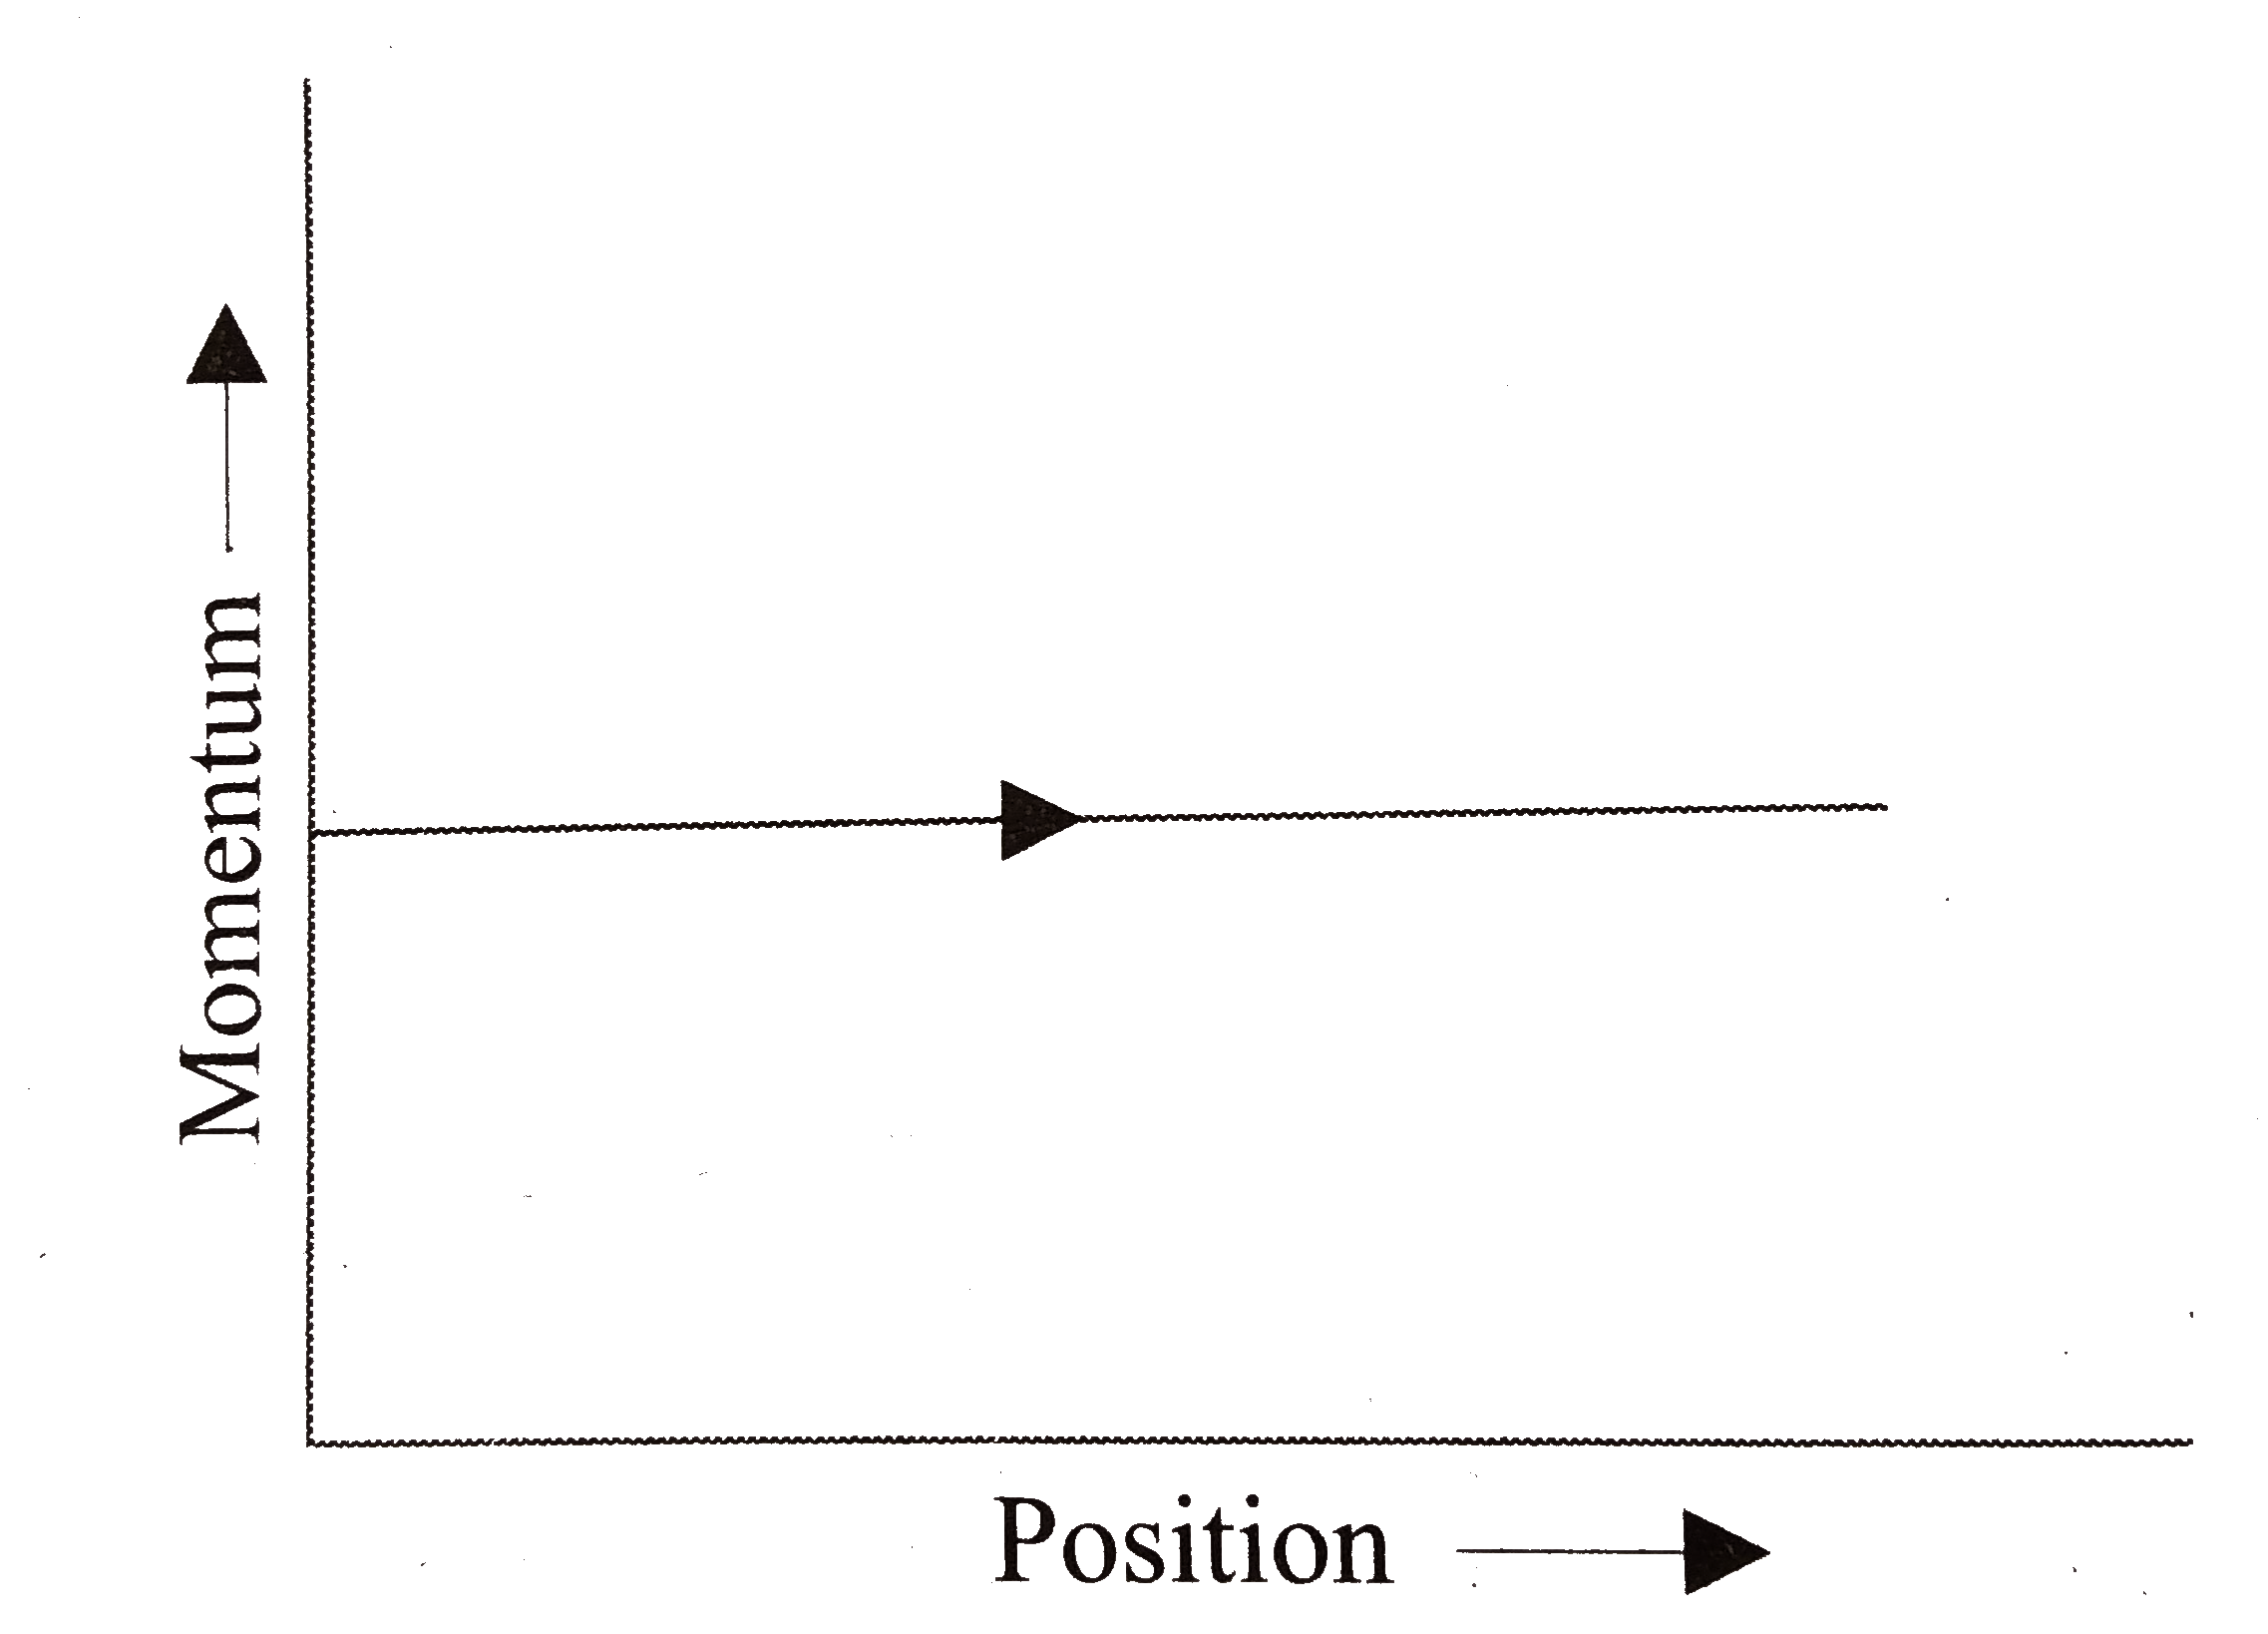
Phase space diagrams are useful tools in analysing all kinds of dynamical problems. They are especially useful in studying the changes in motion as initial position and momentum are changed. Here we consider some simple dynamical systems in one dimension. For such systems, phase space is a plane in which position is plotted along horizontal axis and momentum in plotted along vertical the axis.
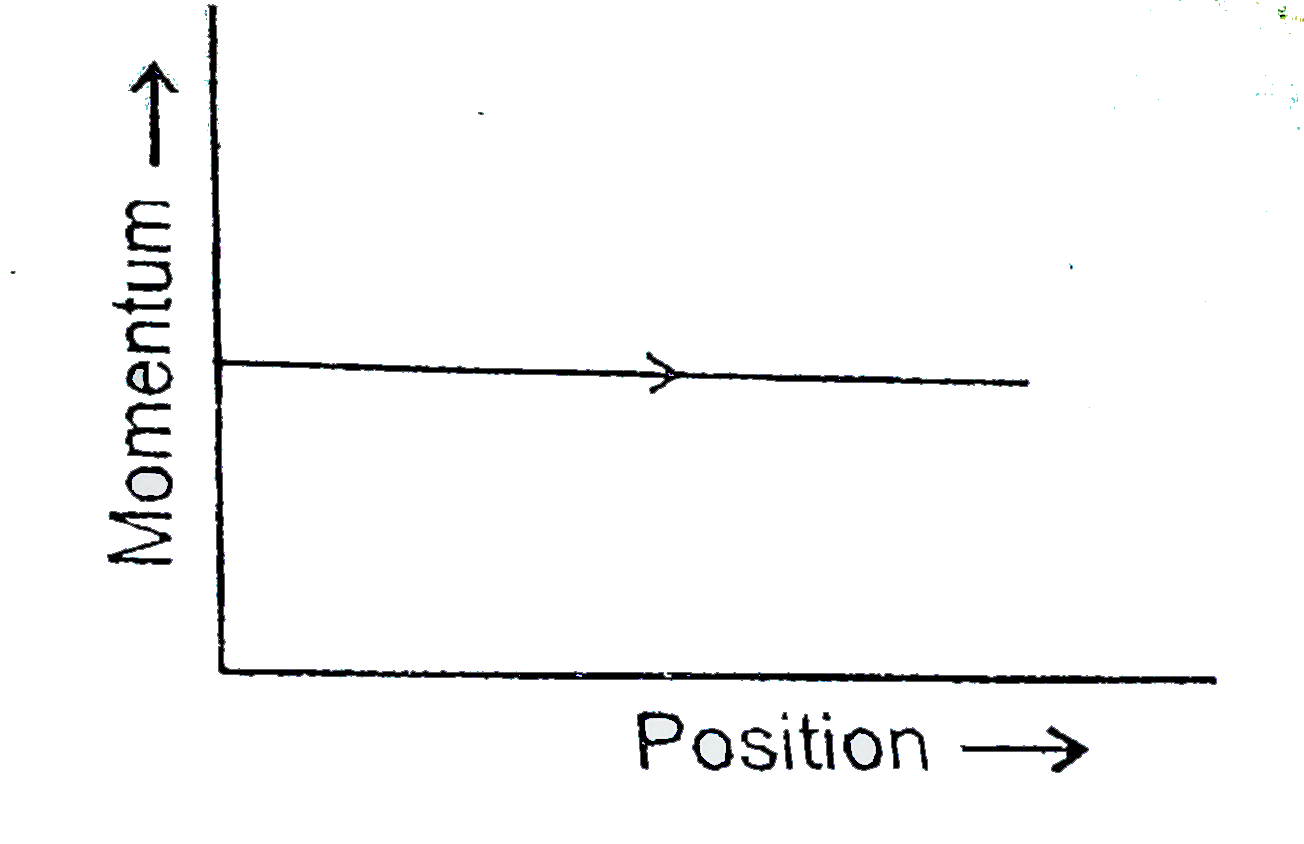
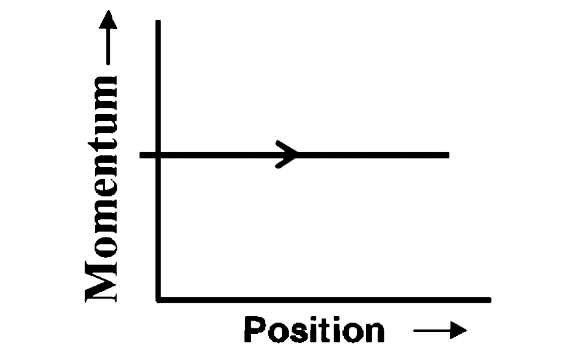
The phase space diagram is x(t) vsersus p(t) curve in this plane. The arrow on the curve indicates the time flow. For example, the phase space space diagram for a particle moving with constant velocity is a straight line as shown in (Fig. 8.13). We use the sign convention in which position or momentum upwards (or to right) is positive and downwards (or to left) is negative.
 .
.
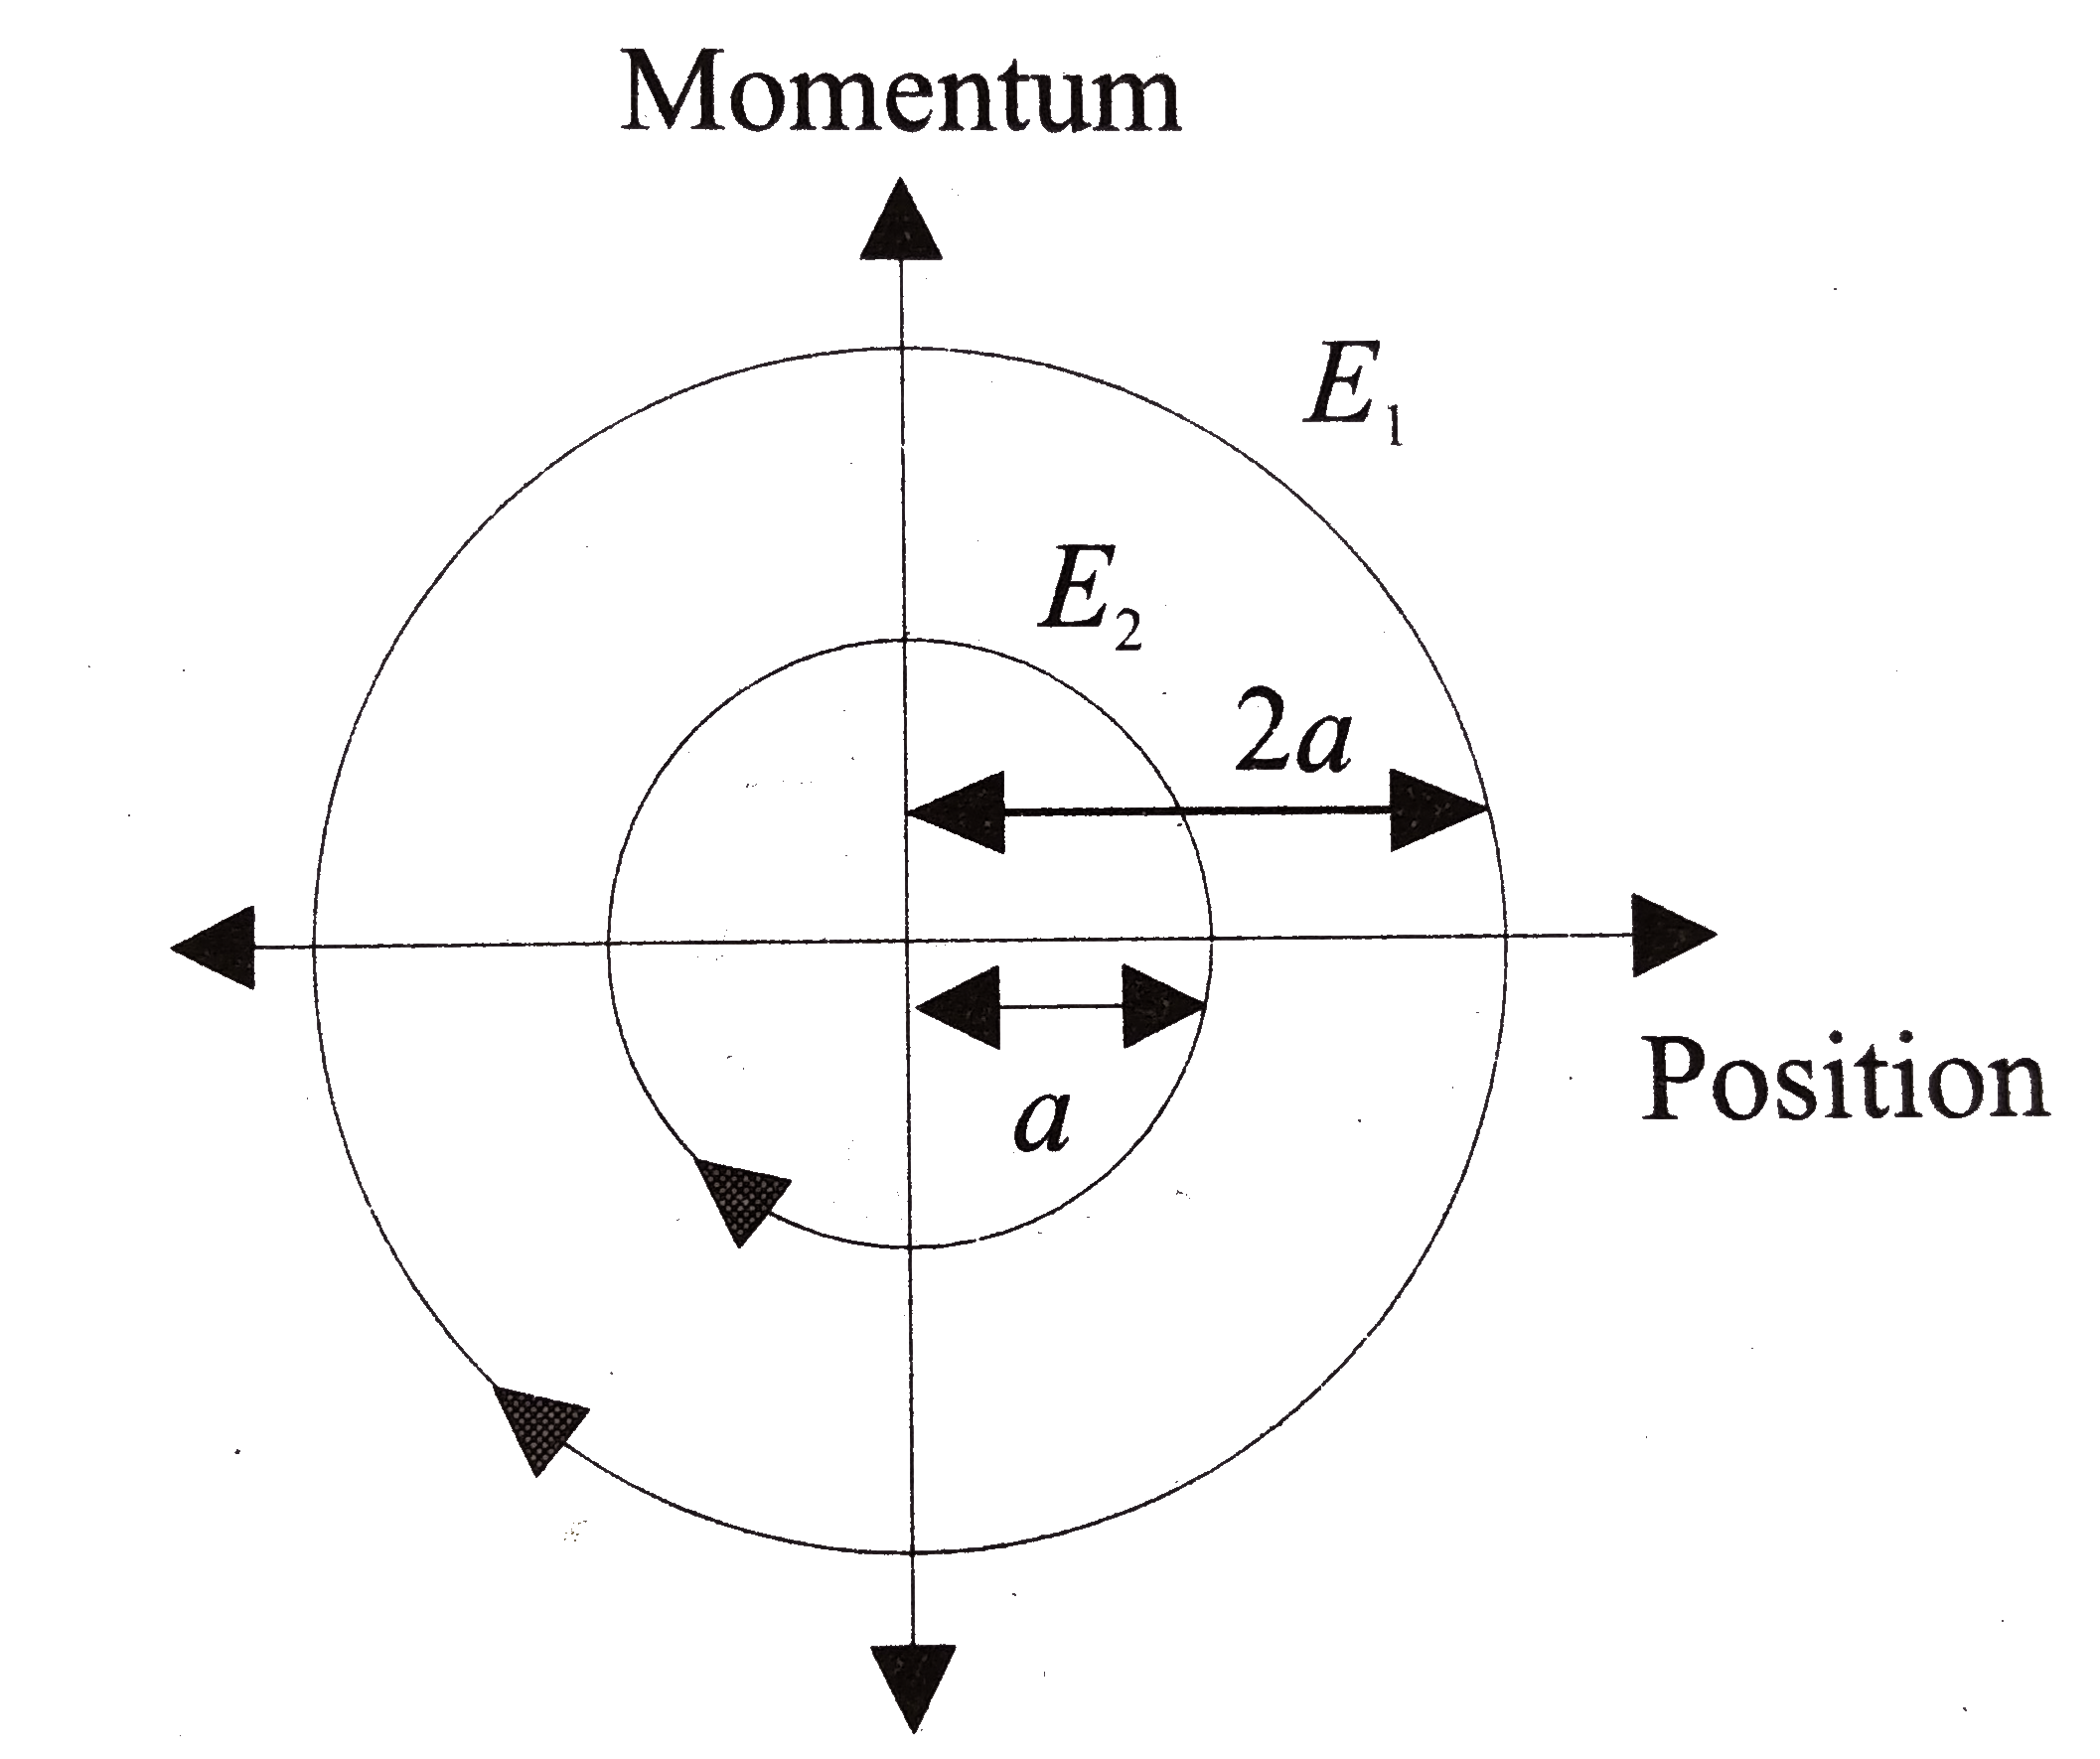
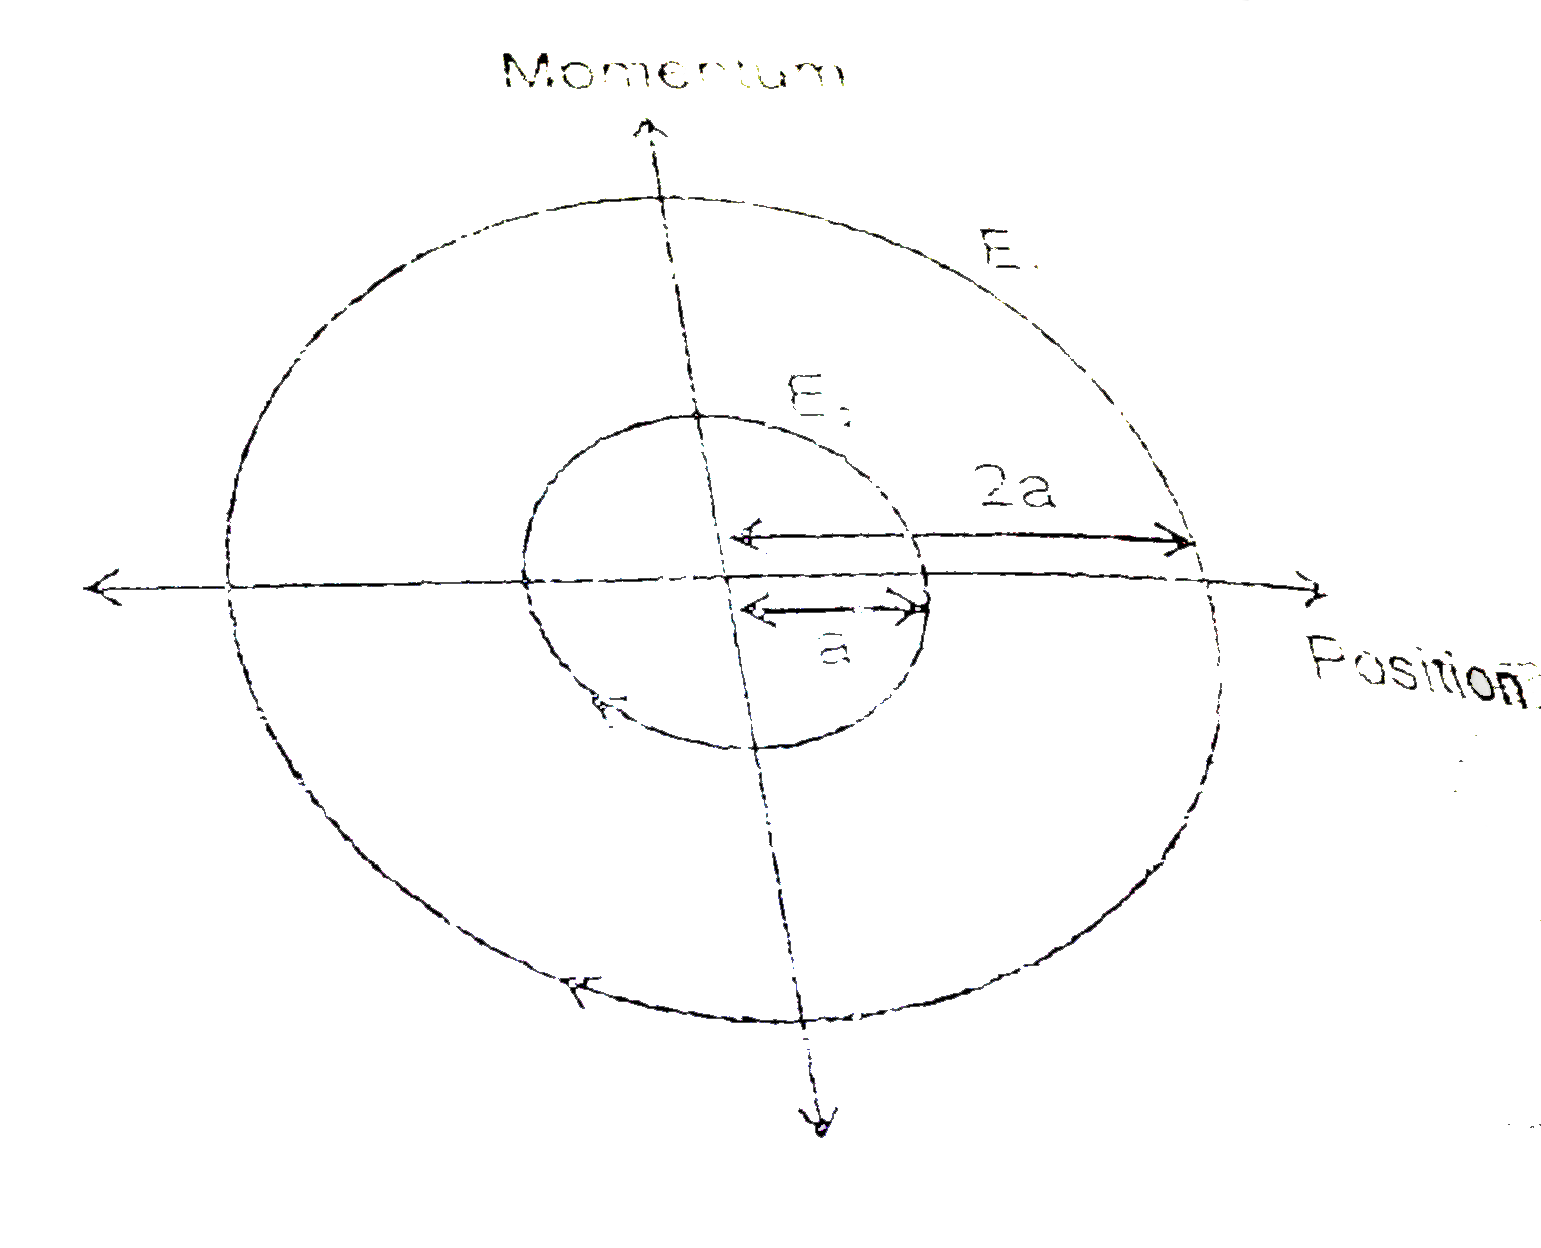
The phase space diagram for simple harmonic motion is a circle centred at the origin. In (Fig. 8.14), the two circles represent the same oscillator but for different initial conditions, and E1andE2 are the total mechanical energies respectively. Then.
 .
.
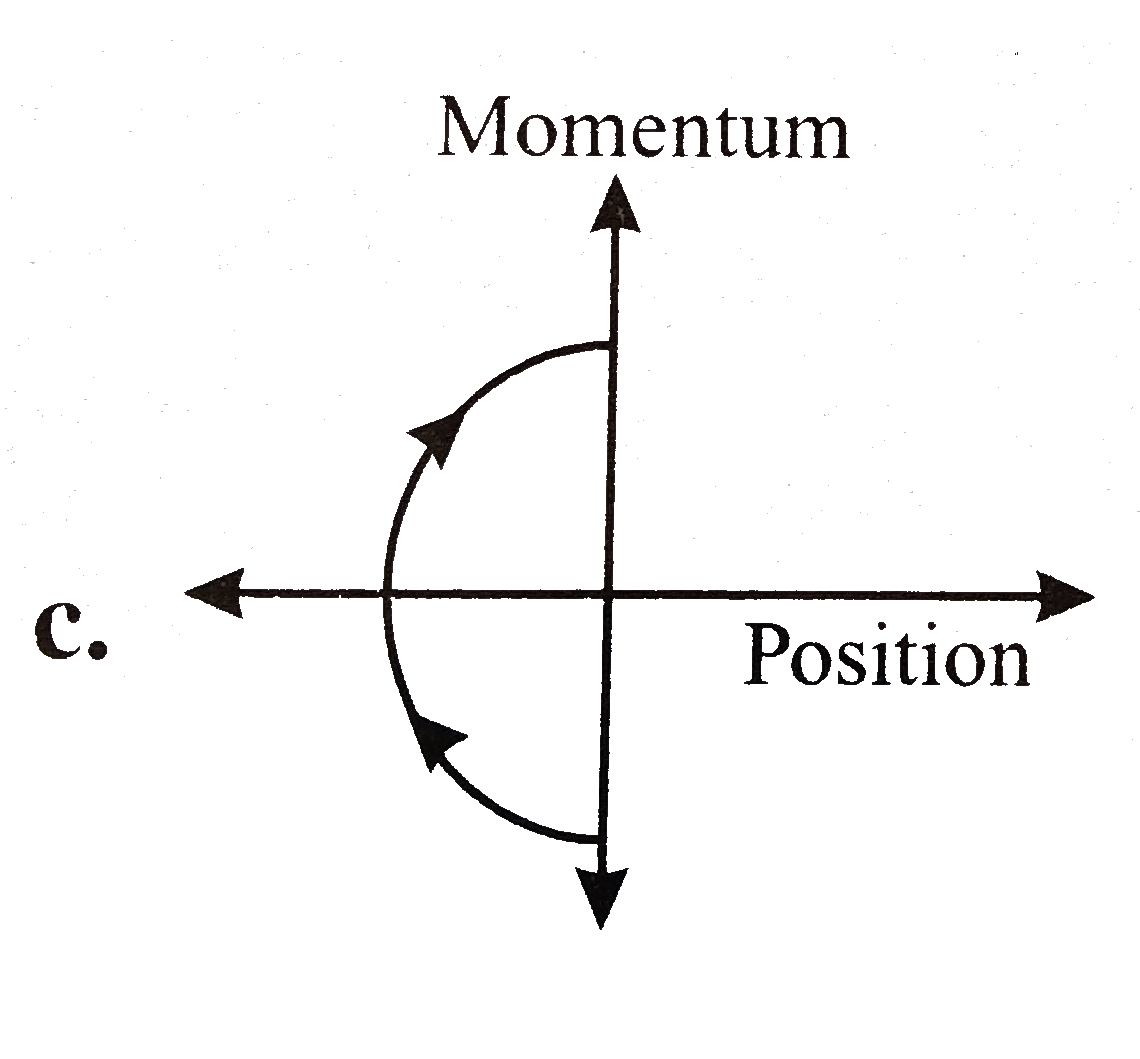
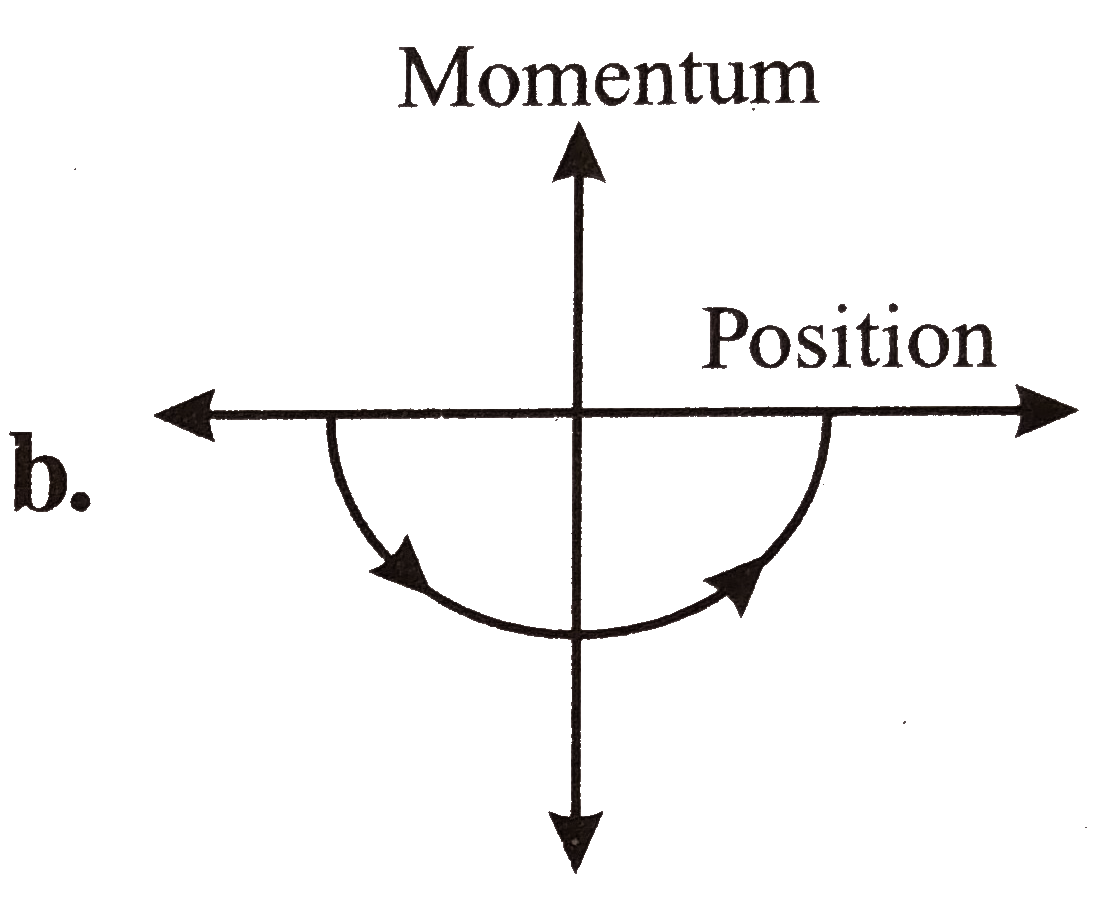
The correct Answer is:D
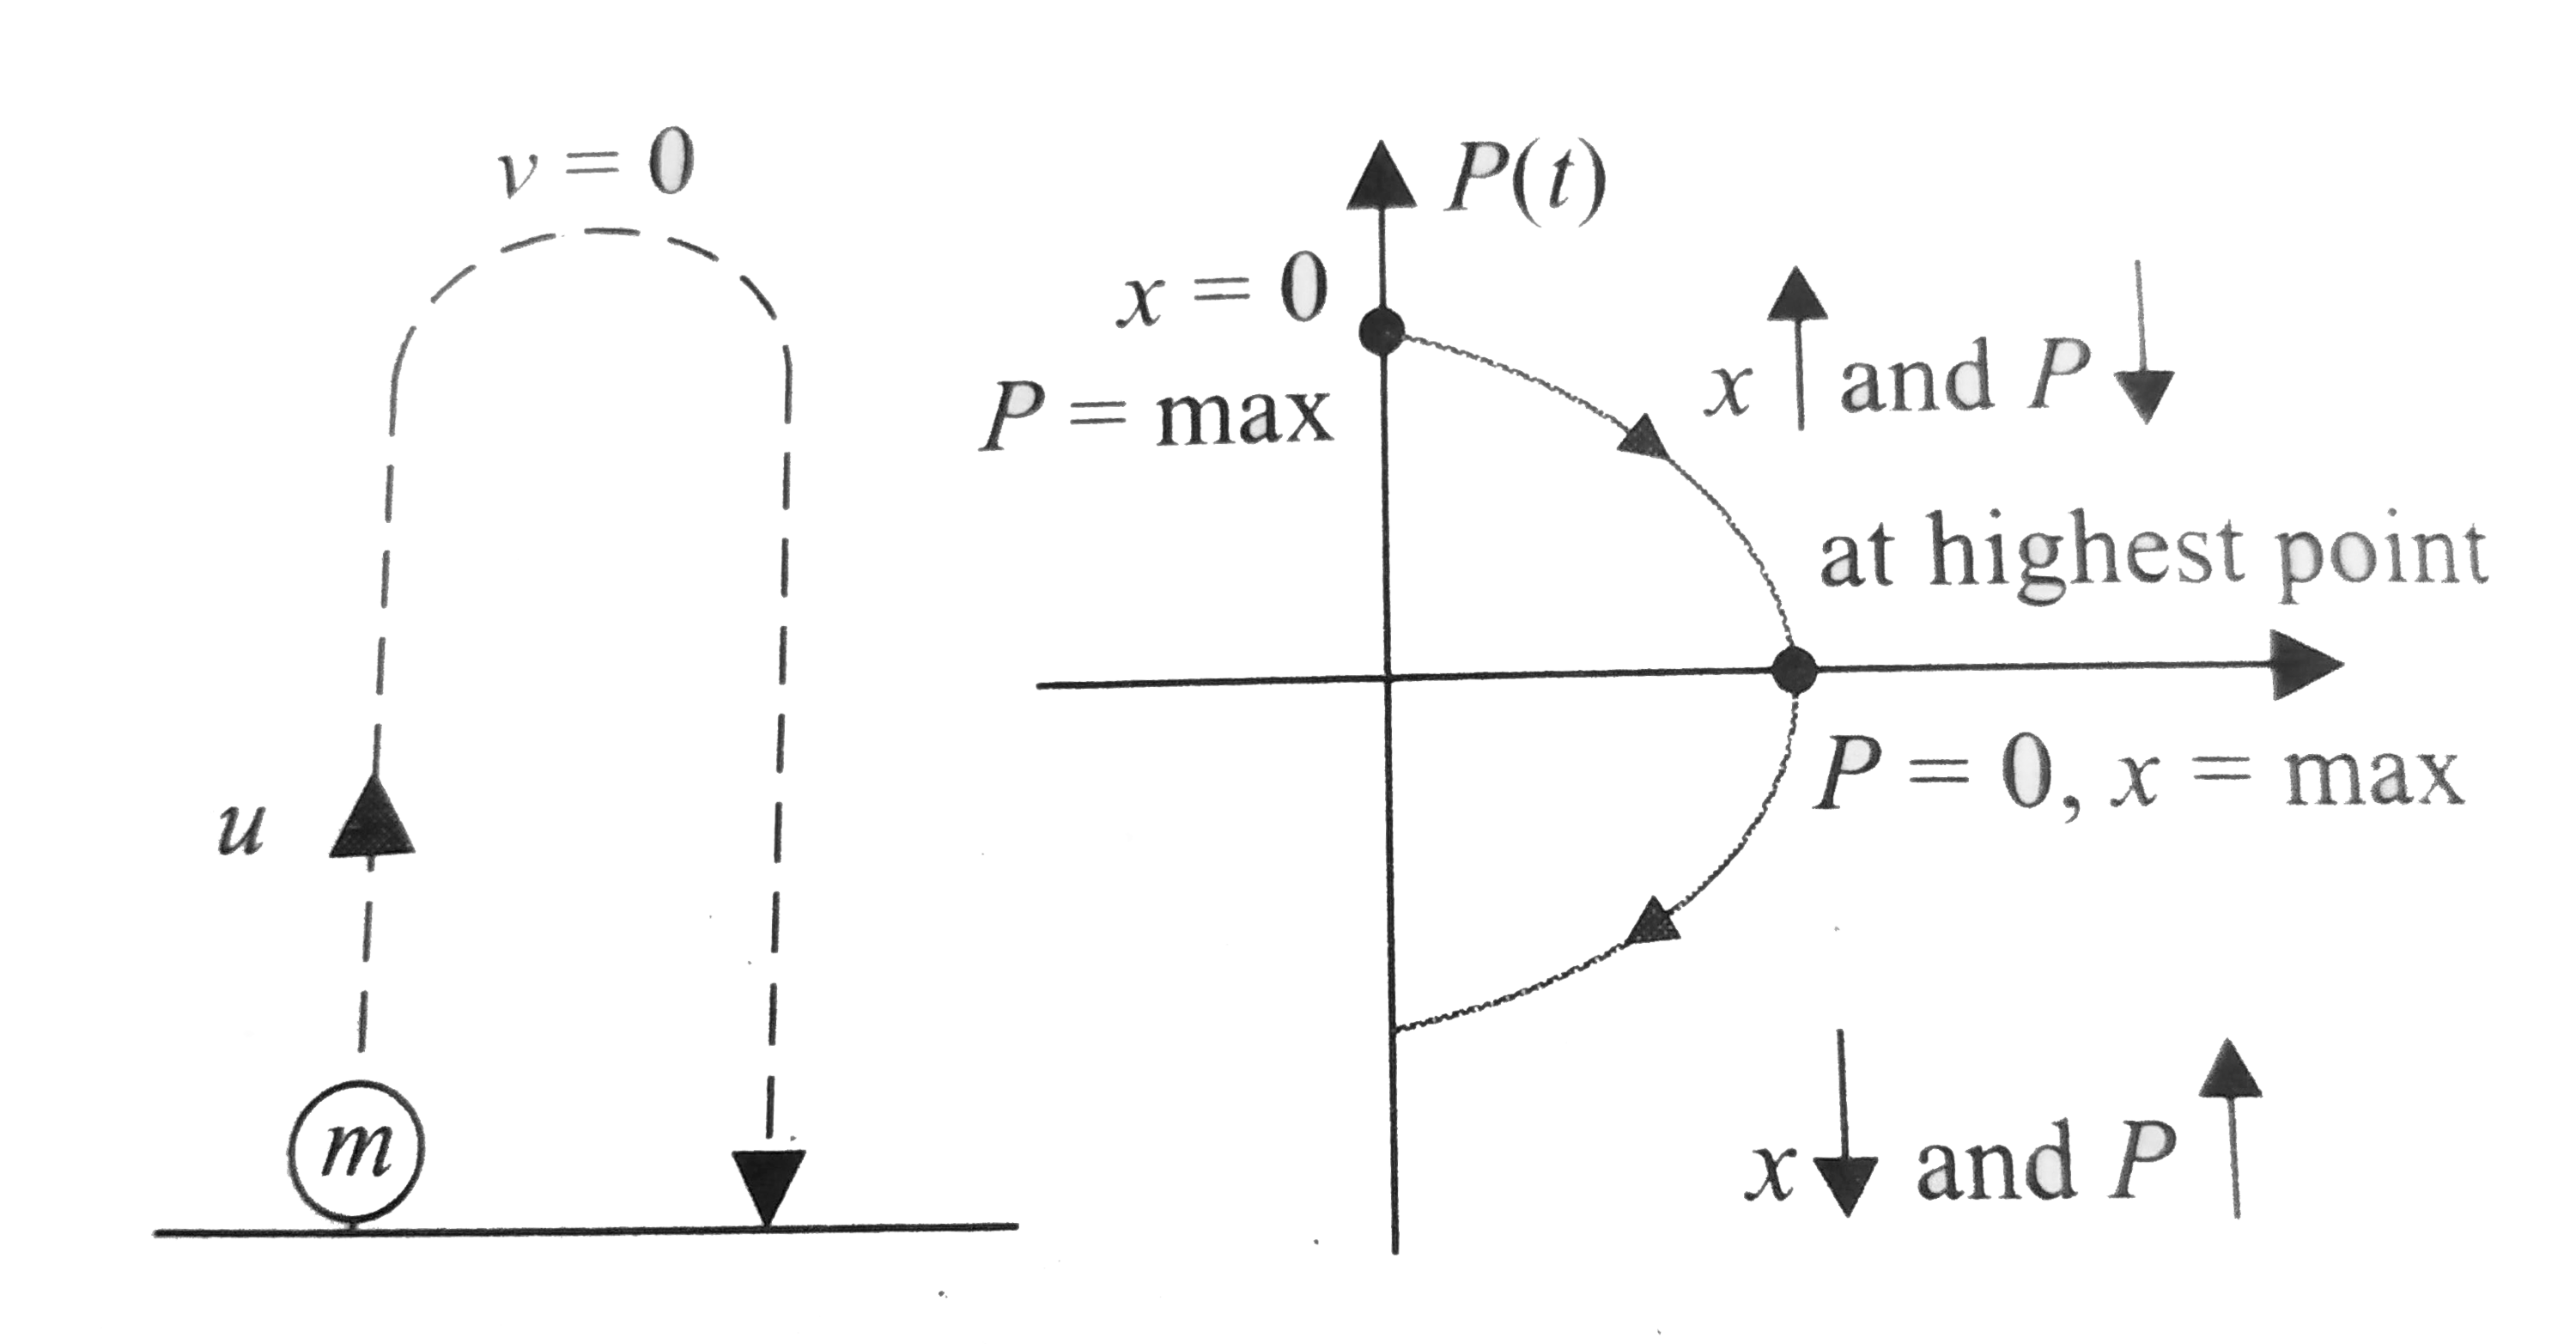 .
.
Topper's Solved these Questions
- ARCHIVES 2 VOLUME 6BOOK - CENGAGE PHYSICS ENGLISHCHAPTER - ARCHIVES 2 VOLUME 6EXERCISE - Integer
4 Videos
- ARCHIVES 2 VOLUME 6BOOK - CENGAGE PHYSICS ENGLISHCHAPTER - ARCHIVES 2 VOLUME 6EXERCISE - Multiple Correct
22 Videos
- ARCHIVES 1 VOLUME 6BOOK - CENGAGE PHYSICS ENGLISHCHAPTER - ARCHIVES 1 VOLUME 6EXERCISE - Integer
4 Videos
- BASIC MATHEMATICSBOOK - CENGAGE PHYSICS ENGLISHCHAPTER - BASIC MATHEMATICSEXERCISE - Exercise 2.6
20 Videos
Similar Questions
Phase space diagrams are useful tools in analysing all kond of dynamical problems. Theya re especially useful in studying the changes in motion as initial position and momentum are changed. Here we consider some simple dynamical system in one-dimelnsion. for such systeam, phase space is a plane in which position is plotted along horizontal axis and momentum is plotted along vertical axis. The phase space diagram is x(t) vs. p(t) curve in this plane. The arrow on the curve indicates the time flow. for example, the phase space diagram for a particle moving with constant velocity is a straight line as shown in the figure. We use the sign convention in which position or momentum. upwards (or to right) is positive and downwards (or to left) is negative.
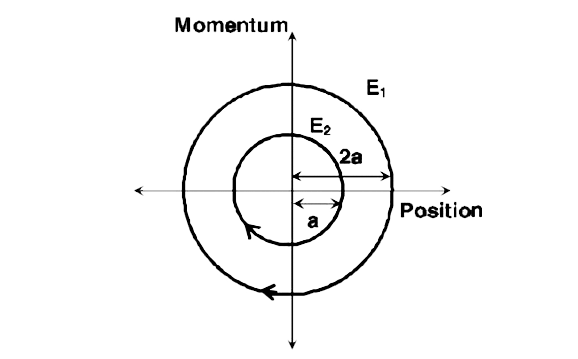
The phase space diagram for simple harmonic motion is a circle cen-tered at the origin.In the figure, the two circles represent the same oscillator but for different initial conditions, and E1 for E2 are the total mechanical energies respectively. Then
View SolutionPhase space deagrams are useful tools
 .
.
in analyzing all kinds of dynamical problems. They are especially usrful in studying the changes in motion as initial position and momenum are changed. Here we conseder some simple dynamical systems in one dimension. For such systems, phase space is a plane in which position is plotted along horizontal axis and momentum is plotted along vertical axis. The phase space diagram is x(t) vs. p(t) curve in this plane. The arrow on the curve indicates the time flow. For example, the phase space diagram for a particle moving with constant velocity is a straight line as shown in the figure. We use the sign convention in which positon or momentum upwards (or to right) is poitive and downwards (or to left) is negative.
The plase space deagram for simple harmonic motion is a circle centered at the origin. In the figure, the two circles represent the same oscillator but for different initial condetions, and E_(1) and E_(2) the total mechanical energies respectivey.
 .
.
View Solution
Knowledge Check
The differential equation of a particle executing simple harmonic motion along y-axis is
Ad2ydt2+ω2y=0Bd2ydt2+ω2y2=0Cd2ydt2−ω2y=0Ddydt+ωy=0
Phase space diagrams are useful tools in analysing all kond of dynamical problems. Theya re especially useful in studying the changes in motion as initial position and momentum are changed. Here we consider some simple dynamical system in one-dimelnsion. for such systeam, phase space is a plane in which position is plotted along horizontal axis and momentum is plotted along vertical axis. The phase space diagram is x(t) vs. p(t) curve in this plane. The arrow on the curve indicates the time flow. for example, the phase space diagram for a particle moving with constant velocity is a straight line as shown in the figure. We use the sign convention in which position or momentum. upwards (or to right) is positive and downwards (or to left) is negative.
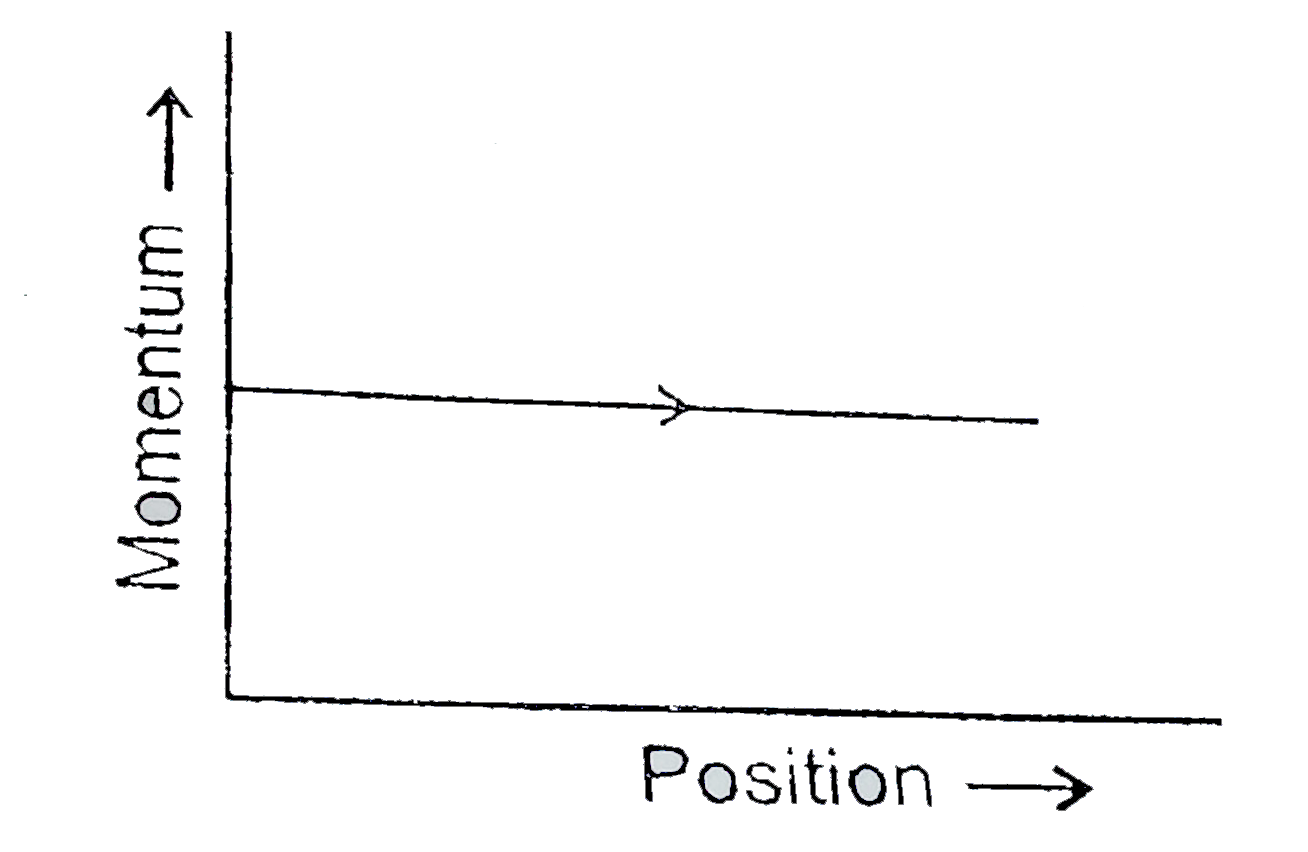
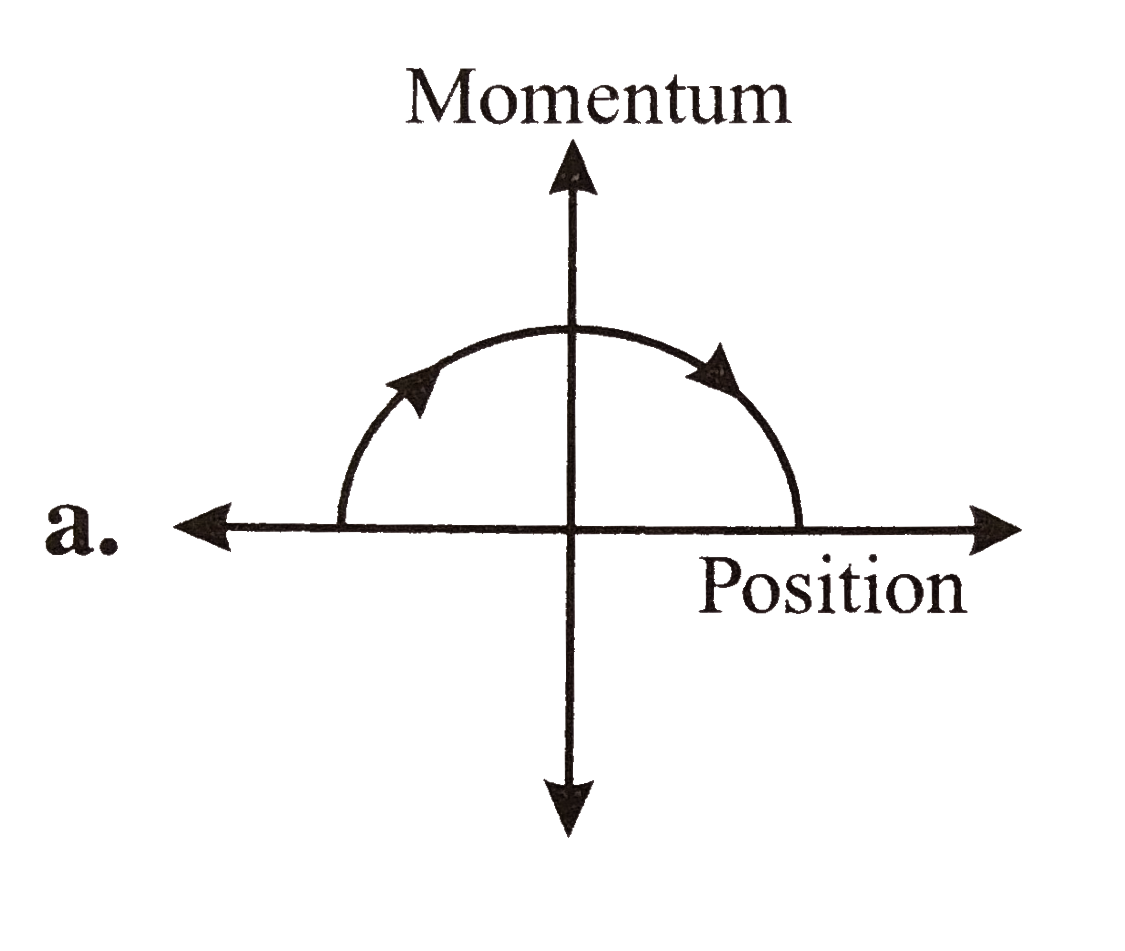
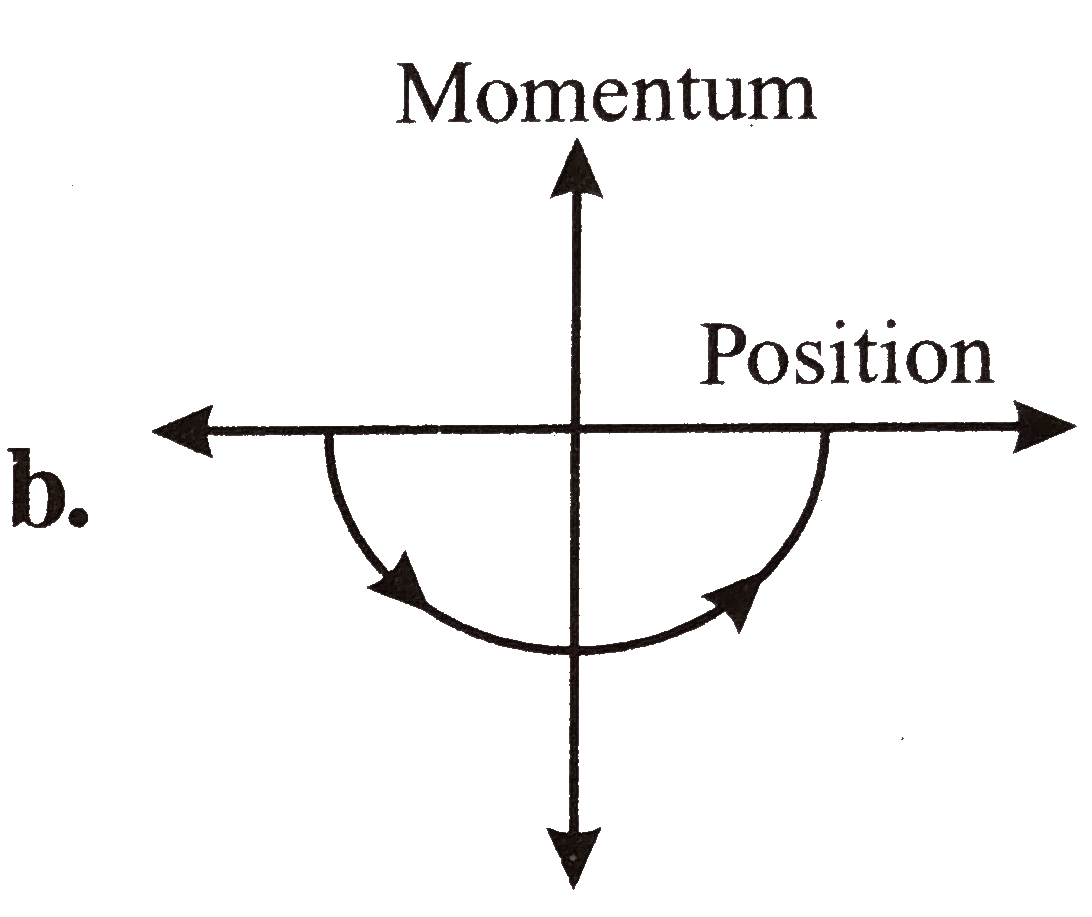
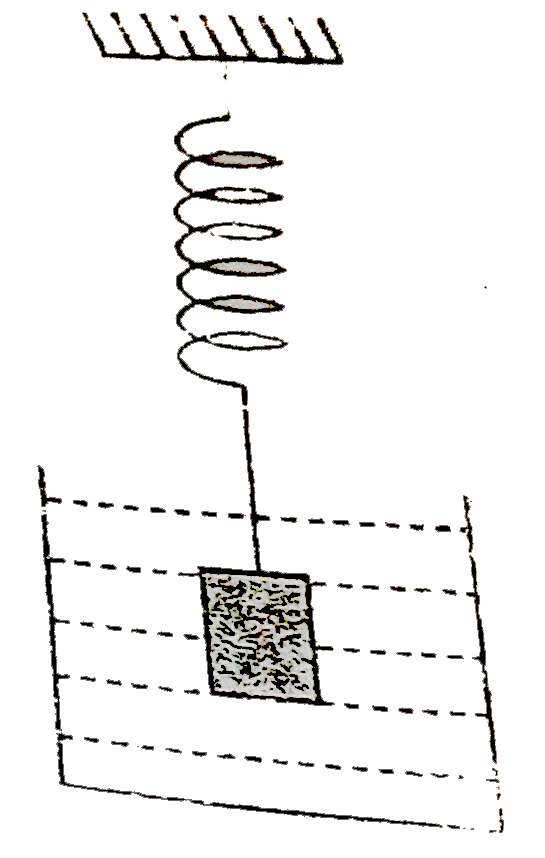
Consider the spring-mass system, with mass submerged in water, as shown in the figur, the phase diagram for one cycle of this system is :
View SolutionWrite phase changes in the diagram.
View SolutionIn which motion momentum change but kinetic energy does not ?
View SolutionThe entropy change for a phase transformation is :
View SolutionA horizontal disc is rotating about a vertical axis passing through its centre. If an insect moves from centre to rim then the angular momentum of the system
View SolutionThe composition of two simple harmonic motions of equal periods at right angle to each other and with a phase difference of π results in the displacement of the particle along
View SolutionUsing the second law of motion show that impulse is equal to the change in momentum.
View Solution
