Plot the graph of potential energy as a function of θSolution in Marathi
Step by step video & image solution for Plot the graph of potential energy as a function of theta by Physics experts to help you in doubts & scoring excellent marks in Class 12 exams.
Updated on:21/07/2023Topper's Solved these Questions
- Magnetic MaterialsBOOK - CHETANA PUBLICATIONCHAPTER - Magnetic MaterialsEXERCISE - EXERCISE
74 Videos
- Magnetic Fields due to Electric CurrentBOOK - CHETANA PUBLICATIONCHAPTER - Magnetic Fields due to Electric CurrentEXERCISE - Exercise
96 Videos
- MECHANICAL PROPERTIES OF FLUIDSBOOK - CHETANA PUBLICATIONCHAPTER - MECHANICAL PROPERTIES OF FLUIDSEXERCISE - Exercise
91 Videos
Similar Questions
The susceptibility magnesium is 1.5×10⁻⁵ at 300 K. What will be its susceptibility at 200 K?
View SolutionFind the magnetic induction at a distance of 5 cm from a long straight wire carrying a current of 5A
View SolutionA needle of length 6 cm can stay afloat on water. Find weight of the needle. (Surface tension of water 0.075N/m)
View SolutionFor a simple pendulum, a graph is plotted its kinetic energy (KE) and potential energy (PE) against its displacement d. Which one of the following represents these correctly?
View SolutionFigure shows a plot of the conservative force F in a unidimensional field. The plot representing the function corresponding to the potential energy (U) in the field is
View SolutionThe stopping potential as a function of the frequency of the incident radiation is plotted for two different photoelectric surfaces A and B . The graphs show that work function of A is

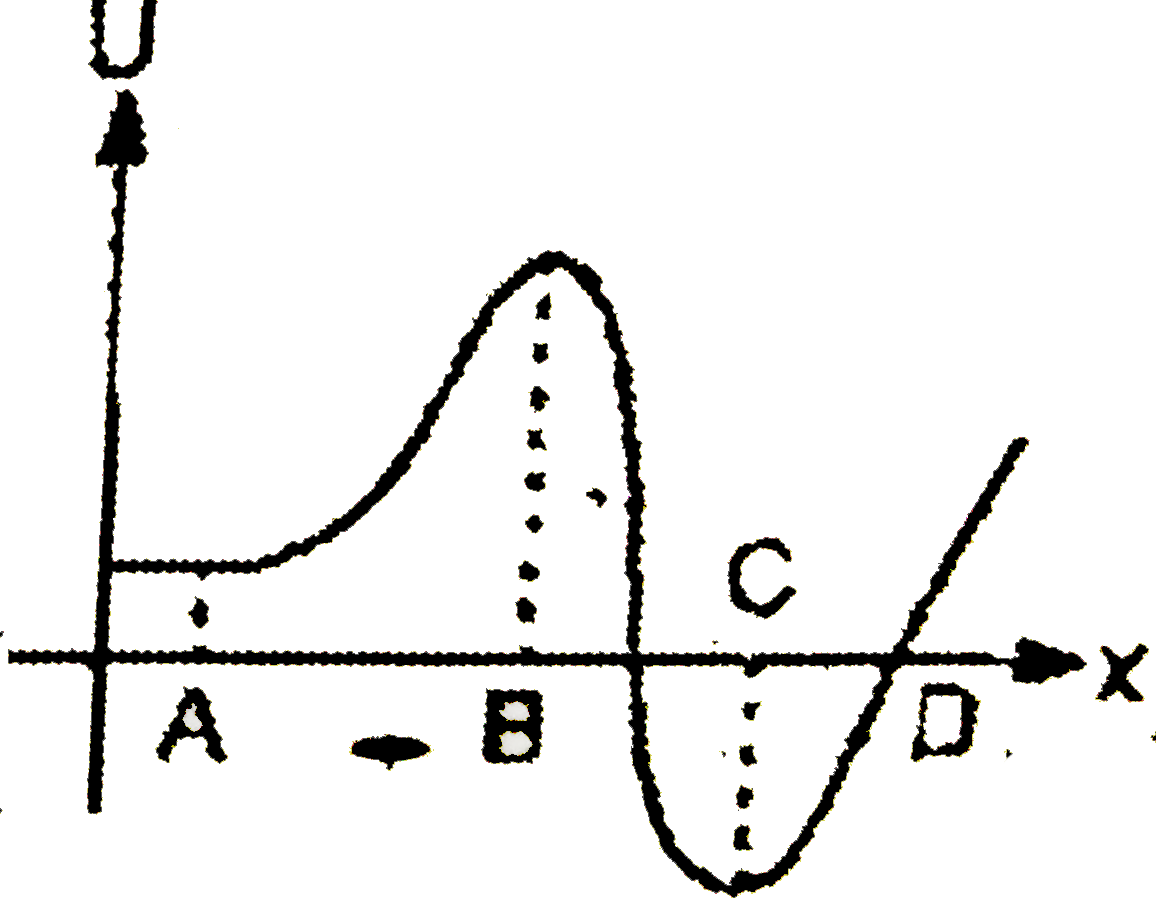
View SolutionThe following plot shows the variation of potential energy (U) of a system versus position (x). From the graph we can interpret that :

View SolutionThe stopping potential as a function of frequency of incident radiation is plotted for two different photoelectric surfaces A and B . The graphs as shown in figure shows that , the work function of A is
View SolutionPlot a graph of resistivity of a semiconductor as a function of absolute temperature.
View SolutionFigure given below shows the plot of the conservative force F, in a unidimensional field. The plot representing the function corresponding to the potential energy (U) in the field is :
View SolutionPlot a graph of the de - Broglie wavelength associated with electron as a function of accelerating potential .
View SolutionDraw the plot of binding energy per nucleon as a function of mass number and write two important conclusion obtained from the graph.
View SolutionA spring of spring constant k is stretched by distance r. Obtain formula for elastic potential energy of a stretched spring. Plot graph of energies versus distance.
View SolutionDraw a plot of potential energy of a pair of nucleons as a function of their separation. What is the significance of negative potential energy in the graph drawn ?
View SolutionExplain and draw the graphs of kinetic energy, potential energy and total energy as a function of time.
View Solution
