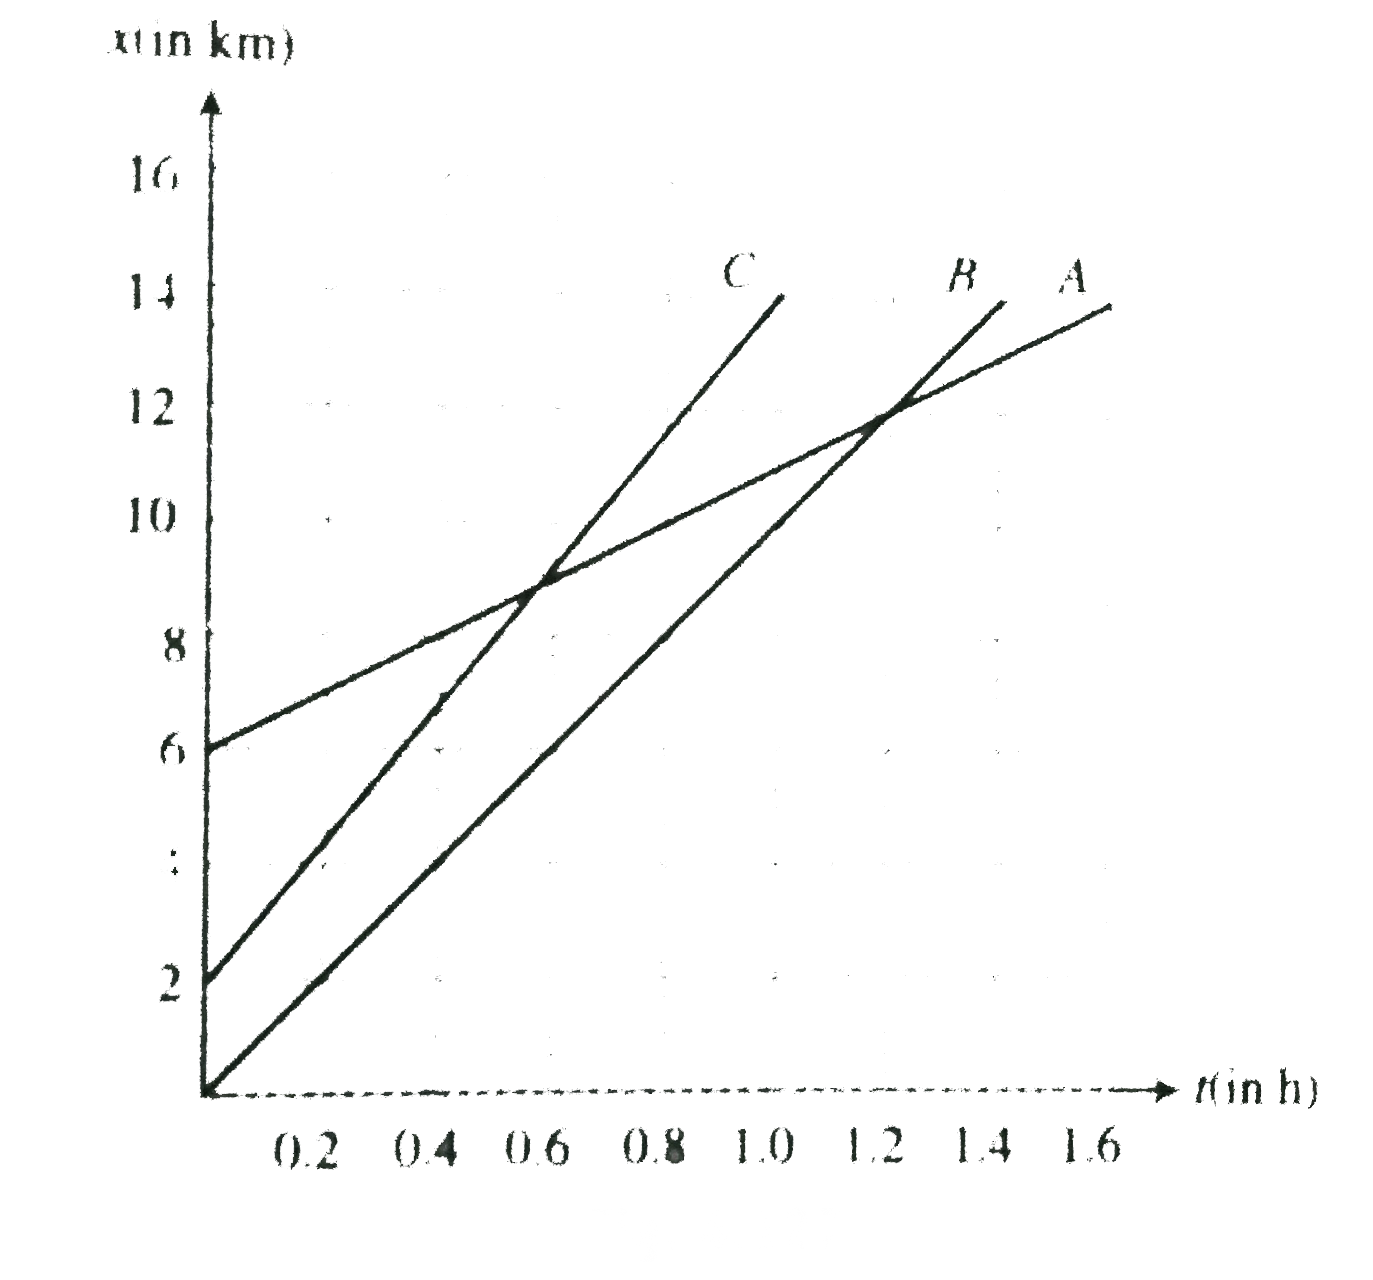
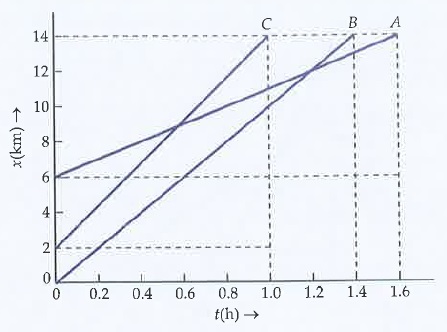
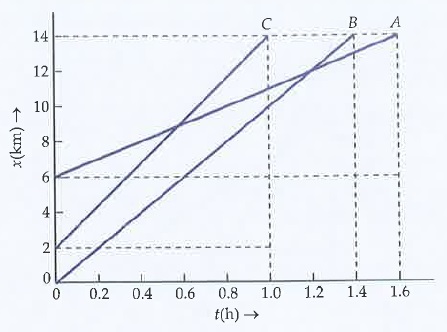
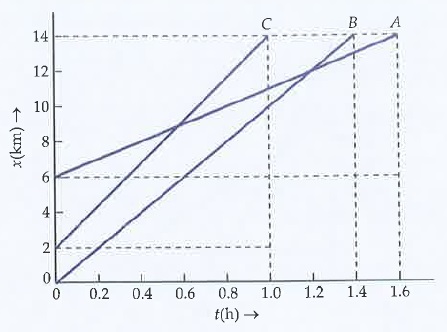
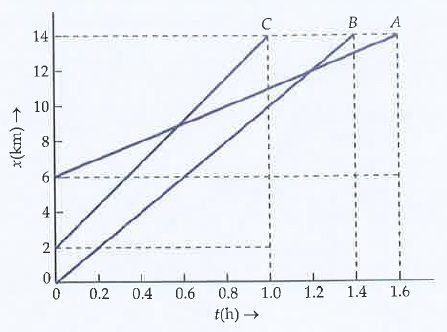
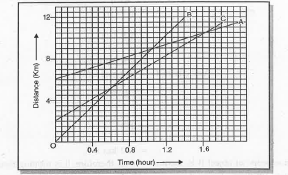
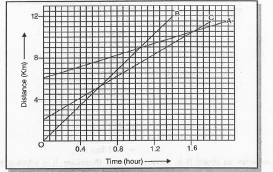
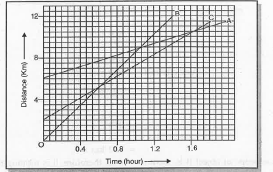
Shows the position-time graphs of three cars A,B and C On the basis of the graphs answer the follwing questions:
 .
.
a. Which car has the highest speed and which the lowest?
b. Are the three cars evrs at the same point on the road?
c. When C passes A, wher is B?
d. What is the time interval during car A travel between the time it passed cars B and C ?.
e. What is the relative velocty of car B with respect to car C?
a. The slope for position time graph gives the velocity
Slope of line A=velocity of car A
=14−61.6−0=81.6=5kmh−1
Slope of line B= velpcoty of car B=14−61.4−0=10kmh−1
Slopl of line =velovity of car C=14−41−0=12kmh−1
Hence car C has hieghest speed and car A has lowest speed. b. As clear form graph, the position of all three cars are bot same at any time, Hence the three cars never at the same point on the road.
c. From graph it is clear car B is apprximately 6km from the origin.
d. From graph car A travels berweenthe time it palled cars B and C=1.2−0.6−0.6h
e. Relative velocity of car C with respect to car A,
→v,a=→vc−→vA=12≡7kmh−1
f. Relative velocity of car B with respect to car C
→vB,C=→vB−→–––(C)=0−12=−2kmh2.
Topper's Solved these Questions
- KINEMATICS-1BOOK - CENGAGE PHYSICSCHAPTER - KINEMATICS-1EXERCISE - Subjective
29 Videos
- KINEMATICS-1BOOK - CENGAGE PHYSICSCHAPTER - KINEMATICS-1EXERCISE - Single Correct
52 Videos
- KINEMATICS-1BOOK - CENGAGE PHYSICSCHAPTER - KINEMATICS-1EXERCISE - Exercise 4.3
15 Videos
- GRAVITATIONBOOK - CENGAGE PHYSICSCHAPTER - GRAVITATIONEXERCISE - INTEGER_TYPE
1 Videos
- KINEMATICS-2BOOK - CENGAGE PHYSICSCHAPTER - KINEMATICS-2EXERCISE - Exercise Integer
9 Videos
Similar Questions
Figure 3.64 shows the position-time graphs of three car A, B and C. On the basis of the graphs, answer the following questions : Which car has the highest speed and which the lowest ?
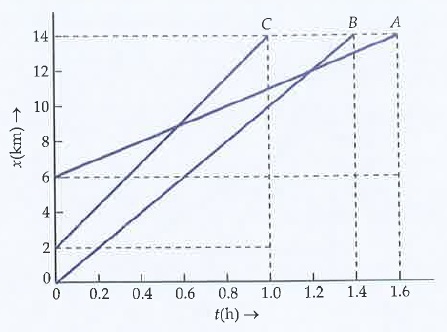
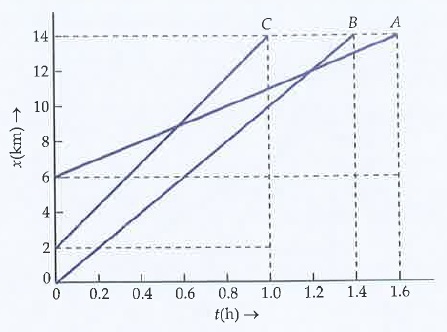
View SolutionFigure 3.64 shows the position-time graphs of three car A, B and C. On the basis of the graphs, answer the following questions : When A passes C, where is B ?
View Solution
Knowledge Check
Figure shows position-time graph of two cars A and B.
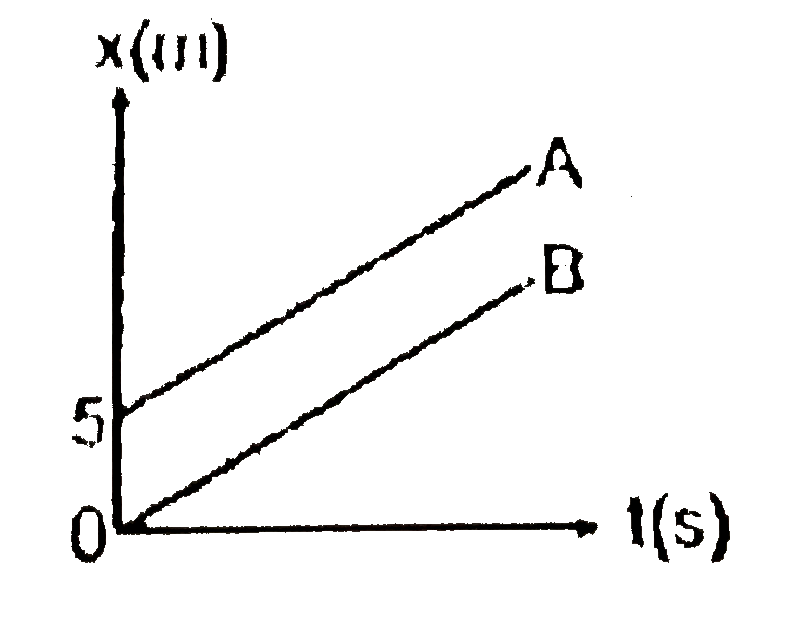 ACar A is faster than car B.BCar B is faster than car A.CBoth cars are moving with same velocity.DBoth cars have positive acceleration.
Figure shows the position-time graphs of three car A, B and C. On the basis of the graphs, answer the following questions : What is the relative velocity of car C with respect to car A ?
View SolutionFigure shows the position-time graphs of three car A, B and C. On the basis of the graphs, answer the following questions : What is the relative velocity of car B with respect to car C ?
View SolutionFigure 3.64 shows the position-time graphs of three car A, B and C. On the basis of the graphs, answer the following questions : Are the three cars ever at the same point on the road ?
View SolutionFigure 3.64 shows the position-time graphs of three car A, B and C. On the basis of the graphs, answer the following questions : How far did car A travel between the time it passed cars B and C ?
View SolutionFig 1.11 show the distance - time graphs of three A,B and C. Study the graph and answer the following question : Which of the three is travelling the fastest ?
View SolutionFig 1.11 show the distance - time graphs of three A,B and C. Study the graph and answer the following question : How far has C travelled when B passes A ?
View SolutionFig 1.11 show the distance - time graphs of three A,B and C. Study the graph and answer the following question : Are all three ever at the same point on the road ?
View Solution
