Sketch a graph to show how the reactance of an inductor varies as a function of frequency.Solution in Bengali
We Know, XL=ωL=2πfL[∵f=ω2π]
where, f is the frequency of ac supply.
For a given voil, L is constant.
∴XL∝f
So, inductive reactance is directly proportional to the frequency of the current, Thus f−XL graph is straight line passing through the origin [FIg.2.36].

Topper's Solved these Questions
- ALTERNATING CURRENT BOOK - CHHAYA PUBLICATIONCHAPTER - ALTERNATING CURRENT EXERCISE - NCERT TEXTBOOK QUESTIONS WITH ANSWER HINT
33 Videos
- ALTERNATING CURRENT BOOK - CHHAYA PUBLICATIONCHAPTER - ALTERNATING CURRENT EXERCISE - NCERT TEXTBOOK QUESTIONS WITH ANSWER HINT (MCQ-1)
4 Videos
- ALTERNATING CURRENT BOOK - CHHAYA PUBLICATIONCHAPTER - ALTERNATING CURRENT EXERCISE - CBSE SCANNER
33 Videos
- BOOK - CHHAYA PUBLICATIONCHAPTER - EXERCISE - EXAMPLE
1 Videos
- ATOMBOOK - CHHAYA PUBLICATIONCHAPTER - ATOMEXERCISE - CBSE SCANNER
18 Videos
Similar Questions
60μF capacitor to a 110 V, 60 Hz ac supply. Determine the rms value of the current in the circuit. What is the net power absorbed by the circuit over a complete cycle?
View SolutionA small town with a demand of 800 kW of power at 220 V is situated 15 km away from an electric plant generating power at 440 V. The resistance of the two wire line carrying power is 0.5Ω.km−1. The line gets power from the line through a 4000-220 V step-down transformer at a substation in the town.
Characterise the step-up transformer at the plant.
View SolutionMention the two characteristic properties of the material suditable for making core of a transformer.
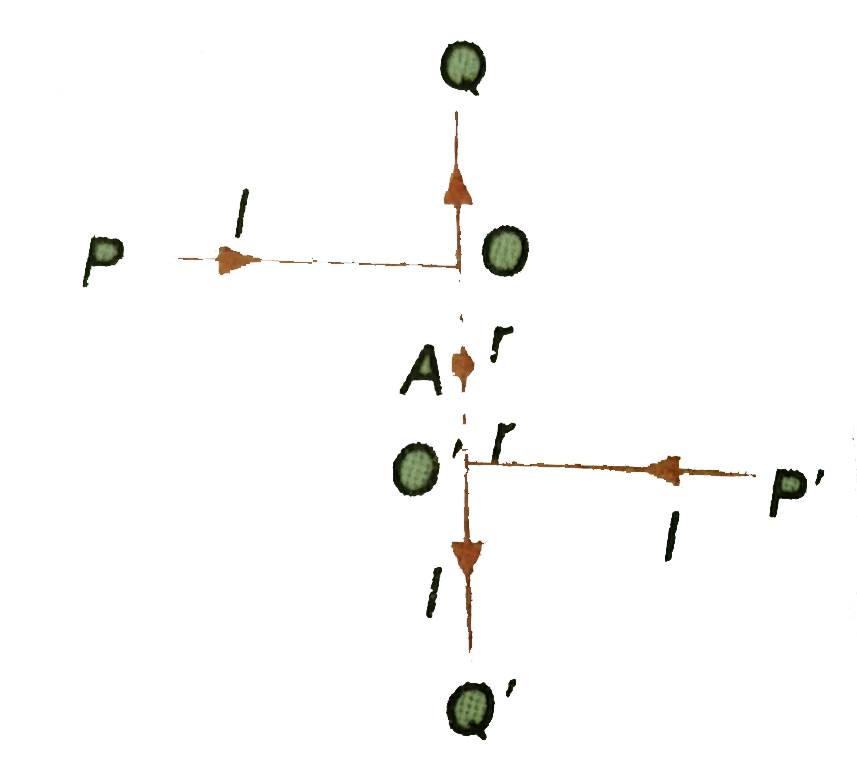
View SolutionThrough each of the two wires POQ and P'O'Q and electric current I is passing [Fig. 1.23]. The points Q,O,O and Q' are collinear. Determine the magnetic field at the midpoint A of OO'.

View SolutionUsing de Broglie's hypothesis , explain with the help of a suitable diagram , Bohr's second postulate of quantisation of energy levels in a hydrogen atom.
View SolutionSketch a graph to show how the reactance of(i) a capacitor (ii) an inductor varies as a function of frequency ?
View SolutionThe figure shows the graphical variation of the reactance of a capacitor with frequency of ac source. (a) find the capacitance of the capacitor (b)an ideal inductor has the same reactance at 100 Hz frequency as the capacitor has the same frequency find the value of the inductor. (c) draw the graph showing the variation of the reactance of this inductor with frequency
View SolutionSketch a graph to show how the reactance of a capacitor varies as a function of frequency.
View SolutionDraw a graph showing the variation of reactance of (i) a capacitor and (ii) an inductor with the frequency of an a.c circuit.
View SolutionSketch a graph that shows change in reactance with frequency of a series LCR circuit.
View SolutionHow the reactance of an inductor depends on frequency ?
View SolutionThe figure shows the graphical variation of the reactance of a capacitor with frequency of ac source. (a) find the capacitance of the capacitor (b)an ideal inductor has the same reactance at 100 Hz frequency as the capacitor has the same frequency find the value of the inductor. (c) draw the graph showing the variation of the reactance of this inductor with frequency
View SolutionHow does inductive reactance.XL of an inductor vary in d.c.and high frequency a.c. circuit ?
View SolutionSketch a graph showing the variation of reactance of an inductor with frequency of the applied voltage
View SolutionSketch a graph showing the variation of capacitive reactance with the change in frequency of the a.c. source.
View Solution
