The figure shows the graphical variation of the reactance of a capacitor with frequency of ac source.
(a) find the capacitance of the capacitor
(b)an ideal inductor has the same reactance at 100 Hz frequency as the capacitor has the same frequency find the value of the inductor.
(c) draw the graph showing the variation of the reactance of this inductor with frequency

Step by step video & image solution for The figure shows the graphical variation of the reactance of a capacitor with frequency of ac source. (a) find the capacitance of the capacitor (b)an ideal inductor has the same reactance at 100 Hz frequency as the capacitor has the same frequency find the value of the inductor. (c) draw the graph showing the variation of the reactance of this inductor with frequency by Physics experts to help you in doubts & scoring excellent marks in Class 12 exams.
Updated on:21/07/2023Similar Questions
Knowledge Check
In a pure capacitive circuit if the frequency of ac source is doubled, then its capacitive reactance will be
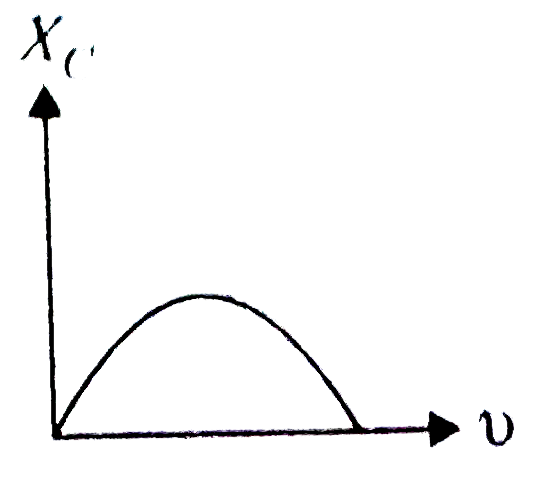
Aremains sameBdoubledChalvedDzeroIdentify the graph which correctly reperesents the variation of capacitive reactance XC with frequency
A B
B C
C D
D
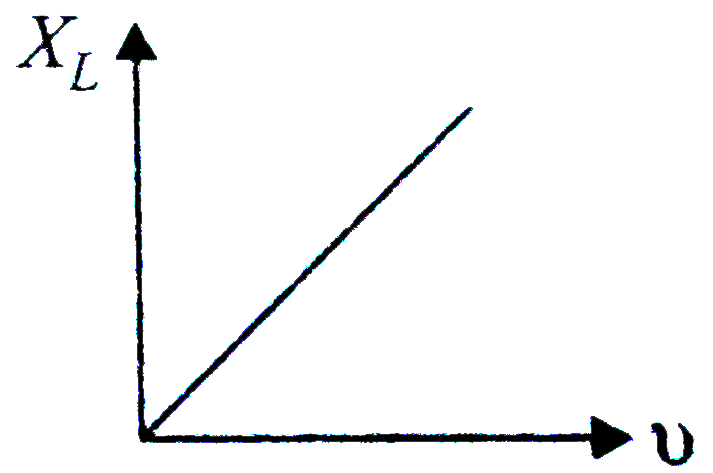
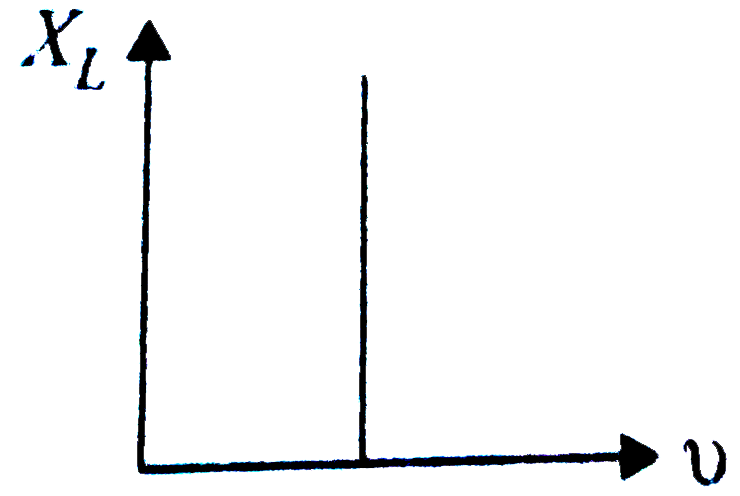
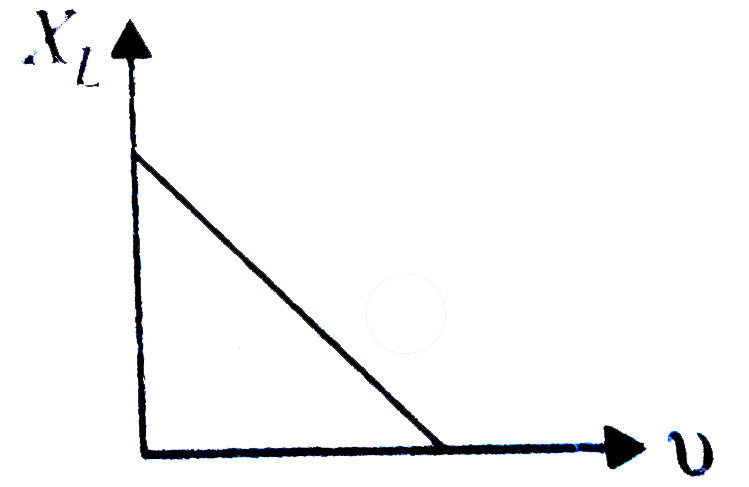
Which of the following graphs represent the correct variation of inductive reactance XL with frequency υ?
A B
B C
C D
D
Draw a labelled graph showing the variation of inductive reactance (XL) verses frequency (f)
View SolutionIdentify the graph which correctly reperesents the variation of capacitive reactance XC with frequency
View SolutionDraw a labelled graph showing variation of impedance of a series LCR circuit with frequency of the a.c. supply.
View SolutionA coil has an inductance of 1 henry. (a) At what frequency will it have a reactance of 3142 ohm? (b) What should be the capacity of a condenser which has the same reactanc at frequency ?
View SolutionWhich of the following curves correctly represent the variation of capacitve reactance (XC) with frequency (f) ?
View Solution