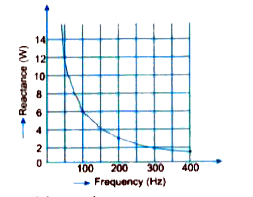
The figure shows the graphical variation of the reactance of a capacitor with frequency of ac source.
(a) find the capacitance of the capacitor
(b)an ideal inductor has the same reactance at 100 Hz frequency as the capacitor has the same frequency find the value of the inductor.
(c) draw the graph showing the variation of the reactance of this inductor with frequency

Step by step video & image solution for The figure shows the graphical variation of the reactance of a capacitor with frequency of ac source. (a) find the capacitance of the capacitor (b)an ideal inductor has the same reactance at 100 Hz frequency as the capacitor has the same frequency find the value of the inductor. (c) draw the graph showing the variation of the reactance of this inductor with frequency by Physics experts to help you in doubts & scoring excellent marks in Class 12 exams.
Updated on:21/07/2023Similar Questions
The figure shows the graphical variation of the rectance of a capacitor with frequency of acsource.

(a) Find the capacitance of the capacitor.
(b) An ideal inductor has the same reactance at 100 Hz frequency as the capacitor has at the same frequency. Find the value of inductance of the inductor.
(c ) Draw the graph showing the variation of the rectance of this inductor with frequency.
View SolutionSketch a graph showing the variation of reactance of an inductor with frequency of the applied voltage
View Solution
Knowledge Check
The reactance of a 25μF capacitor at the AC frequency of 4000Hz is
A5πohmB√5πohmC10ohmD√10ohmThe reactance of a capacitor is XC. If both the frequency and the capacitance are double, then the new reactance will be
AXCB2XCCXC2DXC4
How the reactance of an inductor depends on frequency ?
View SolutionFind capacitive reactance of a capacitor connected to a dc source.
View SolutionPlot a graph showing variation of capacitive reactance with the change in the frequency of the AC source.
View SolutionFind the capacitance of the capacitor that would have a reactance of 100Ω when used with an a.c. source of frequency 5π kHz.
View SolutionSketch a graph showing the variation of capacitive reactance with the change in frequency of the a.c. source.
View SolutionWhat would be the equivalent reactance of a capacitor and inductor when these are connected to a DC source ?
View Solution
