State Hooke's law and describe with the help of a diagram, the behaviour of a copper wire which hangs vertically and is loaded with a gradually increasing load until it finally breaks. On the diagram mark the points (i) elastic limit (ii) yield point.
Step-by-Step Solution
Step 1: State Hooke's Law
Hooke's Law states that, for small deformations, the stress applied to a material is directly proportional to the strain produced in that material. Mathematically, it can be expressed as:
\(
\sigma = E \cdot \epsilon
\)
where:
- \( \sigma \) is the stress,
- \( E \) is the modulus of elasticity (proportionality constant),
- \( \epsilon \) is the strain.
Step 2: Understand the Behavior of Copper Wire
When a copper wire is hung vertically and subjected to a gradually increasing load, it will initially stretch in a linear manner according to Hooke's Law. As the load increases, the wire will undergo different stages of deformation until it reaches its breaking point.
Step 3: Draw the Stress-Strain Graph
1. X-axis: Strain (ε)
2. Y-axis: Stress (σ)
The graph will typically look like this:
- OA Region: The graph is a straight line, indicating that the wire is obeying Hooke's Law. This is the elastic region where the wire will return to its original length once the load is removed.
- Point A: This is the proportionality limit, where the linear relationship starts to deviate.
- AB Region: The wire continues to stretch, but it no longer follows Hooke's Law. This is the elastic limit or yield point.
- Point B: This is the yield point, where the material begins to deform plastically. Beyond this point, if the load is removed, the wire will not return to its original shape.
- Breaking Point: Eventually, as the load continues to increase, the wire will reach a point where it can no longer withstand the stress and will break.
Step 4: Mark Important Points on the Diagram
- Elastic Limit (Yield Point): Mark this point (B) on the graph, indicating the transition from elastic to plastic deformation.
- Proportionality Limit: Mark this point (A) on the graph, indicating the end of the linear relationship.
Diagram
Stress(σ)∣∣∣∣∣B(YieldP∮)∣∣|/|/∣∣∣|/|A(ProportionalityLimit)|/||/|∠_________________Stra∈(ε)
Hooke's Law states that, for small deformations, the stress applied to a material is directly proportional to the strain produced in that material. Mathematically, it can be expressed as:
\(
\sigma = E \cdot \epsilon
\)
where:
- \( \sigma \) is the stress,
- \( E \) is the modulus of elasticity (proportionality constant),
- \( \epsilon \) is the strain.
When a copper wire is hung vertically and subjected to a gradually increasing load, it will initially stretch in a linear manner according to Hooke's Law. As the load increases, the wire will undergo different stages of deformation until it reaches its breaking point.
1. X-axis: Strain (ε)
2. Y-axis: Stress (σ)
- OA Region: The graph is a straight line, indicating that the wire is obeying Hooke's Law. This is the elastic region where the wire will return to its original length once the load is removed.
- Point A: This is the proportionality limit, where the linear relationship starts to deviate.
- AB Region: The wire continues to stretch, but it no longer follows Hooke's Law. This is the elastic limit or yield point.
- Point B: This is the yield point, where the material begins to deform plastically. Beyond this point, if the load is removed, the wire will not return to its original shape.
- Breaking Point: Eventually, as the load continues to increase, the wire will reach a point where it can no longer withstand the stress and will break.
- Elastic Limit (Yield Point): Mark this point (B) on the graph, indicating the transition from elastic to plastic deformation.
- Proportionality Limit: Mark this point (A) on the graph, indicating the end of the linear relationship.
Stress(σ)∣∣∣∣∣B(YieldP∮)∣∣|/|/∣∣∣|/|A(ProportionalityLimit)|/||/|∠_________________Stra∈(ε)
Topper's Solved these Questions
- BOOK - ICSECHAPTER - PROPERTIES OF MATTEREXERCISE - MODULE 1 (ELASTICITY)SHORT ANSWER QUESTIONS20videos
PROPERTIES OF MATTER
- BOOK - ICSECHAPTER - PROPERTIES OF MATTEREXERCISE - MODULE 1 (ELASTICITY)VERY SHORT ANSWER QUESTIONS8videos
PROPERTIES OF MATTER
- BOOK - ICSECHAPTER - PROPERTIES OF MATTEREXERCISE - MODULE 1 (ELASTICITY)CONCEPTUAL SHORT ANSWER QUESTIONS WITH ANSWERS12videos
PROPERTIES OF MATTER
- BOOK - ICSECHAPTER - OSCILLATIONS EXERCISE - SELECTED PROBLEMS (OSCILLATION IN A TUNNEL BORED THROUGH THE EARTH)2videos
OSCILLATIONS
- BOOK - ICSECHAPTER - SAMPLE QUESTION PAPER - 01 EXERCISE - SECTION - D12videos
SAMPLE QUESTION PAPER - 01
Similar Questions
Figure shows the relationship between tensile stress and strain for a typical material. Below proportional point A, stress is directly proportional to strain which means Young's moudulus (Y) is a constant. In this region the material obeys Hooke's law.
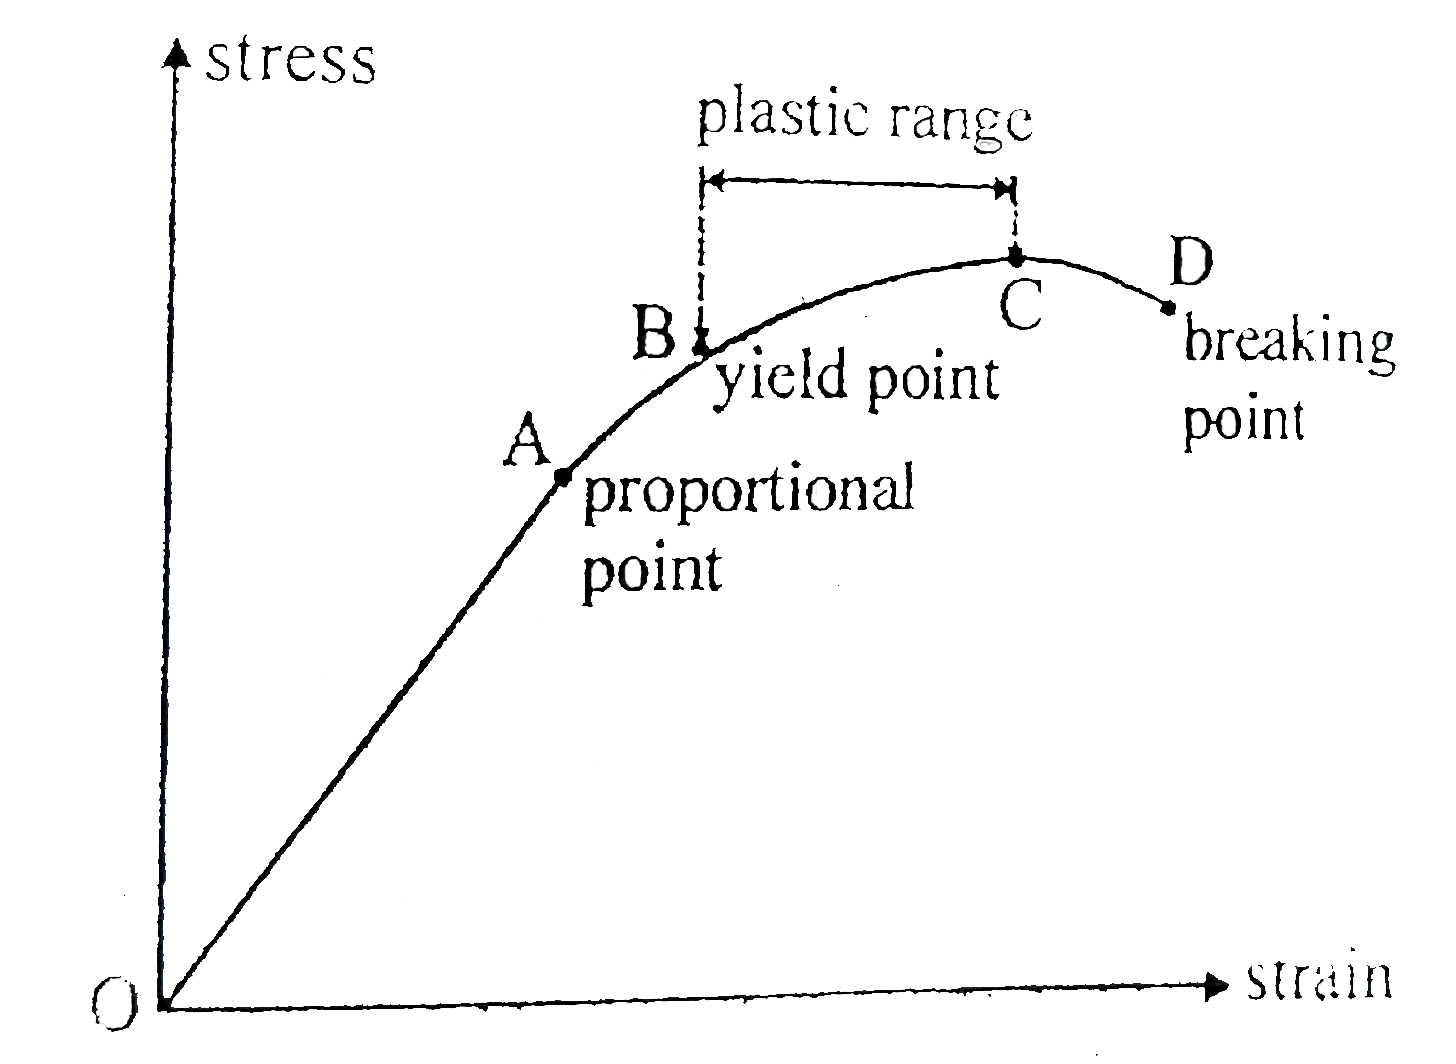
Provided the strain is below the yield point 'B' the material returns to its original shape and size when the force is removed. Beyond the yield point, the material retains a permancnt deformation after the stress is removed. For stresses beyond the yeld point, the material exhibit plastic flow, which means that it continues to elongate for little increases in the stress. Beyond C a local constriction occurs. The material fractures at D (i.e. breaking point). The graph below shows the stress-strain curve for 4 different materials.
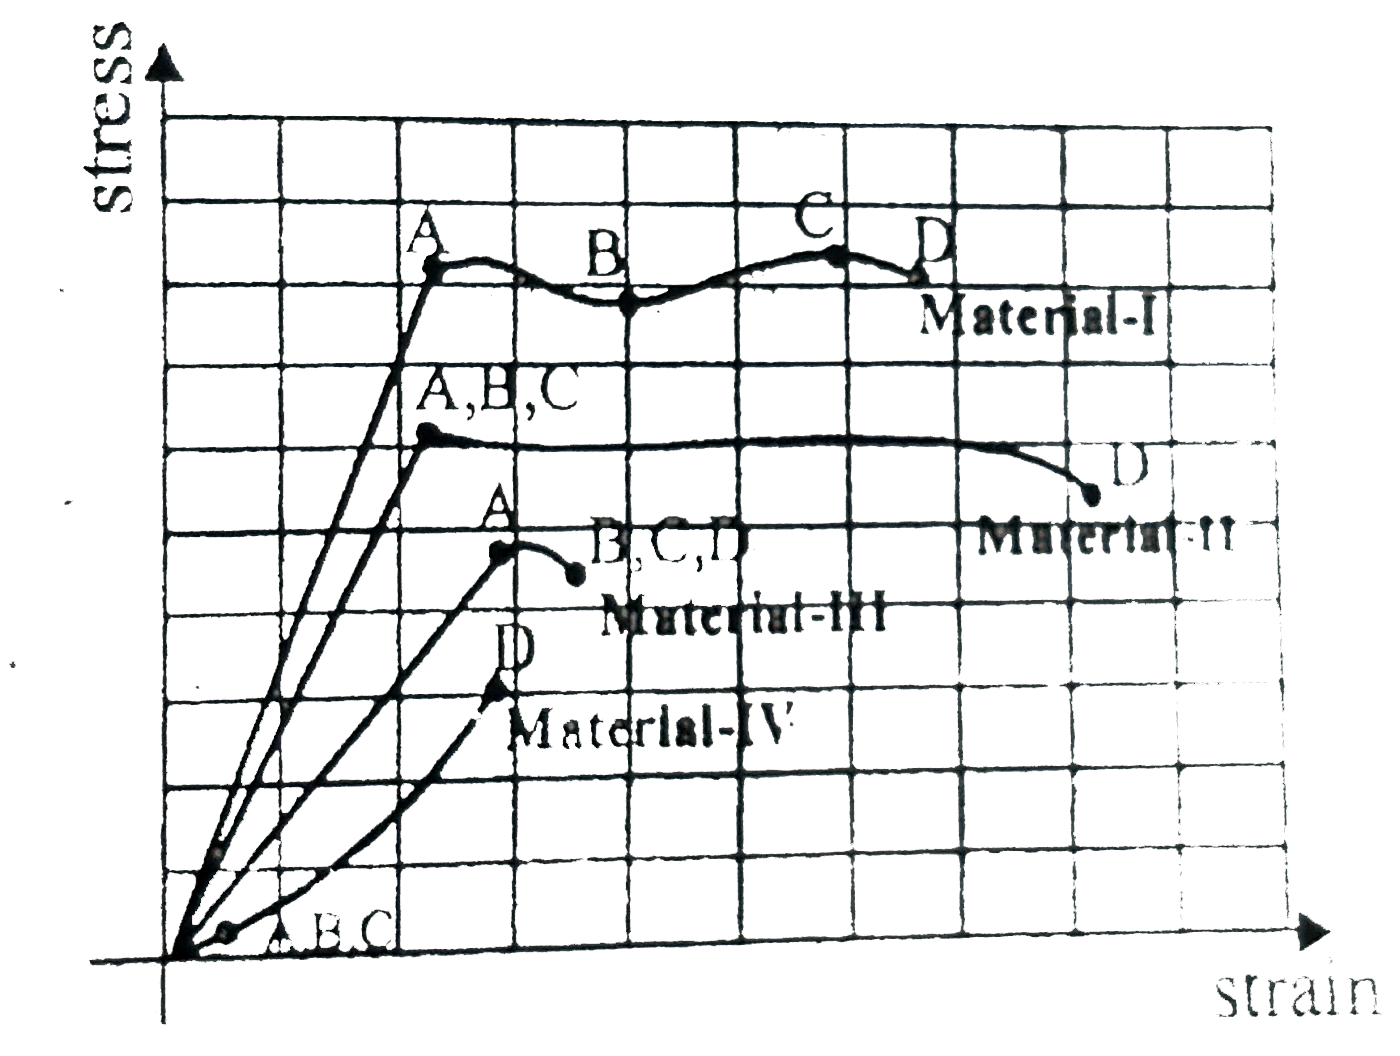
Material which is good for making wires by stretching isView SolutionThe stress strain graph for a metal wire is shown in the fig. Up to the point E, the wire returns to its original state O along the curve EPO, when it is gradually unloaded. Point B corresponds to the fracture of the wire.
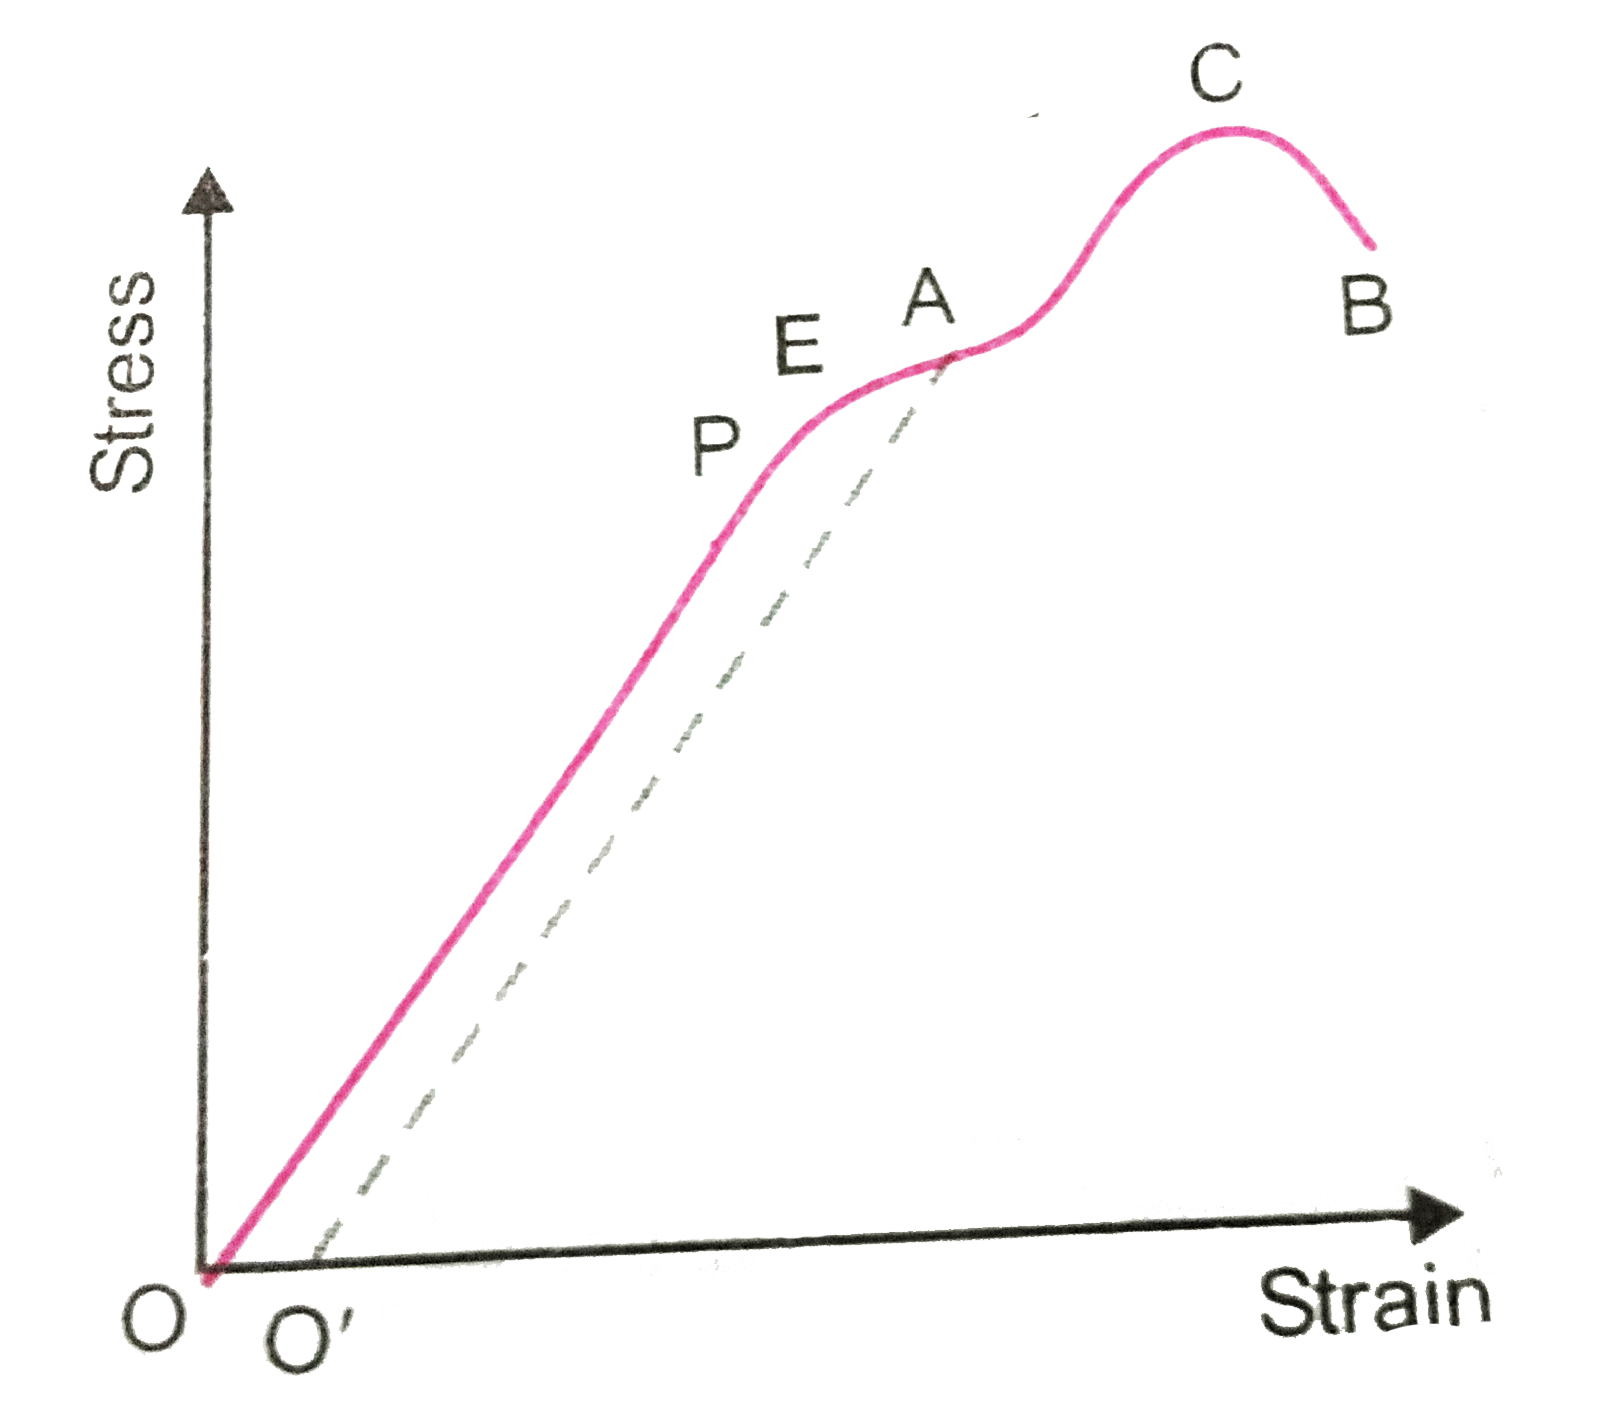
(a) Up to what point on the curve is Hooke's law obeyed? (this point some times called proportional limits).
(b) Which point on the curve corresponding to elastic limit or yield point of the wire?
(c ) Indicate the elastic and plastic regions of the stress-strain graph.
(d) Describe what happens when the wire is loaded up to a stress corresponding to the point A on the graph and then unloaded gradually. In particular explain the dotted curve.
(e) What is peculiar about the portion of the stress- strain graph from C to B? Up to what stress can the wire be subjected without causing fracture?View SolutionThe cable of a uniformly loaded suspension bridge hangs in the form of a parabola. The roadway which is horizontal and 100m long is supported by vertical wires attached to the cable, the longest wire being 30m and the shortest being 6m. Find the length of which is at 18m apart from the middle point of cable.
View SolutionFigure shows the relationship between tensile stress and strain for a typical material. Below proportional point A, stress is directly proportional to strain which means Young's moudulus (Y) is a constant. In this region the material obeys Hooke's law.
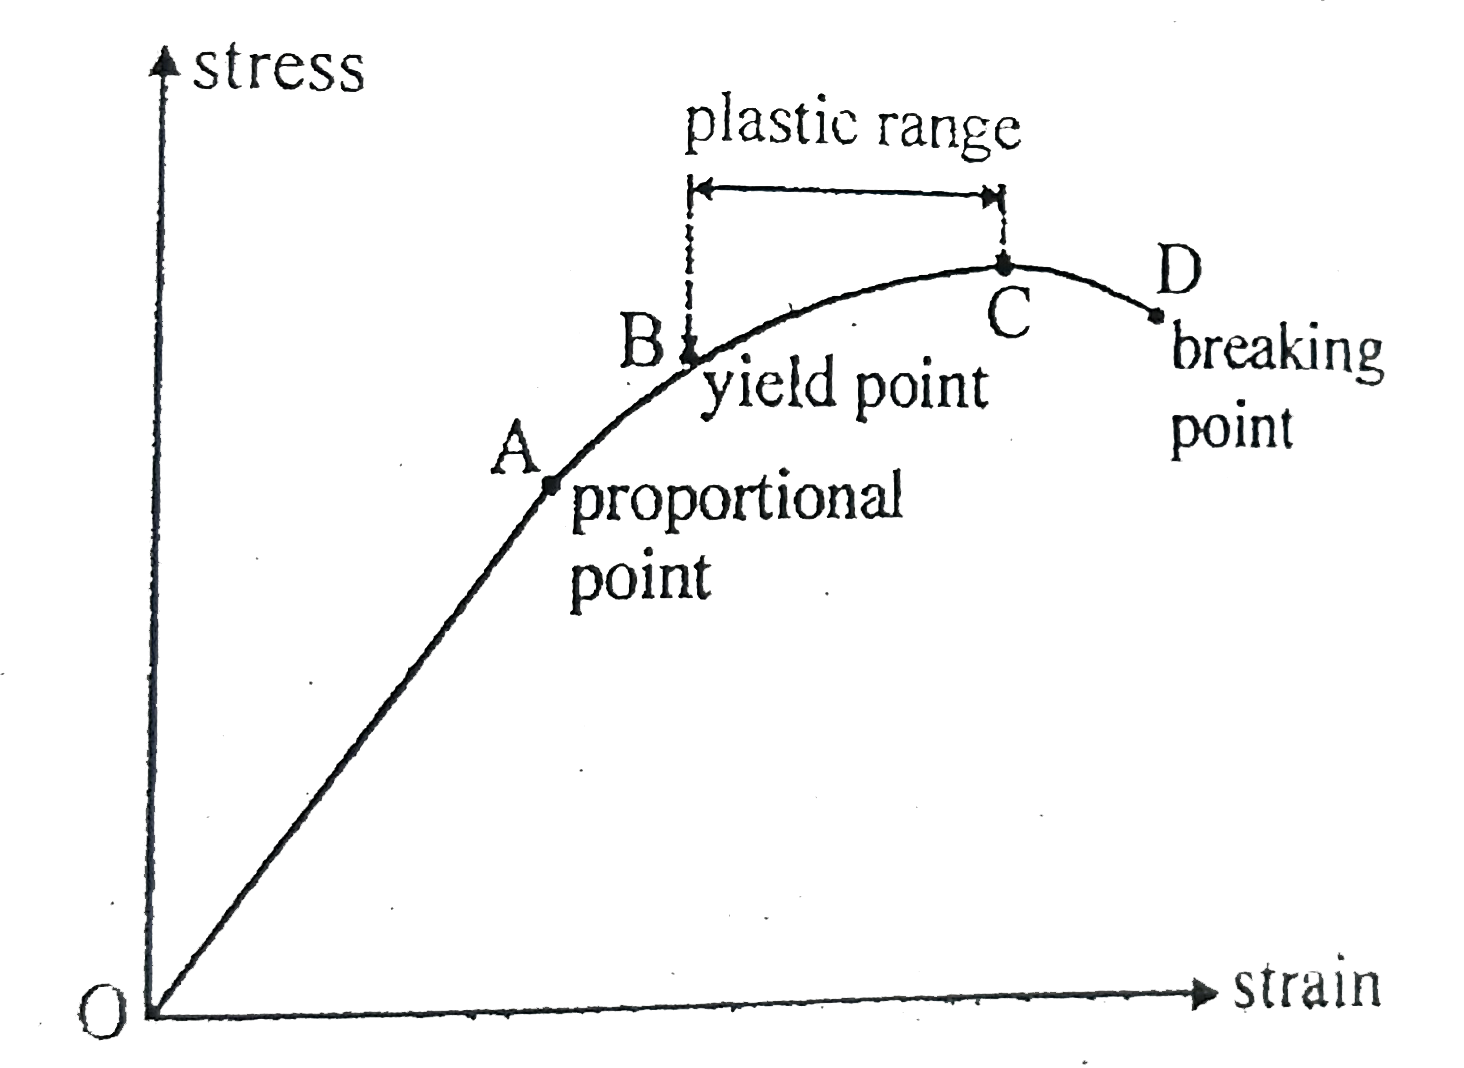
Provided the strain is below the yield point 'B' the material returns to its original shape and size when the force is removed. Beyond the yield point, the material retains a permancnt deformation after the stress is removed. For stresses beyond the yeld point, the material exhibit plastic flow, which means that it continues to elongate for little increases in the stress. Beyond C a local constriction occurs. The material fractures at D (i.e. breaking point). The graph below shows the stress-strain curve for 4 different materials.
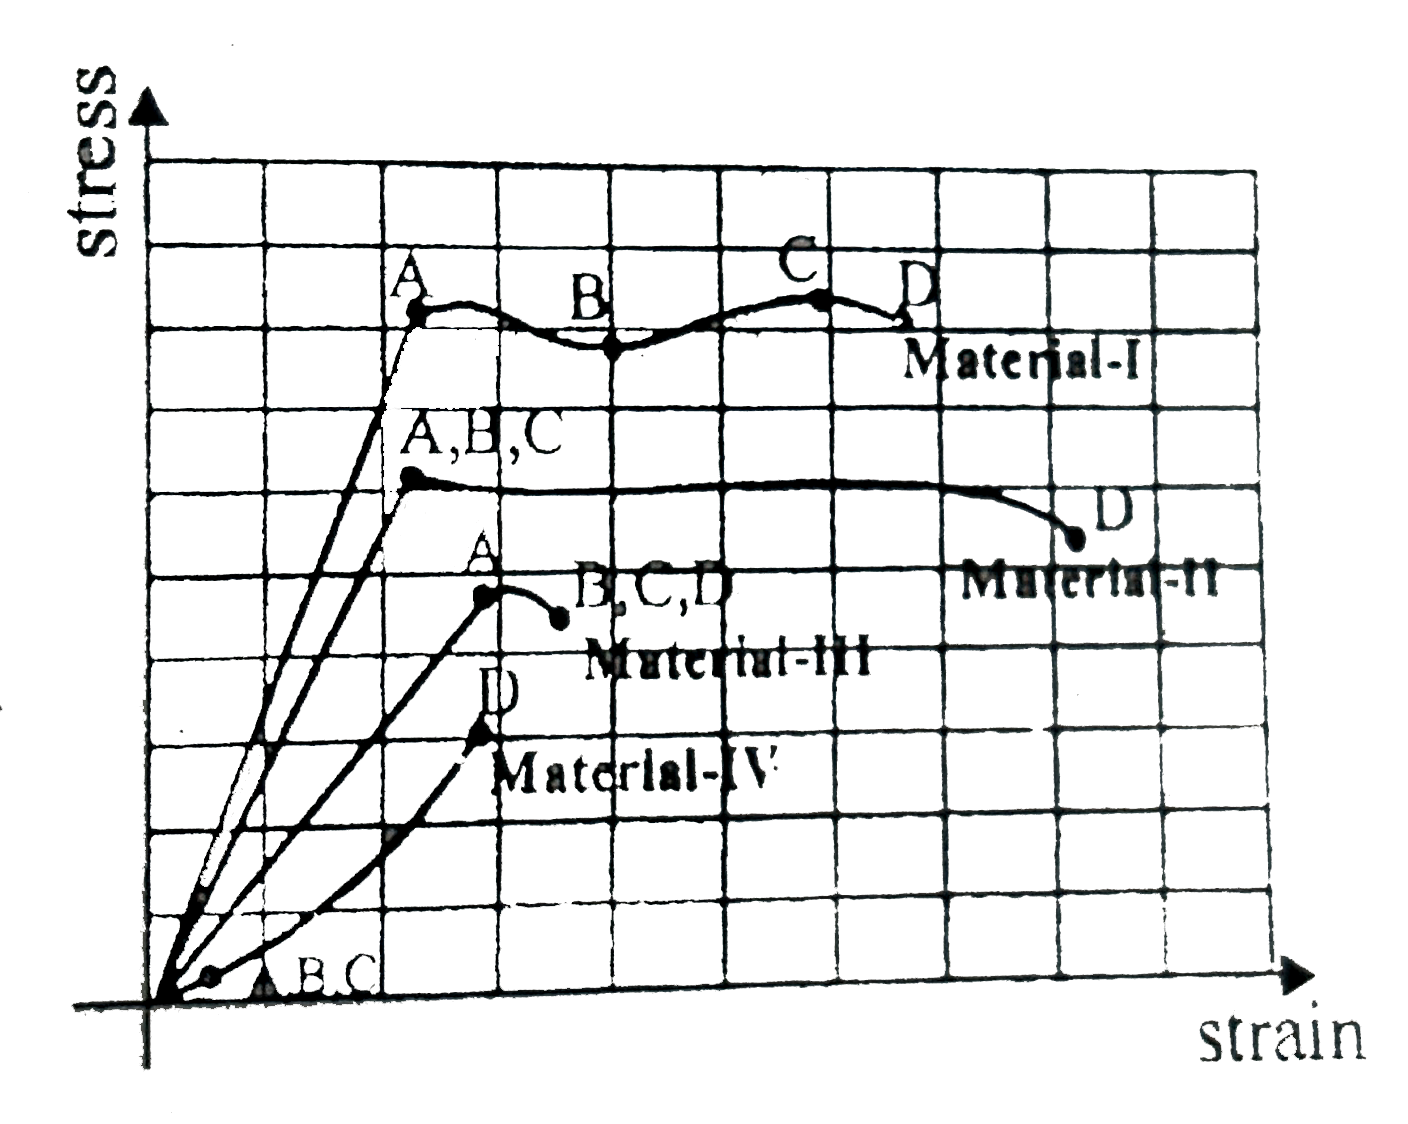
If you bough a new shoe which bites in the beginning and later on fits perfectly, then the material used to making the shoe isView SolutionFigure shows the relationship between tensile stress and strain for a typical material. Below proportional point A, stress is directly proportional to strain which means Young's moudulus (Y) is a constant. In this region the material obeys Hooke's law.

Provided the strain is below the yield point 'B' the material returns to its original shape and size when the force is removed. Beyond the yield point, the material retains a permancnt deformation after the stress is removed. For stresses beyond the yeld point, the material exhibit plastic flow, which means that it continues to elongate for little increases in the stress. Beyond C a local constriction occurs. The material fractures at D (i.e. breaking point). The graph below shows the stress-strain curve for 4 different materials.

If you bough a new shoe which bites in the beginning and later on fits perfectly, then the material used to making the shoe isView SolutionFigure shows the relationship between tensile stress and strain for a typical material. Below proportional point A, stress is directly proportional to strain which means Young's moudulus (Y) is a constant. In this region the material obeys Hooke's law.

Provided the strain is below the yield point 'B' the material returns to its original shape and size when the force is removed. Beyond the yield point, the material retains a permancnt deformation after the stress is removed. For stresses beyond the yeld point, the material exhibit plastic flow, which means that it continues to elongate for little increases in the stress. Beyond C a local constriction occurs. The material fractures at D (i.e. breaking point). The graph below shows the stress-strain curve for 4 different materials.

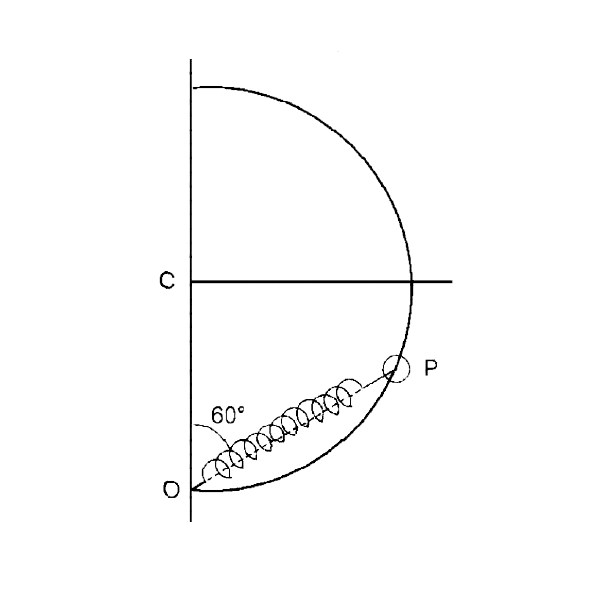
If you bough a new shoe which bites in the beginning and later on fits perfectly, then the material used to making the shoe isView SolutionA smooth semicircular wire-track of radius R is fixed in a vertical plane. One end of a massless spring of natural length 3R/4 is attached to the lowest point O of the wire-track. A small ring of mass m, which can slide on the track, is attached to the other end of the spring. The ring is held staionary at point P such that the spring makes an angle of 60∘ with the vertical. The spring constant K=mg/R. Consider the instant when the ring is released, and (i) draw the free body diagram of the ring, (ii) determine the tangential acceleration of the ring and the normal reaction.
 View Solution
A process in which work perfomed by an ideal gas is proportional to the corresponding increment of its internal energy is described as a polytropic process. If we represent work done by a ppolytropic process by W and increase in internal energy as ΔU then
W∝ΔU
or W=K1ΔU ...(i)
For this process, it can be demonstrated that the relation between pressure and volume is given by the equation
PVη=K2 (constant ) .....(ii)
We know that a gas can have various values for molar specific heats. The molar specific heat 'C' for an ideal gas in polytropic process can be calculated with the help of first law of thermodynamics. In polytropic process process the variation of molar specific heat 'C' with η for a monatomic gas is plotted as in the graph shown.
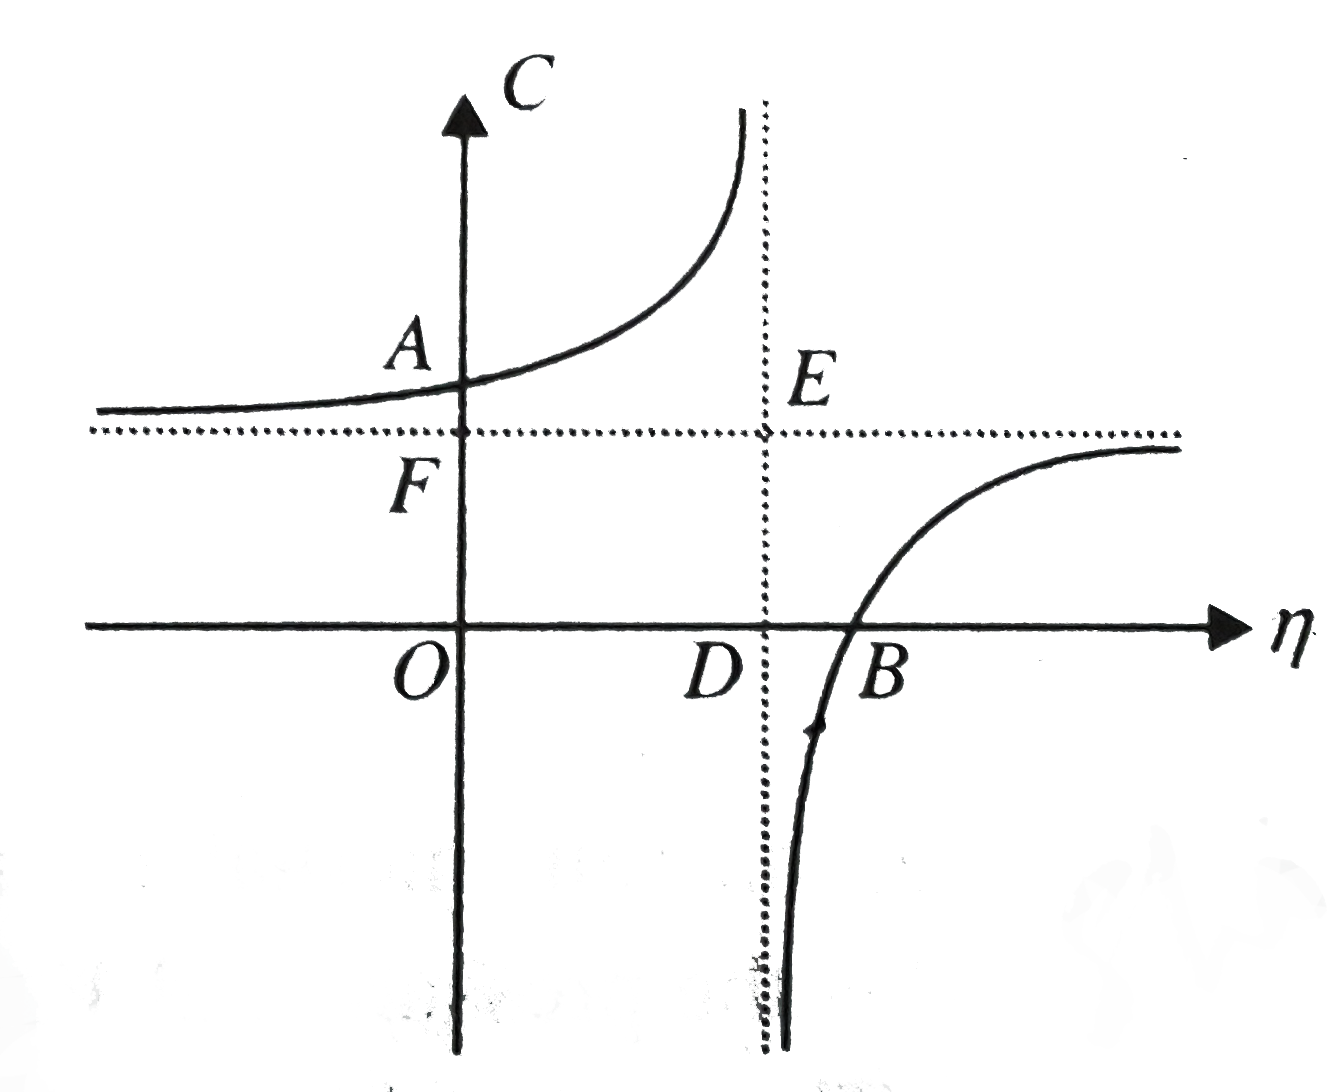
In the graph shown, the y− coordinate of point A is ( for monatomic gas )View Solution(i) State Hook's law.
(ii) Draw a labelled graph of tensile stress against tensile strain for a metal wire upto the breaking point. Shhow on your graph the region in which Hooke's law is obeyed.
What is the significance of the area between the graph and the strain axis withing the Hooke's law region?View SolutionEach phase of a material can exits only in certain regions of pressure and temperature . P−T phase diagrams, in which pressure is plotted versus temperature, show the regions corresponding to various phases and phase transformations . P−V diagrams, on the other hand , can be used to study pressure volume relationship at a constant temperature.
If the liquid and gaseous phases of a pure substances are heated together in a closed container, both the temperature and the vapor pressure will increase until a point is reached at which the two phases can no longer be distinguished from one another. The temperature and pressure at which this occurs are called the critical temperature and pressure. Exceeding either of these parameters, by itself ,will cause the gas/liguid phase transition to disappear. if the other variable is then changed as well, while the first variable is maintained above its critical point , a gradual transition will occur between the gaseous and liquid phases, with no clear boundary.(The liquid and solid phases, on the other hand , maintain a distinct boundary at all pressure above the triple point). Shown in figure is a combined P−T phase diagram for material A and B.
_E01_196_Q01.png)
Which is true about the substance in figure?View Solution

