(i) State Hook's law.
(ii) Draw a labelled graph of tensile stress against tensile strain for a metal wire upto the breaking point. Shhow on your graph the region in which Hooke's law is obeyed.
What is the significance of the area between the graph and the strain axis withing the Hooke's law region?
Step-by-Step Solution
1. Draw the Axes:
- Draw a vertical axis (Y-axis) for tensile stress (σ).
- Draw a horizontal axis (X-axis) for tensile strain (ϵ).
2. Label the Axes:
- Label the Y-axis as "Tensile Stress (σ)".
- Label the X-axis as "Tensile Strain (ϵ)".
3. Plot the Graph:
- Start from the origin (0,0).
- Draw a straight line from the origin to a point labeled as the "Proportional Limit". This line represents the region where Hooke's Law is obeyed (i.e., stress is directly proportional to strain).
- After the proportional limit, the graph will curve upwards until it reaches the "Ultimate Stress" point, where the material can no longer withstand the stress.
- Finally, draw a vertical drop to the "Breaking Point" where the material fails.
4. Label Key Points:
- Mark the "Proportional Limit" where Hooke's law is valid.
- Mark the "Ultimate Stress" point, which is the maximum stress the material can withstand.
- Mark the "Breaking Point", where the material breaks.
5. Shade the Region of Hooke's Law:
- Shade the area under the straight line to indicate the region where Hooke's Law is obeyed.
Significance of the Area Between the Graph and the Strain Axis Within Hooke's Law Region
The area between the graph and the strain axis within the Hooke's Law region represents the strain energy per unit volume. This is also known as Proof Resilience. It quantifies the energy stored in the material when it is deformed elastically. This energy can be recovered when the load is removed, as long as the material has not exceeded its elastic limit.
- Draw a vertical axis (Y-axis) for tensile stress (σ).
- Draw a horizontal axis (X-axis) for tensile strain (ϵ).
- Label the Y-axis as "Tensile Stress (σ)".
- Label the X-axis as "Tensile Strain (ϵ)".
- Start from the origin (0,0).
- Draw a straight line from the origin to a point labeled as the "Proportional Limit". This line represents the region where Hooke's Law is obeyed (i.e., stress is directly proportional to strain).
- After the proportional limit, the graph will curve upwards until it reaches the "Ultimate Stress" point, where the material can no longer withstand the stress.
- Finally, draw a vertical drop to the "Breaking Point" where the material fails.
- Mark the "Proportional Limit" where Hooke's law is valid.
- Mark the "Ultimate Stress" point, which is the maximum stress the material can withstand.
- Mark the "Breaking Point", where the material breaks.
- Shade the area under the straight line to indicate the region where Hooke's Law is obeyed.
The area between the graph and the strain axis within the Hooke's Law region represents the strain energy per unit volume. This is also known as Proof Resilience. It quantifies the energy stored in the material when it is deformed elastically. This energy can be recovered when the load is removed, as long as the material has not exceeded its elastic limit.
Topper's Solved these Questions
- PROPERTIES OF MATTERBOOK - ICSECHAPTER - PROPERTIES OF MATTEREXERCISE - MODULE 1 (ELASTICITY)SHORT ANSWER QUESTIONS
20 Videos
- PROPERTIES OF MATTERBOOK - ICSECHAPTER - PROPERTIES OF MATTEREXERCISE - MODULE 1 (ELASTICITY)VERY SHORT ANSWER QUESTIONS
8 Videos
- PROPERTIES OF MATTERBOOK - ICSECHAPTER - PROPERTIES OF MATTEREXERCISE - MODULE 1 (ELASTICITY)CONCEPTUAL SHORT ANSWER QUESTIONS WITH ANSWERS
12 Videos
- OSCILLATIONS BOOK - ICSECHAPTER - OSCILLATIONS EXERCISE - SELECTED PROBLEMS (OSCILLATION IN A TUNNEL BORED THROUGH THE EARTH)
2 Videos
- SAMPLE QUESTION PAPER - 01 BOOK - ICSECHAPTER - SAMPLE QUESTION PAPER - 01 EXERCISE - SECTION - D
12 Videos
Similar Questions
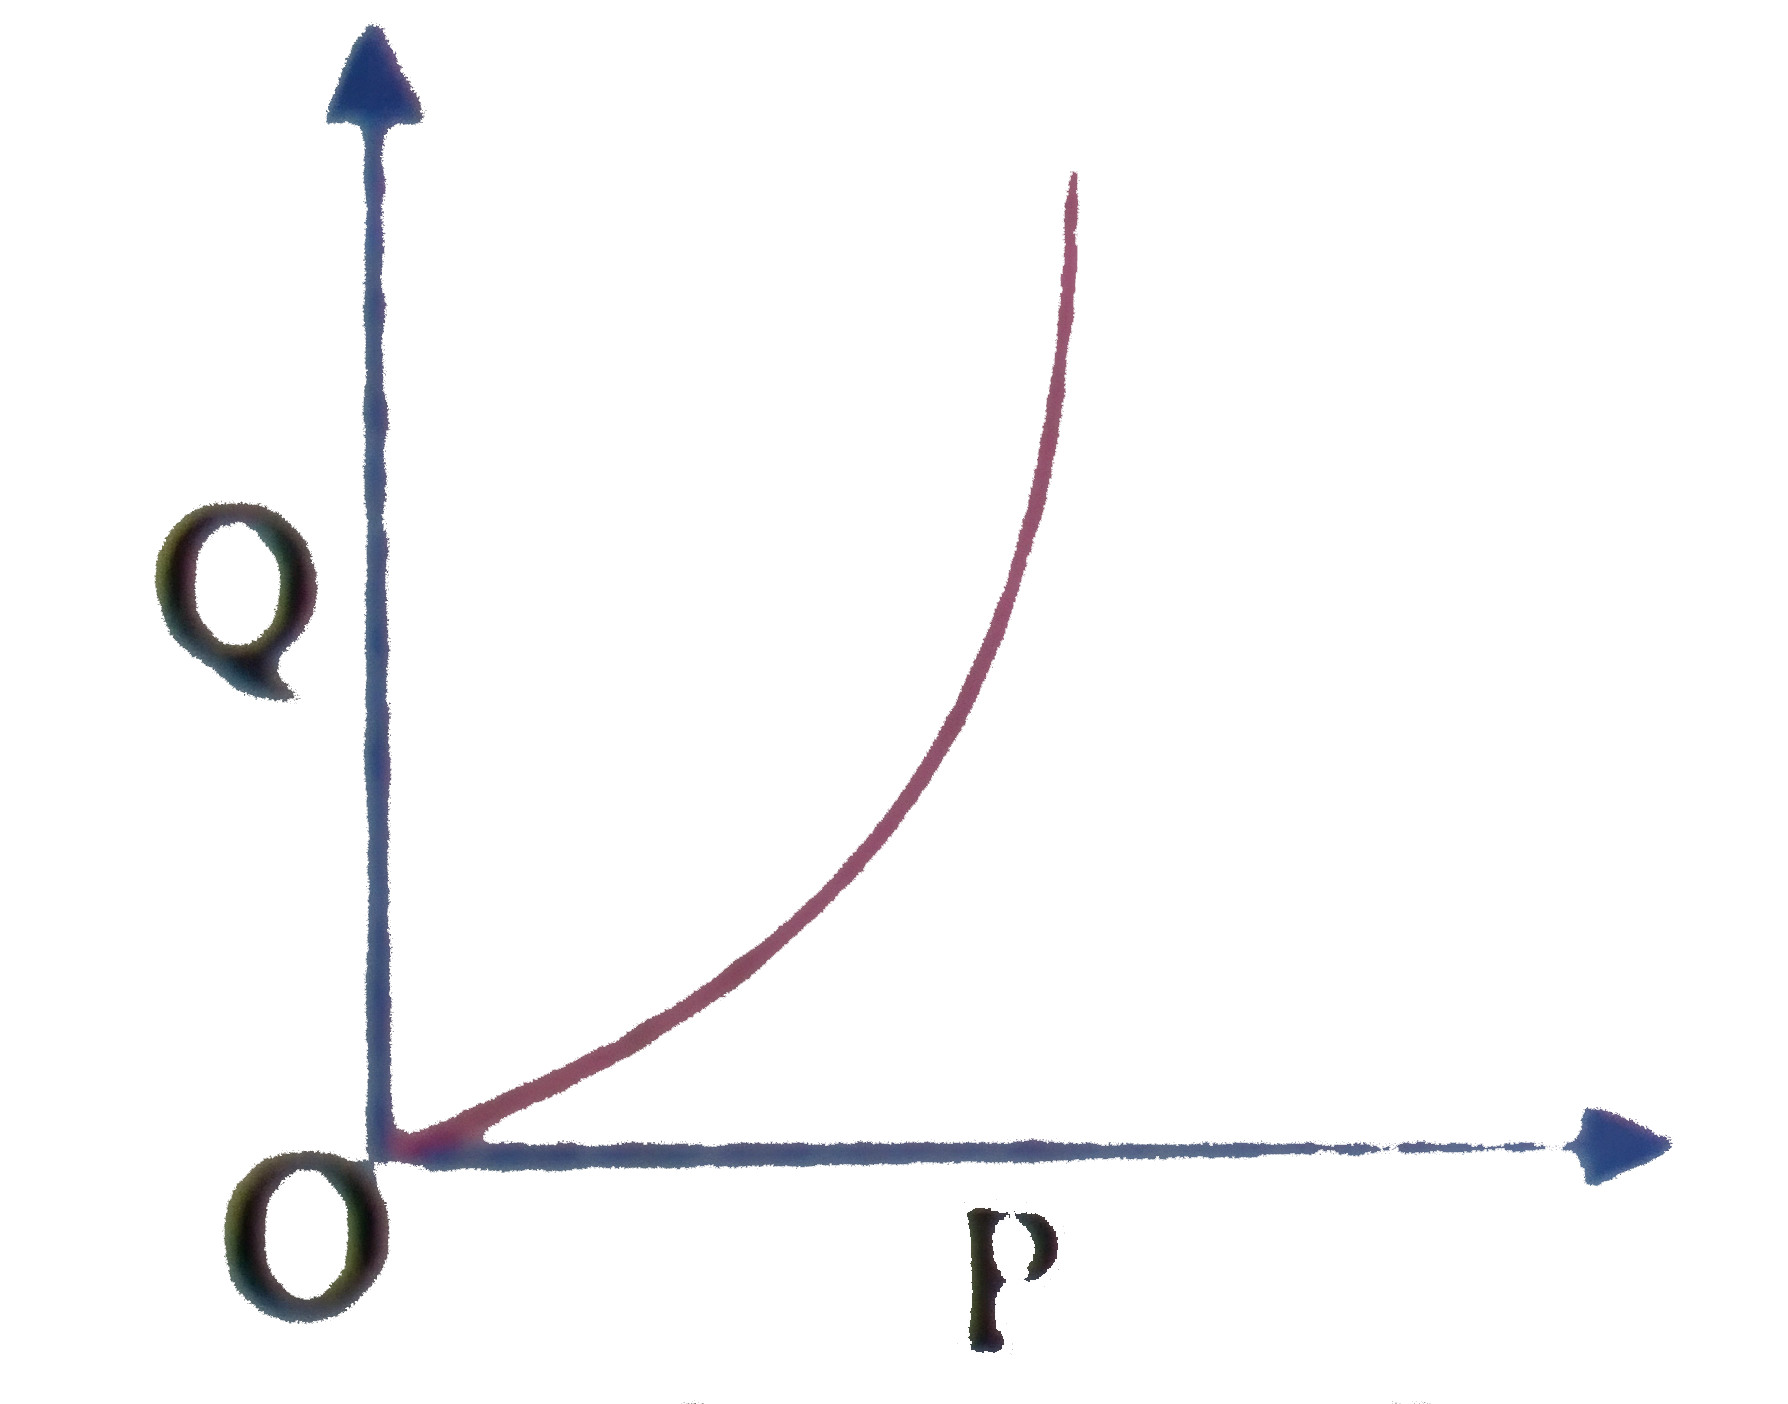
The graph show the behaviour of a length of wire in the region for which the substances obeys Hooke's law. P and Q represent
View SolutionFigure shows the relationship between tensile stress and strain for a typical material. Below proportional point A, stress is directly proportional to strain which means Young's moudulus (Y) is a constant. In this region the material obeys Hooke's law.
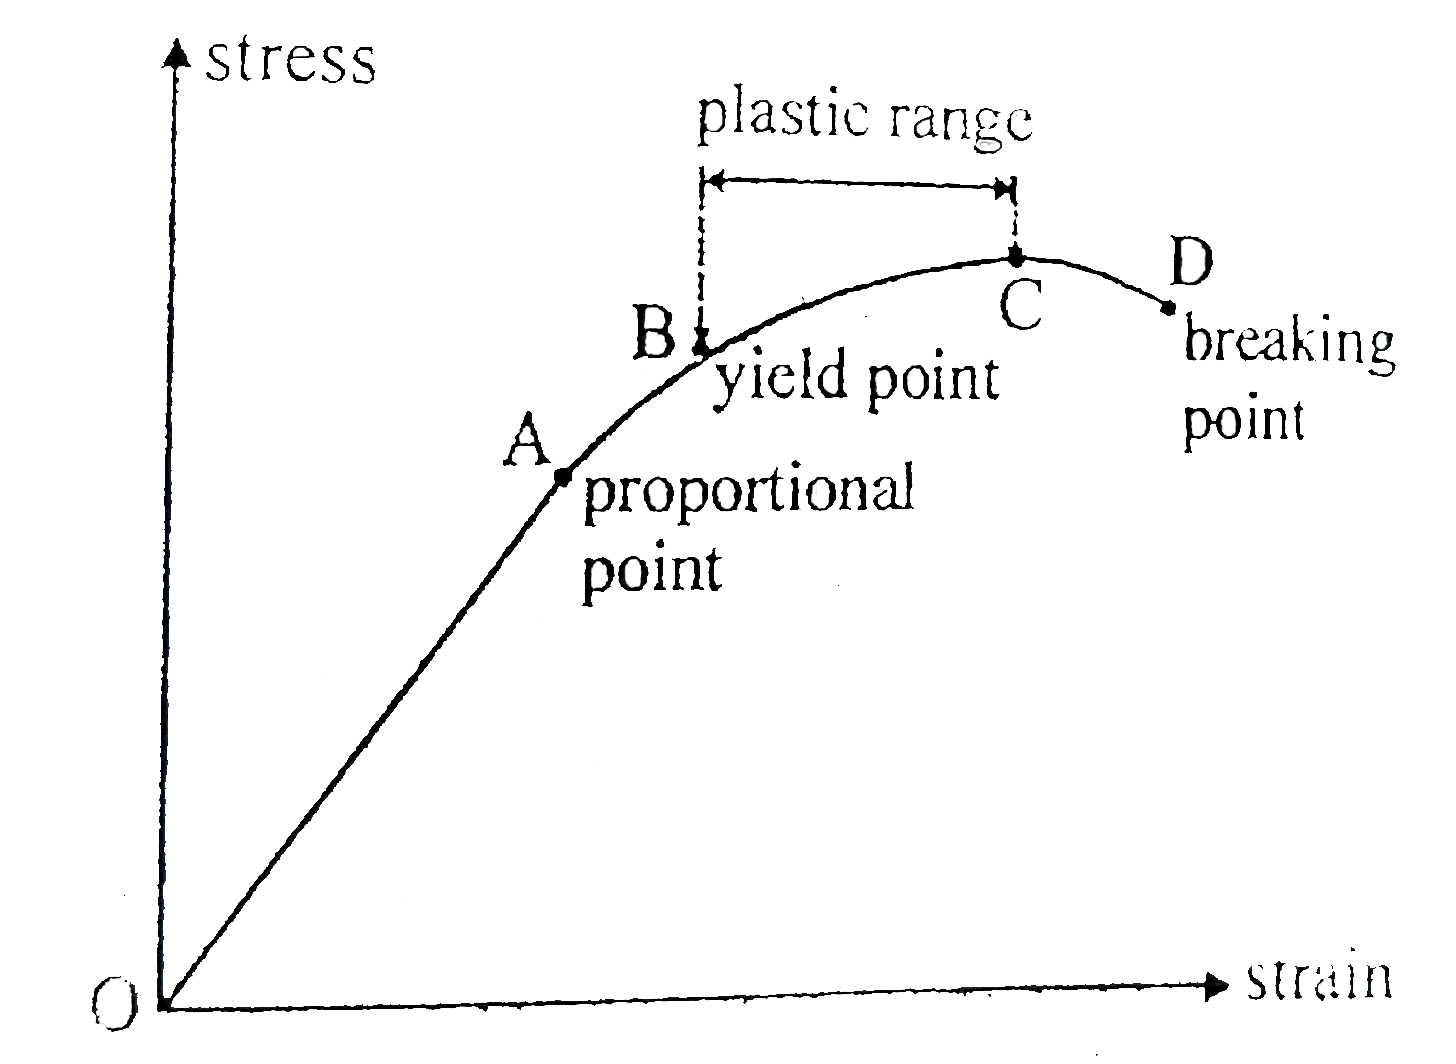
Provided the strain is below the yield point 'B' the material returns to its original shape and size when the force is removed. Beyond the yield point, the material retains a permancnt deformation after the stress is removed. For stresses beyond the yeld point, the material exhibit plastic flow, which means that it continues to elongate for little increases in the stress. Beyond C a local constriction occurs. The material fractures at D (i.e. breaking point). The graph below shows the stress-strain curve for 4 different materials.
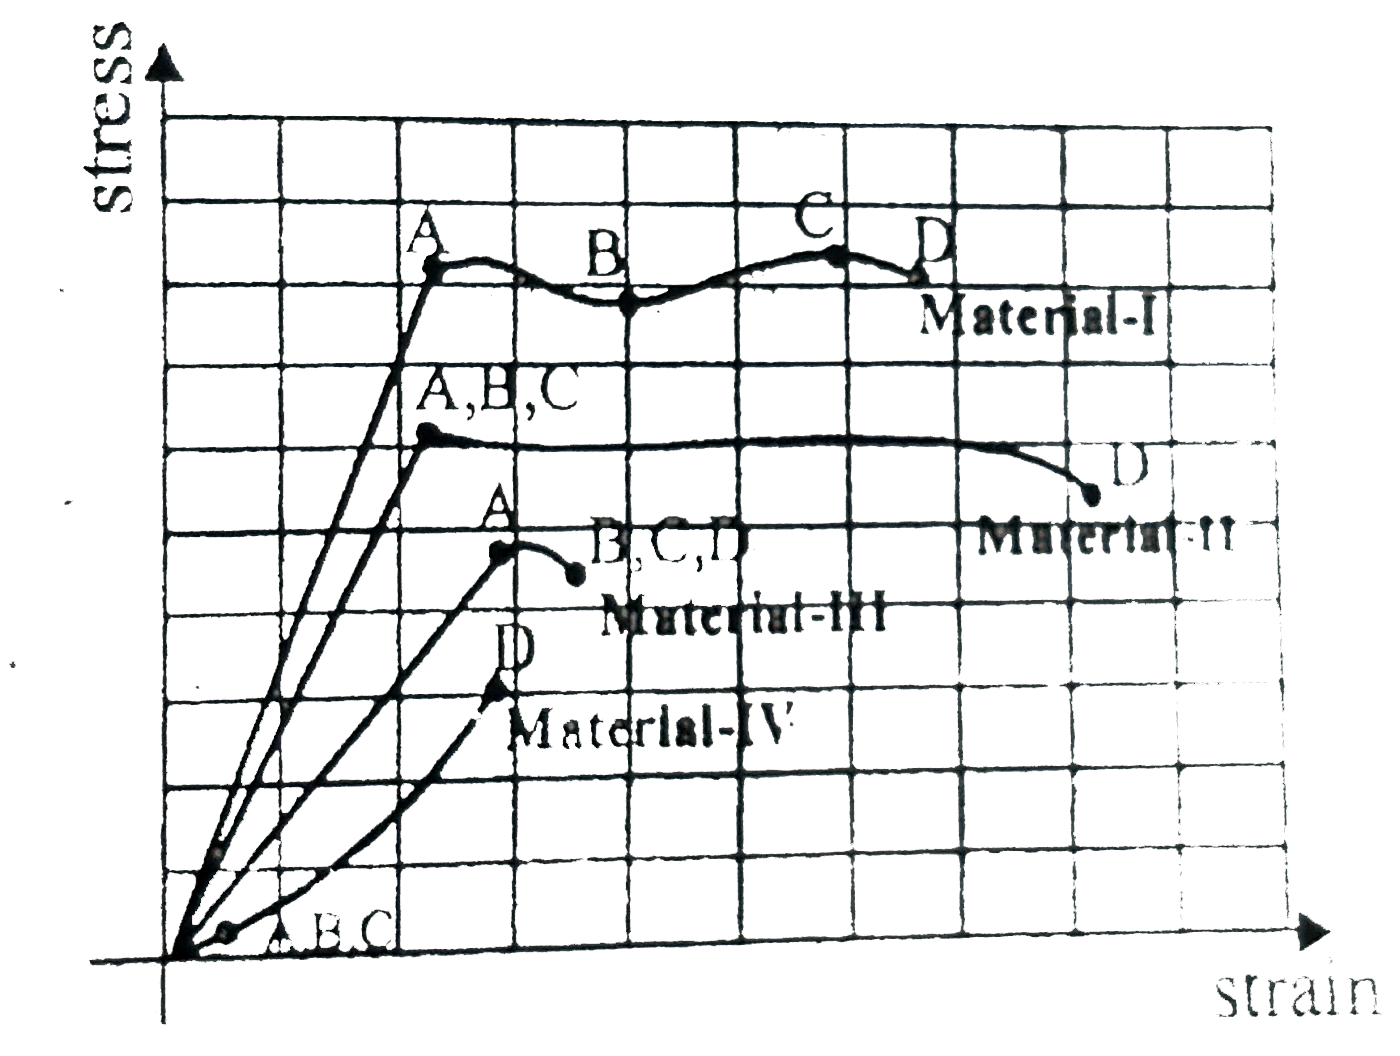
Material which is good for making wires by stretching is
View Solution
Knowledge Check
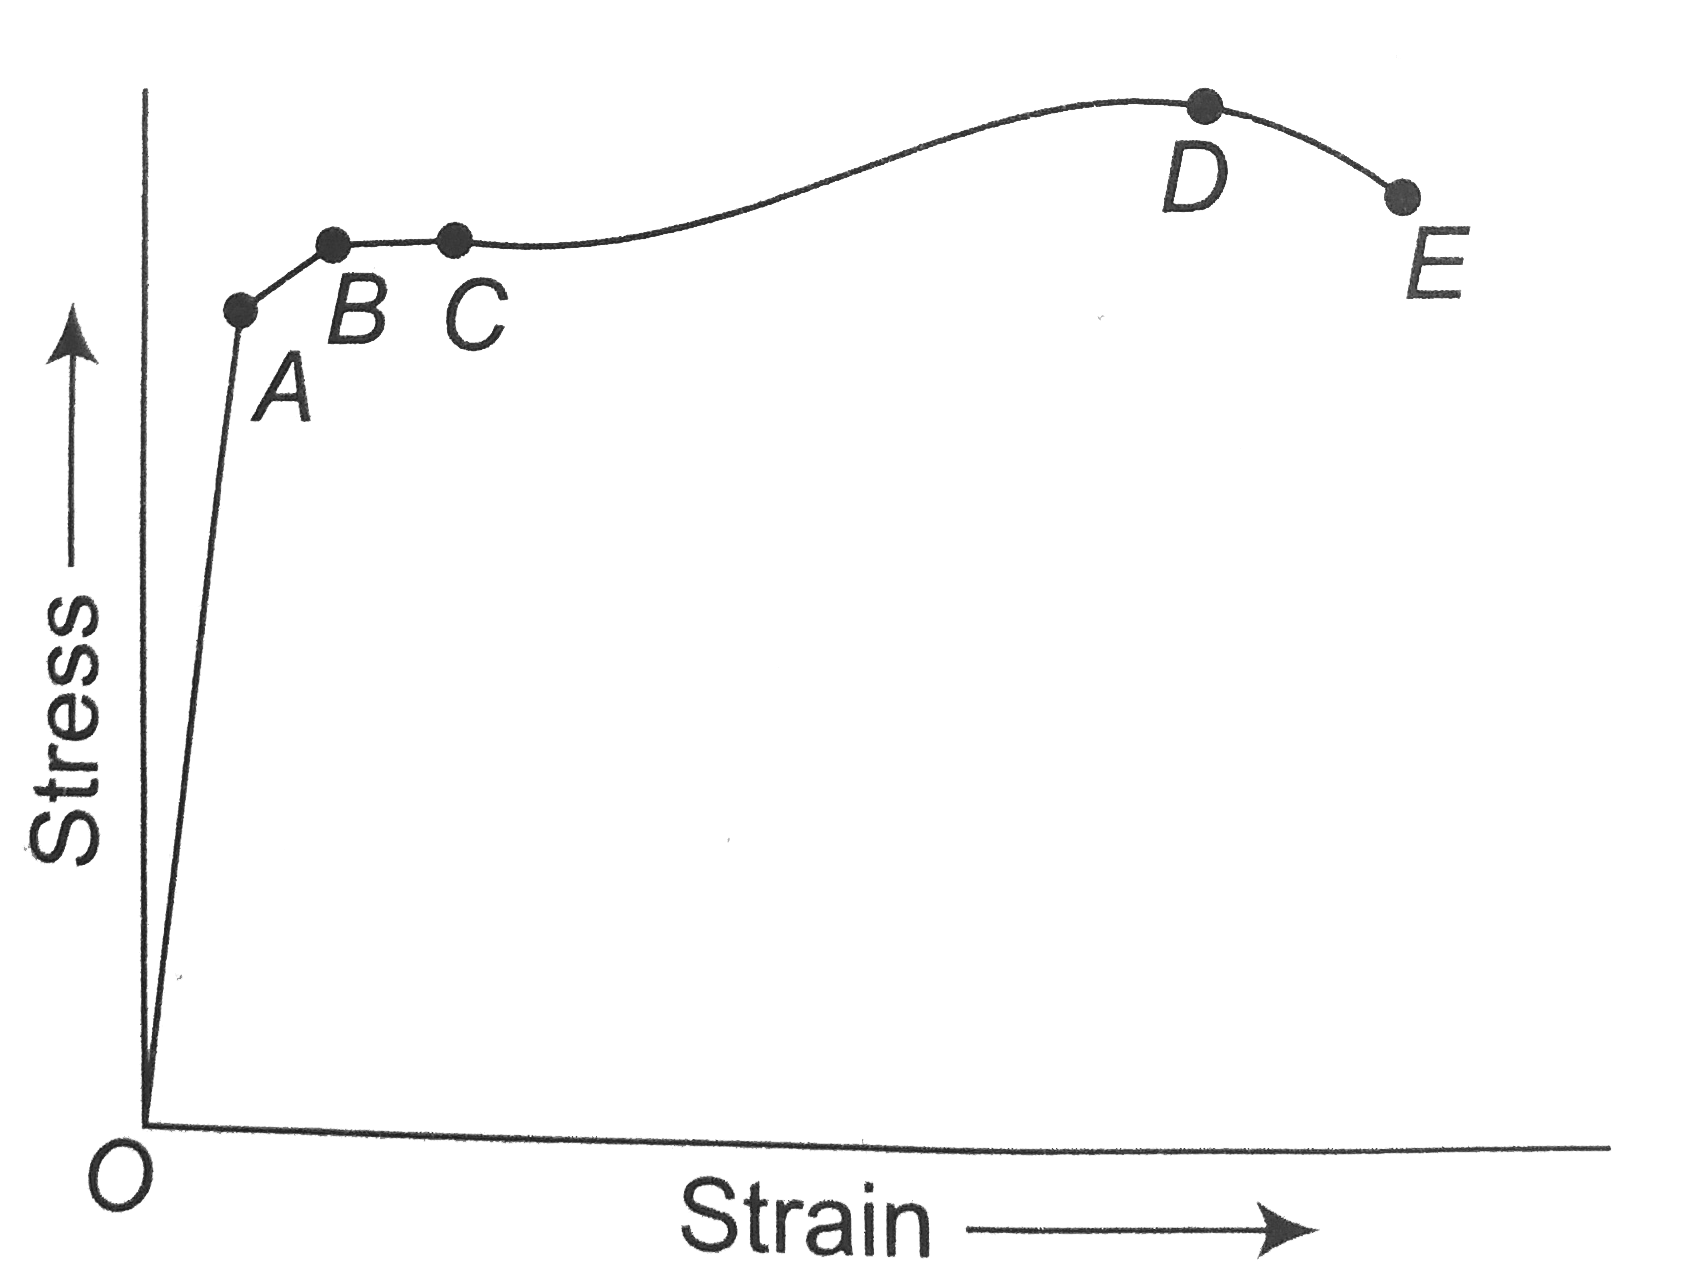
The stress strain graph for a metal wire is as shown in the figure. In the graph, the region in which Hooke's law is obeyed, the ultimate strength and fracture are represented byAOA, C, DBOB, D, ECÂ OA, D, EDOB, C, DAssertion : For small deformations, the stress and strain are proportional to each other.
Reason: A class of solids called elastomers does not obey Hooke's law.ABoth assertion and reason are true and reason is the correct explanation of assertion.BBoth assertion and reason are true but reason is not the correct explanation of assertion.CAssertion is true but reason is false.DBoth assertion and reason are false.
Figure shows the relationship between tensile stress and strain for a typical material. Below proportional point A, stress is directly proportional to strain which means Young's moudulus (Y) is a constant. In this region the material obeys Hooke's law.
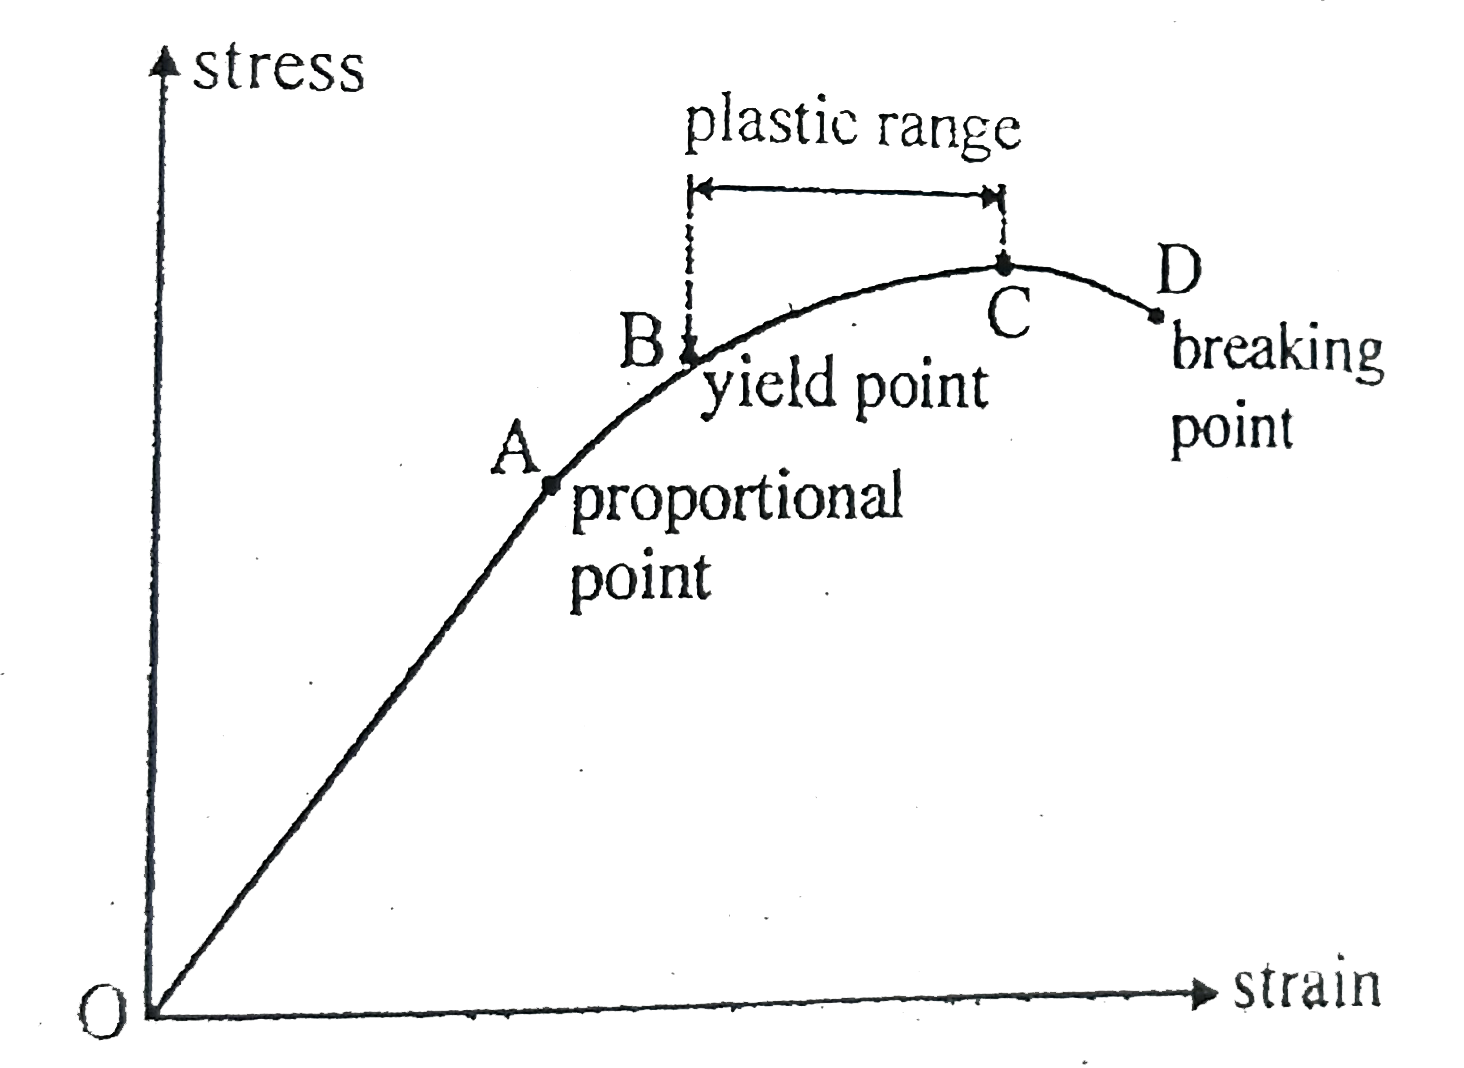
Provided the strain is below the yield point 'B' the material returns to its original shape and size when the force is removed. Beyond the yield point, the material retains a permancnt deformation after the stress is removed. For stresses beyond the yeld point, the material exhibit plastic flow, which means that it continues to elongate for little increases in the stress. Beyond C a local constriction occurs. The material fractures at D (i.e. breaking point). The graph below shows the stress-strain curve for 4 different materials.
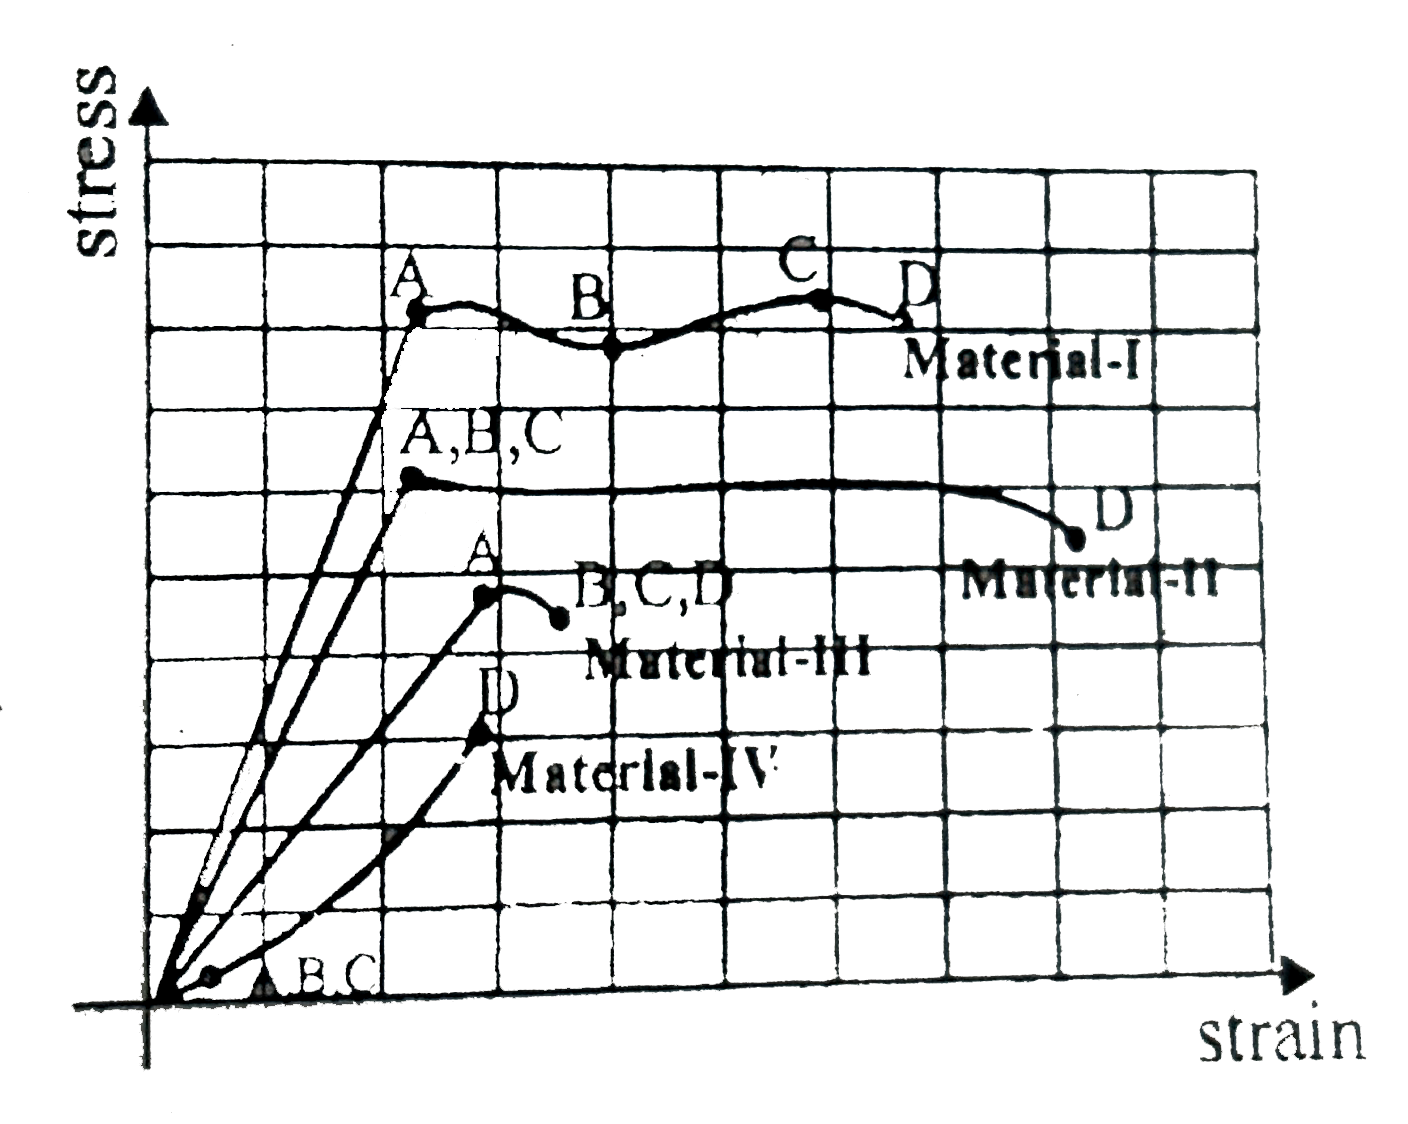
If you bough a new shoe which bites in the beginning and later on fits perfectly, then the material used to making the shoe is
View SolutionFigure shows the relationship between tensile stress and strain for a typical material. Below proportional point A, stress is directly proportional to strain which means Young's moudulus (Y) is a constant. In this region the material obeys Hooke's law.

Provided the strain is below the yield point 'B' the material returns to its original shape and size when the force is removed. Beyond the yield point, the material retains a permancnt deformation after the stress is removed. For stresses beyond the yeld point, the material exhibit plastic flow, which means that it continues to elongate for little increases in the stress. Beyond C a local constriction occurs. The material fractures at D (i.e. breaking point). The graph below shows the stress-strain curve for 4 different materials.

If you bough a new shoe which bites in the beginning and later on fits perfectly, then the material used to making the shoe is
View SolutionFigure shows the relationship between tensile stress and strain for a typical material. Below proportional point A, stress is directly proportional to strain which means Young's moudulus (Y) is a constant. In this region the material obeys Hooke's law.

Provided the strain is below the yield point 'B' the material returns to its original shape and size when the force is removed. Beyond the yield point, the material retains a permancnt deformation after the stress is removed. For stresses beyond the yeld point, the material exhibit plastic flow, which means that it continues to elongate for little increases in the stress. Beyond C a local constriction occurs. The material fractures at D (i.e. breaking point). The graph below shows the stress-strain curve for 4 different materials.

If you bough a new shoe which bites in the beginning and later on fits perfectly, then the material used to making the shoe is
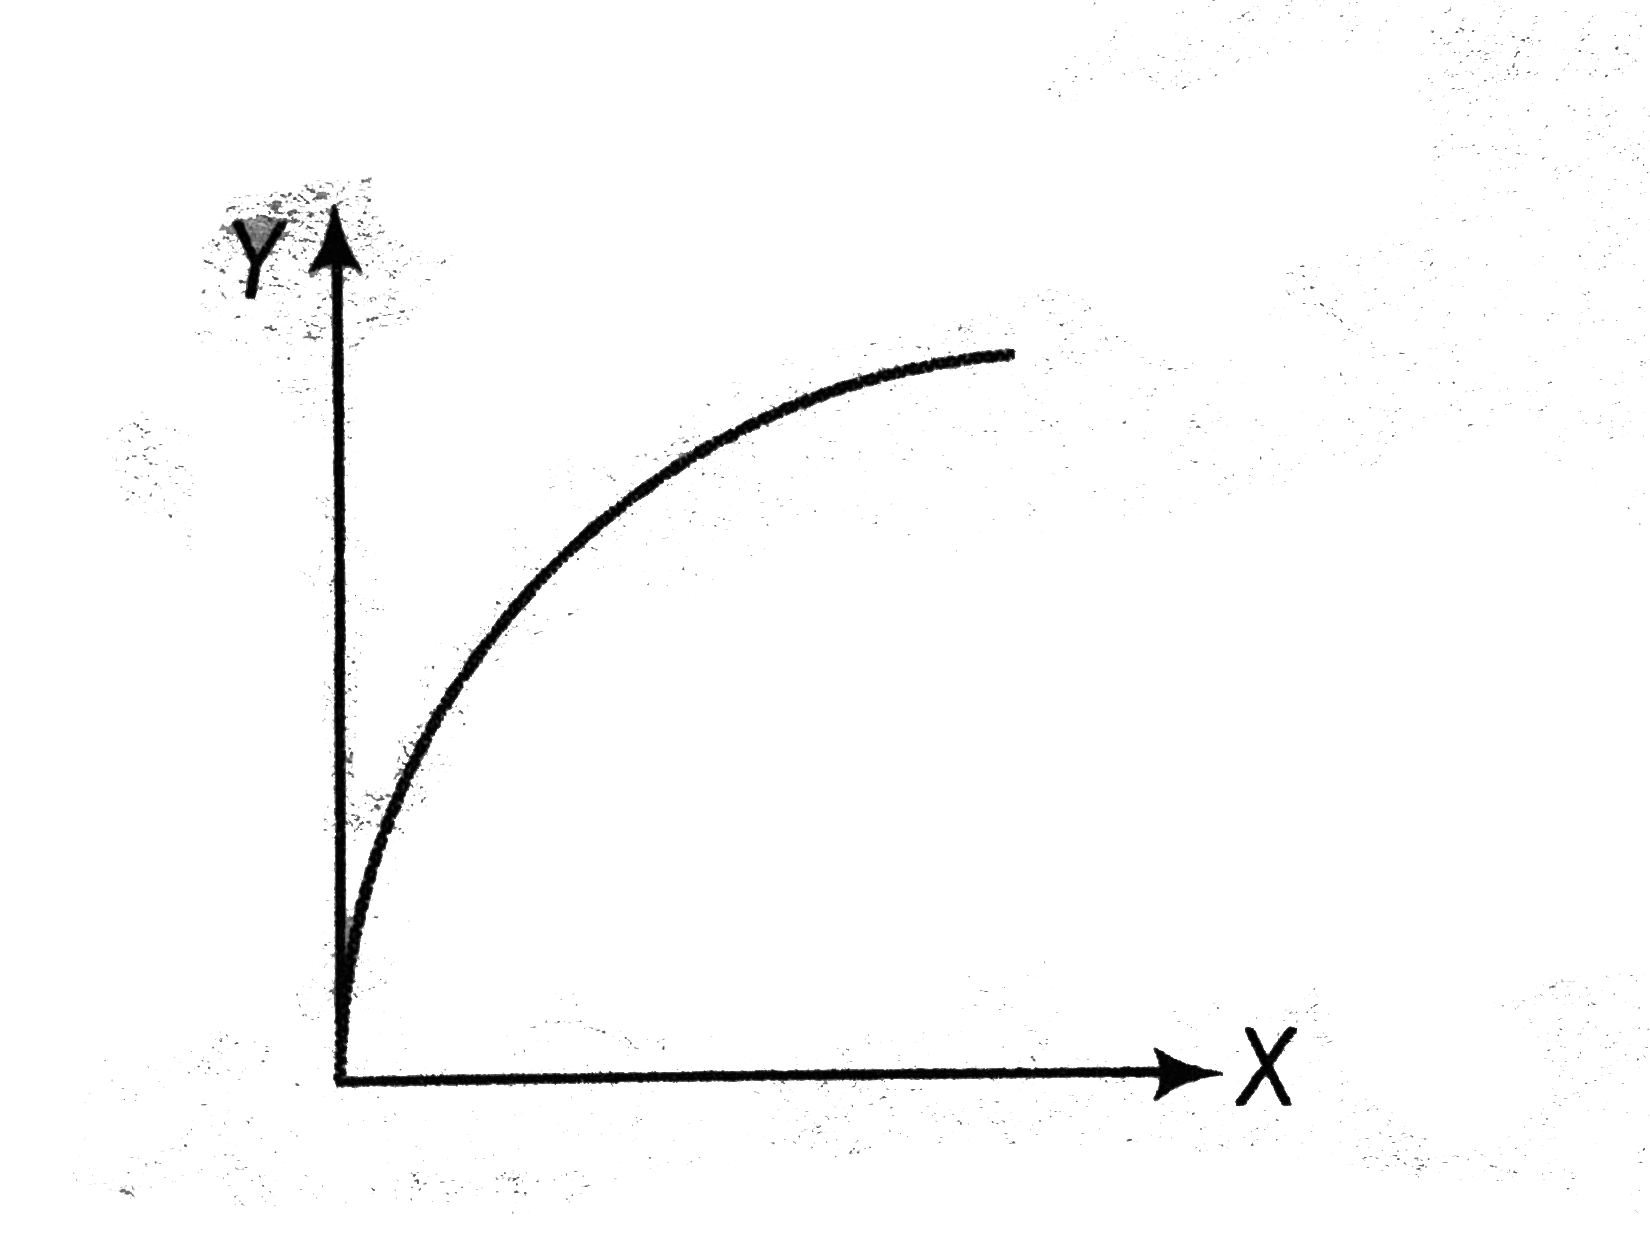
View SolutionThe graph shows the behaviour of a steel wire in the region for whoch the wire obeys Hooke's law. The graph is a parabola. The variables X and Y -axes, respectively can be [ stress (σ),strain (ε) and elastic potential energy(U) ]
View SolutionAssertion Upto elastic limit of a stress-strain curve, the steel wire tends to regain its original shape when stress is removed.
Reason Within elastic limit, the wire follows Hooke's law.
View SolutionThe stress strain graph for a metal wire is shown in the fig. Up to the point E, the wire returns to its original state O along the curve EPO, when it is gradually unloaded. Point B corresponds to the fracture of the wire.
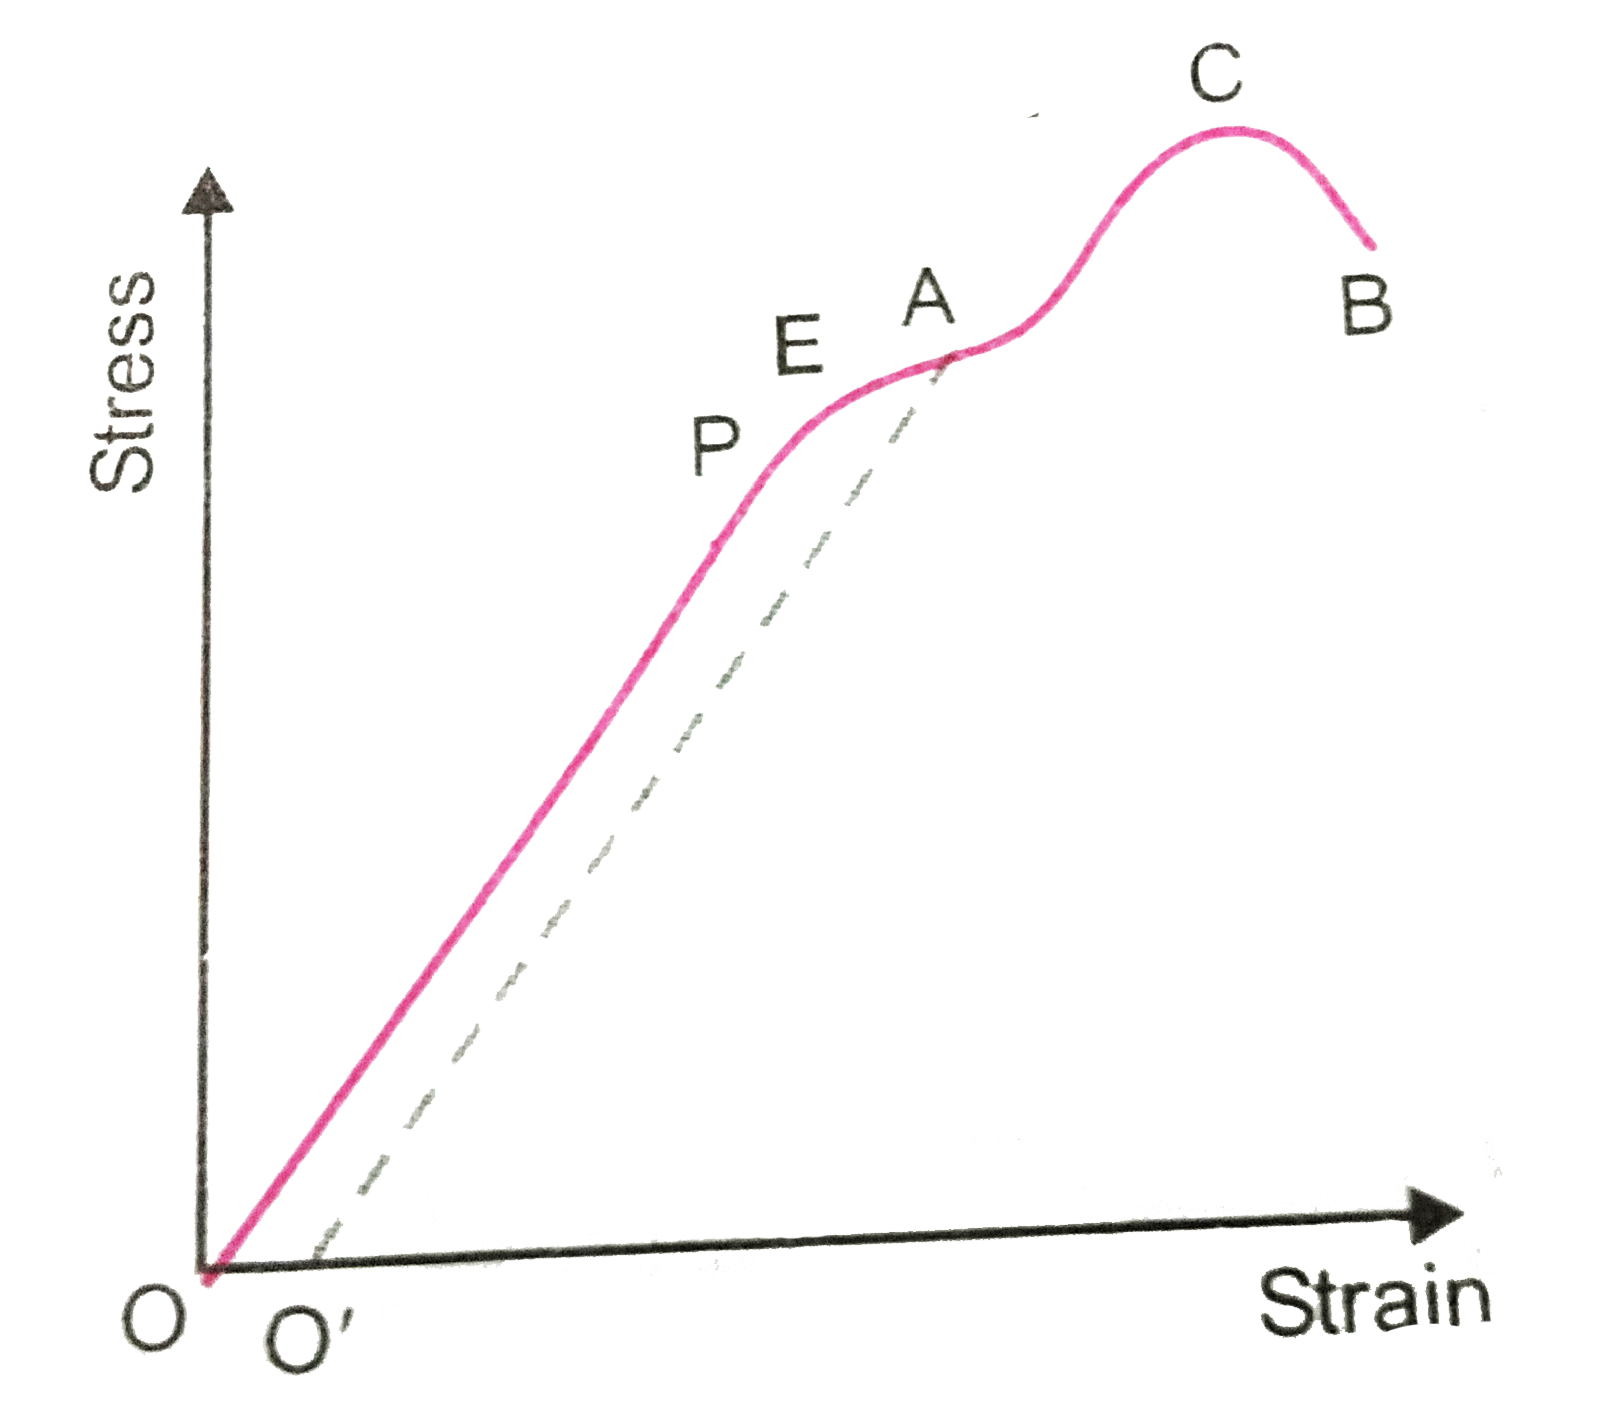
(a) Up to what point on the curve is Hooke's law obeyed? (this point some times called proportional limits).
(b) Which point on the curve corresponding to elastic limit or yield point of the wire?
(c ) Indicate the elastic and plastic regions of the stress-strain graph.
(d) Describe what happens when the wire is loaded up to a stress corresponding to the point A on the graph and then unloaded gradually. In particular explain the dotted curve.
(e) What is peculiar about the portion of the stress- strain graph from C to B? Up to what stress can the wire be subjected without causing fracture?
View Solution
