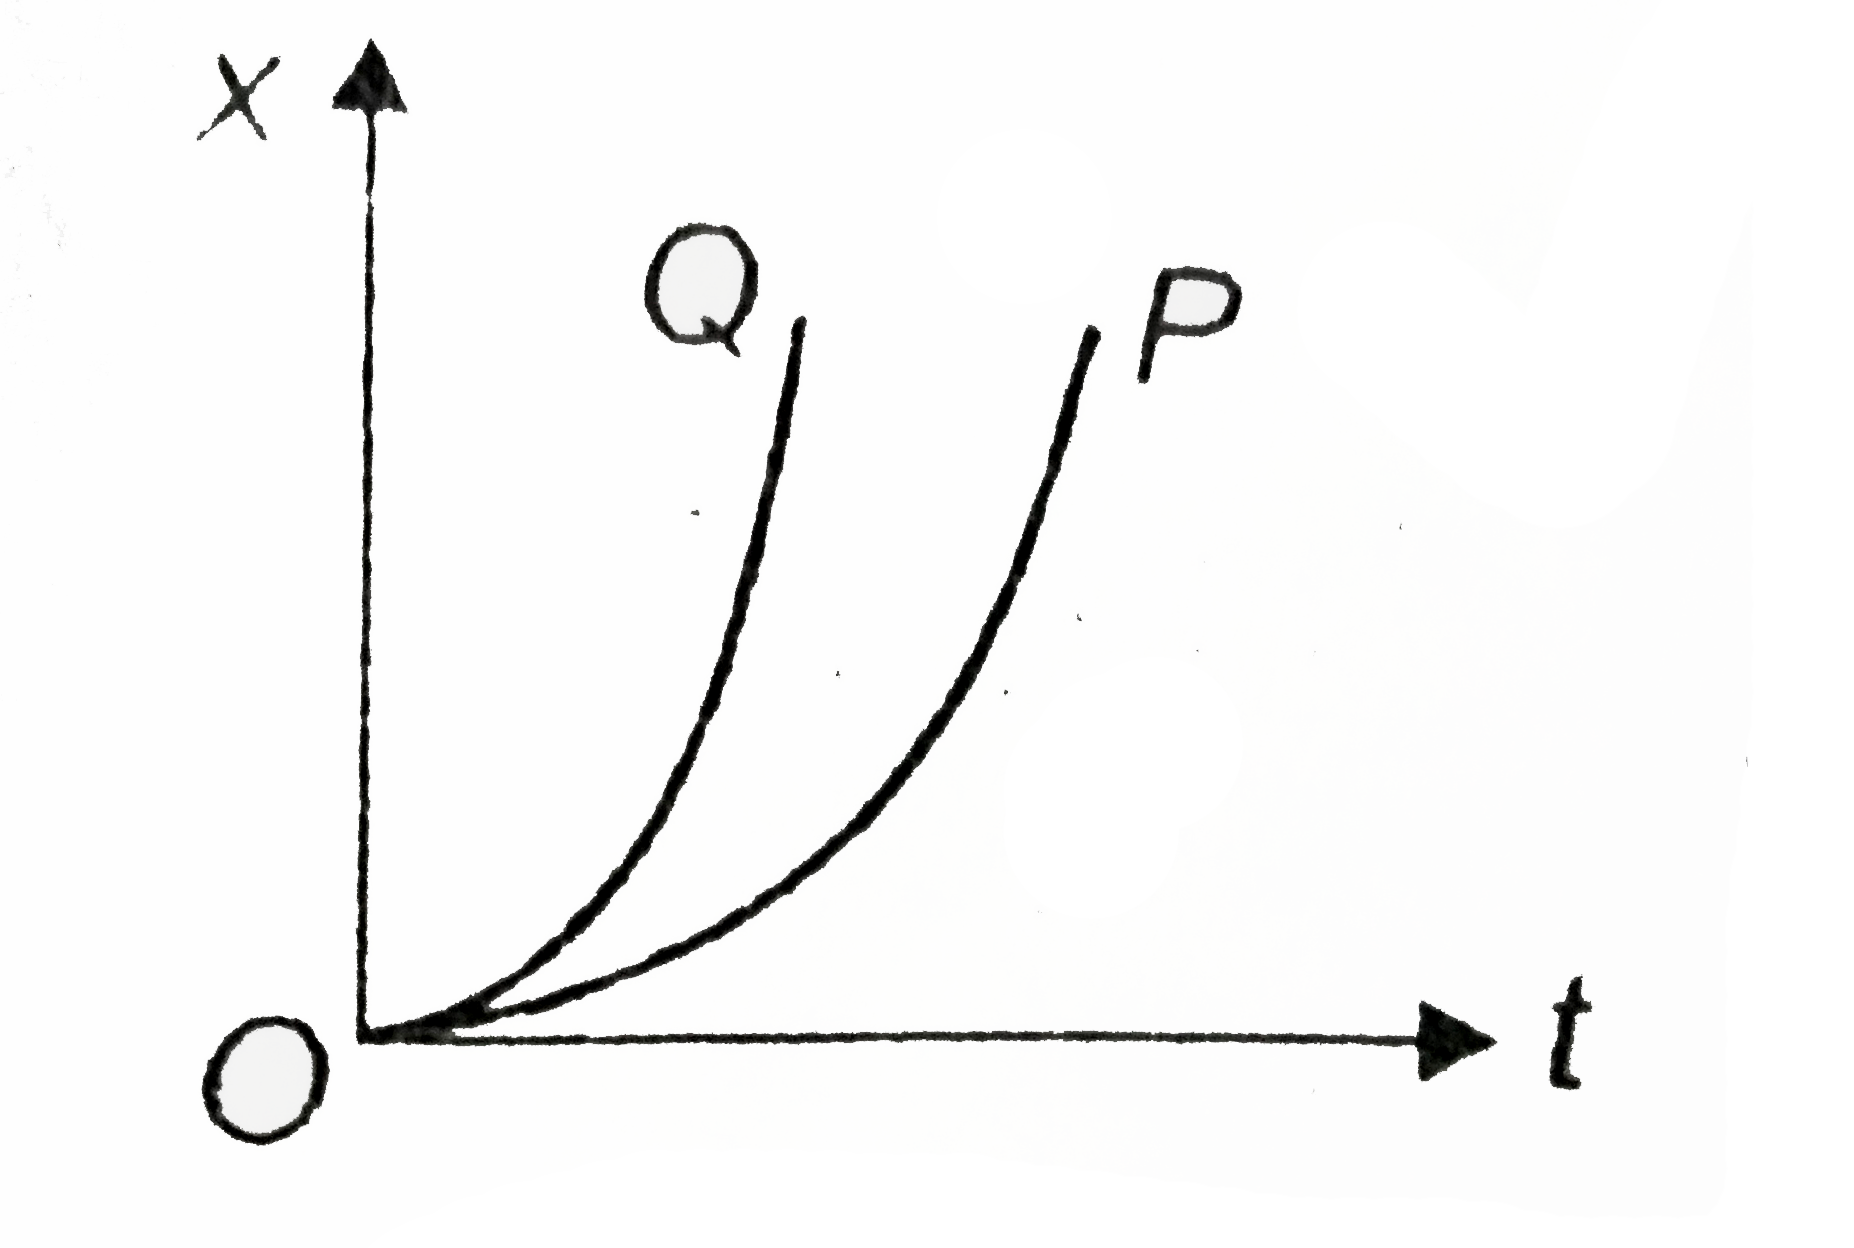
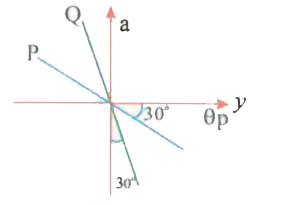
The acceleration-displacement graph of two particles P and Q exeucting SHM are represented as shown in the figure. The ratio of time periods of P, q respectively is
√3:1
1:√3
3:1
1:3
The correct Answer is:A
Slope =tanθ=ω2
ω2P:ω2Q=tan30∘:tan60∘
f2P:f2Q=1√3:√3=1:3
fP:fQ=1:TP:TQ=√3:1
Topper's Solved these Questions
- OSCILLATIONSBOOK - NARAYNACHAPTER - OSCILLATIONSEXERCISE - EXERCISE - III
29 Videos
- OSCILLATIONSBOOK - NARAYNACHAPTER - OSCILLATIONSEXERCISE - EXERCISE - IV
41 Videos
- OSCILLATIONSBOOK - NARAYNACHAPTER - OSCILLATIONSEXERCISE - EXERCISE - II (C.W)
27 Videos
- NEWTONS LAWS OF MOTIONBOOK - NARAYNACHAPTER - NEWTONS LAWS OF MOTIONEXERCISE - PASSAGE TYPE QUESTION
6 Videos
- PHYSICAL WORLDBOOK - NARAYNACHAPTER - PHYSICAL WORLDEXERCISE - C.U.Q
10 Videos
Similar Questions
Knowledge Check
Acceleration-displacement graph of a particle executing SHM Is as shown in given figure. The time period of its oscillation is: (in sec)
 Aπ2B2πCπDπ4
Acceleration -displacemnet graph of a particle executing SHM is as shown in given figure. The time period of its oscillations is (in s)
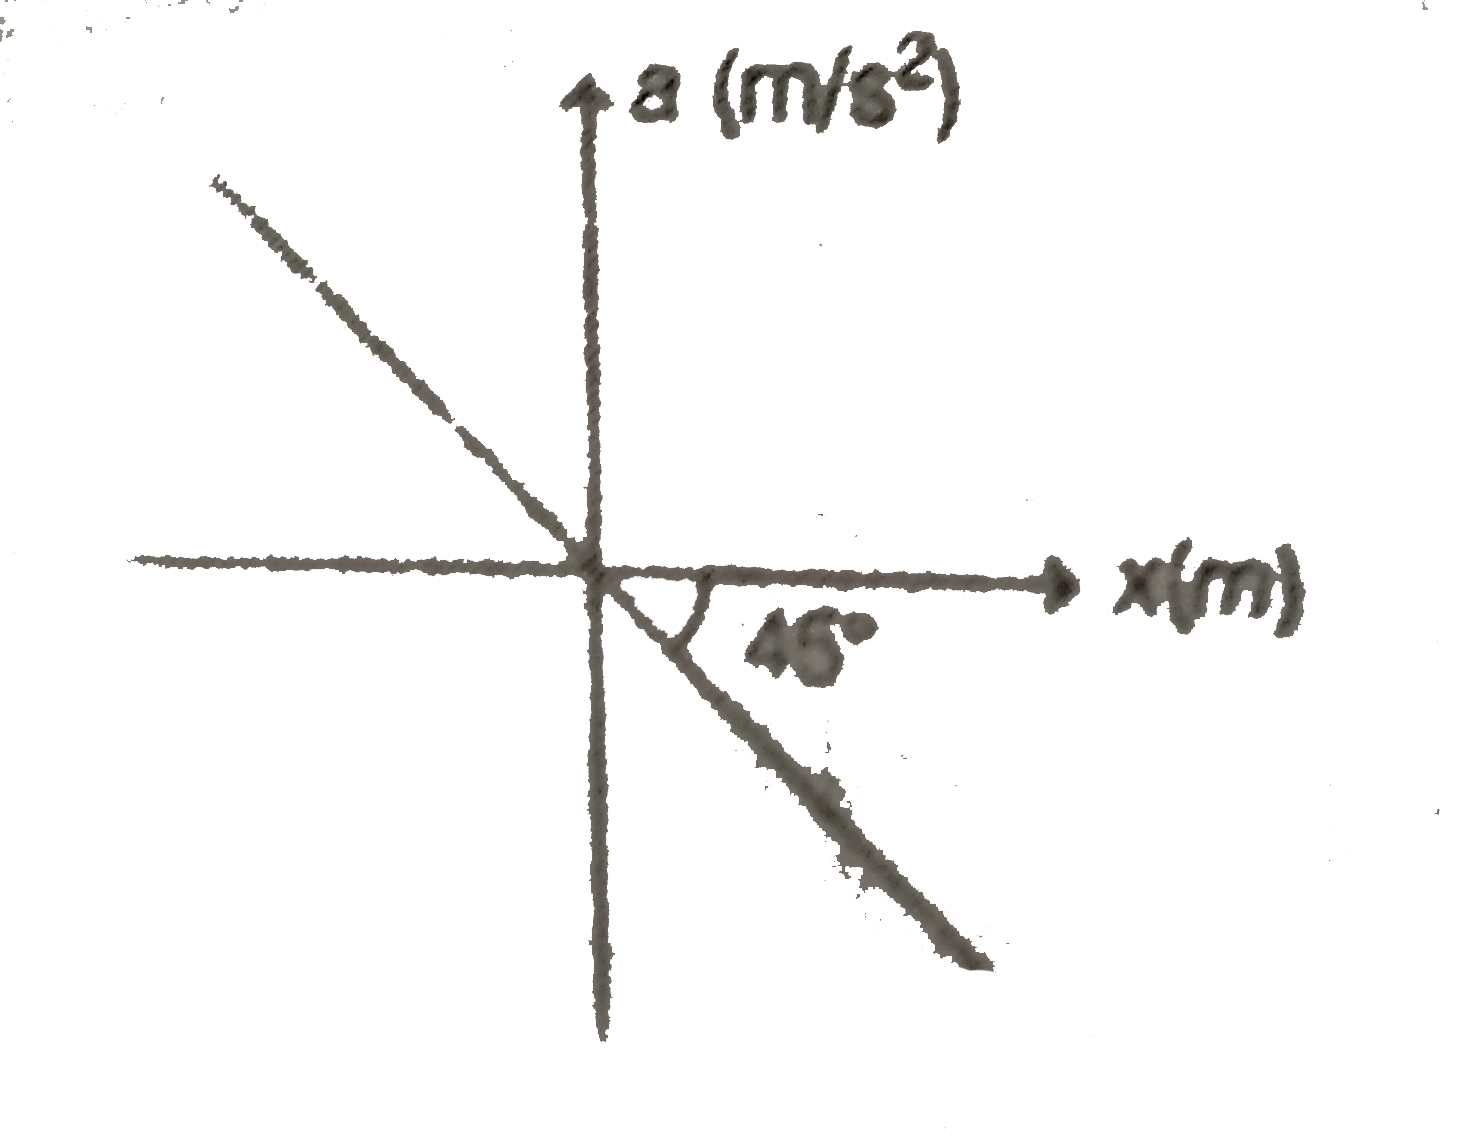 Aπ2B2piCpiDπ4
The acceleration-displacement graph of a particle executing SHM is as shown in the figure. The velocity of the particle at y = 0 is (take tan14∘ = 0.25)
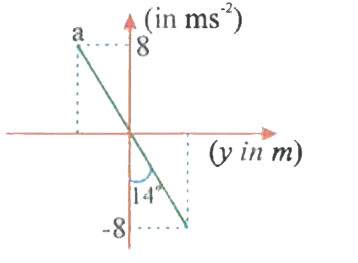 A1 ms−1B2 ms−1C4 ms−1D8 ms−1
The acceleration displacement graph of a particle executing simple harmonic motion is shown in figure. The time period of simple harmonic motion is
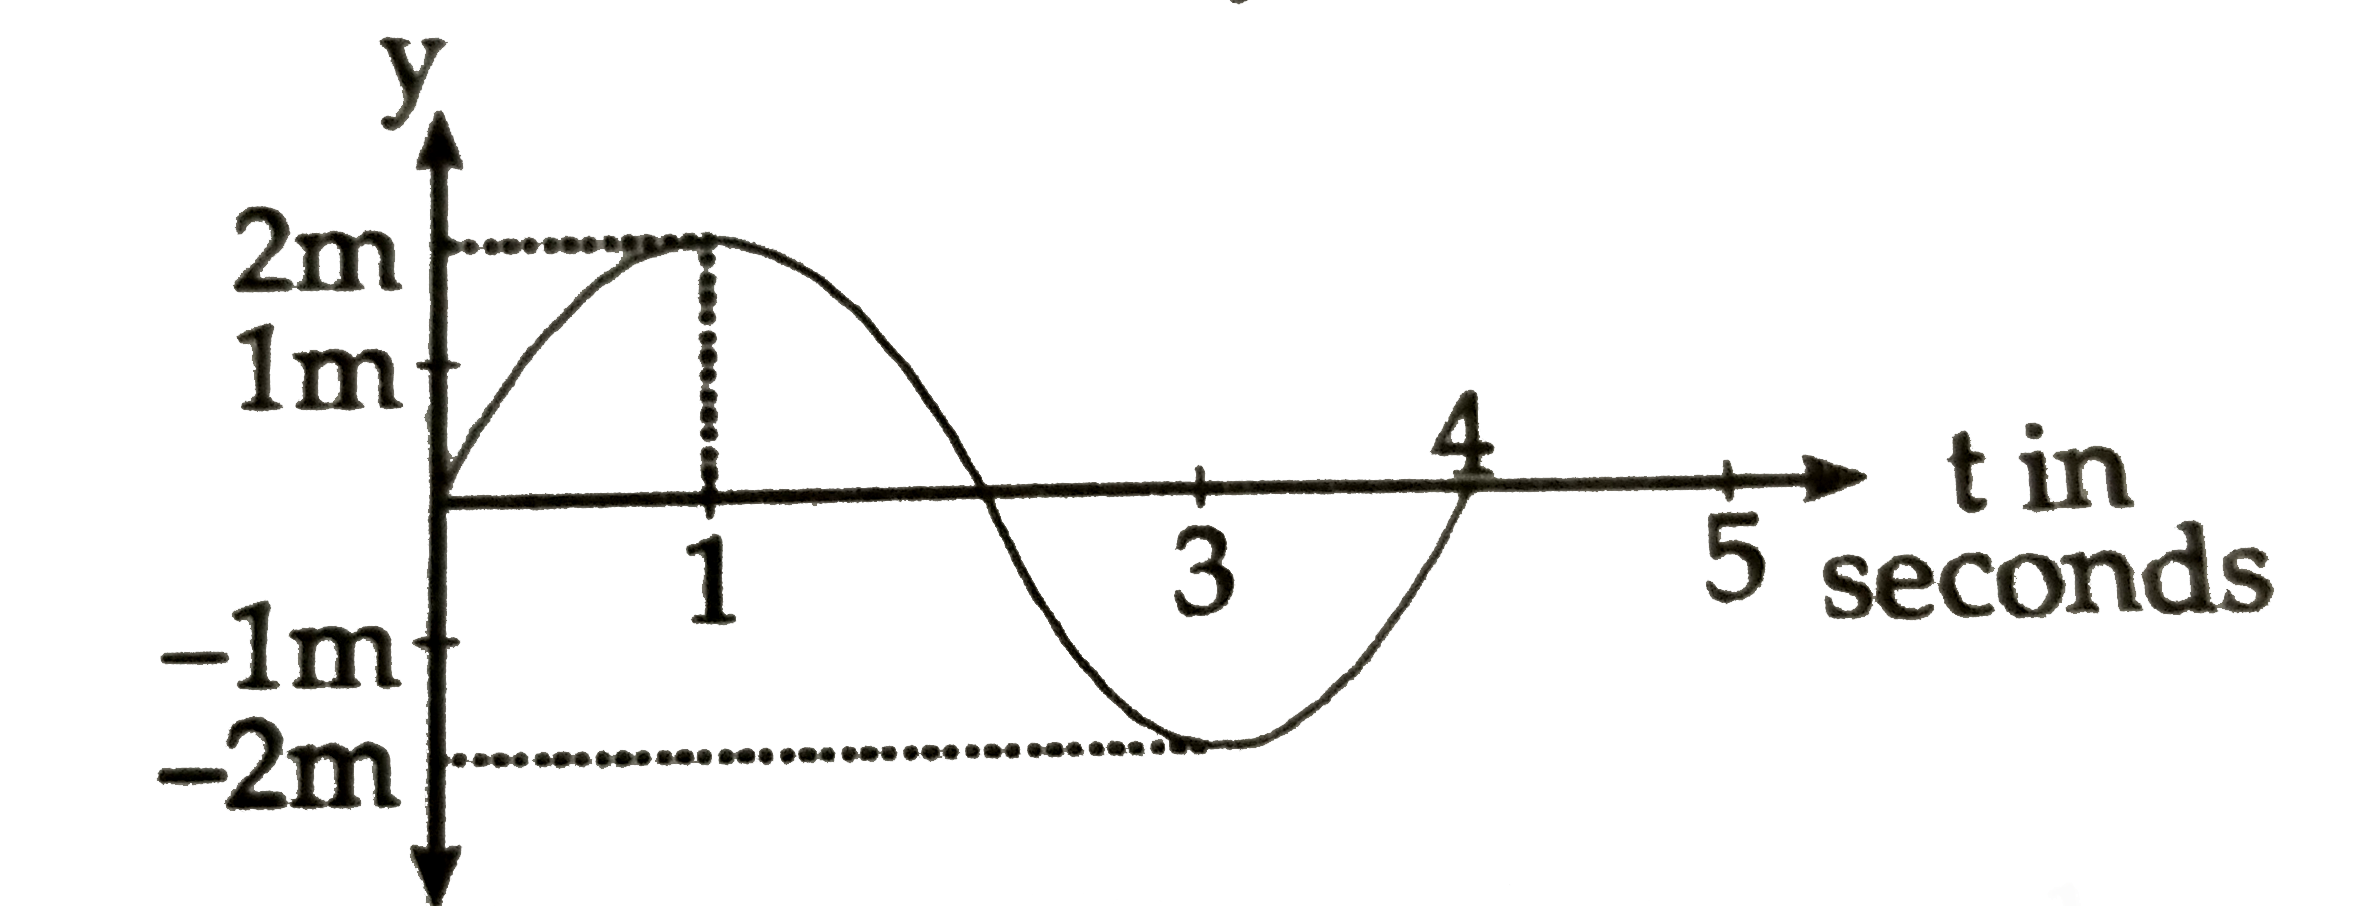
View SolutionThe displacement time graph of a particle executing SHM is as shown in the figure
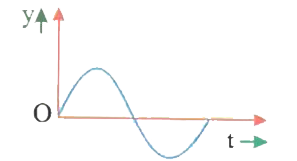
The corresponding force-time graph of the particle is
View SolutionThe acceleration versus displacement graph of a particle performing SHM is shown in figure. The time period of oscillation of particle in second is
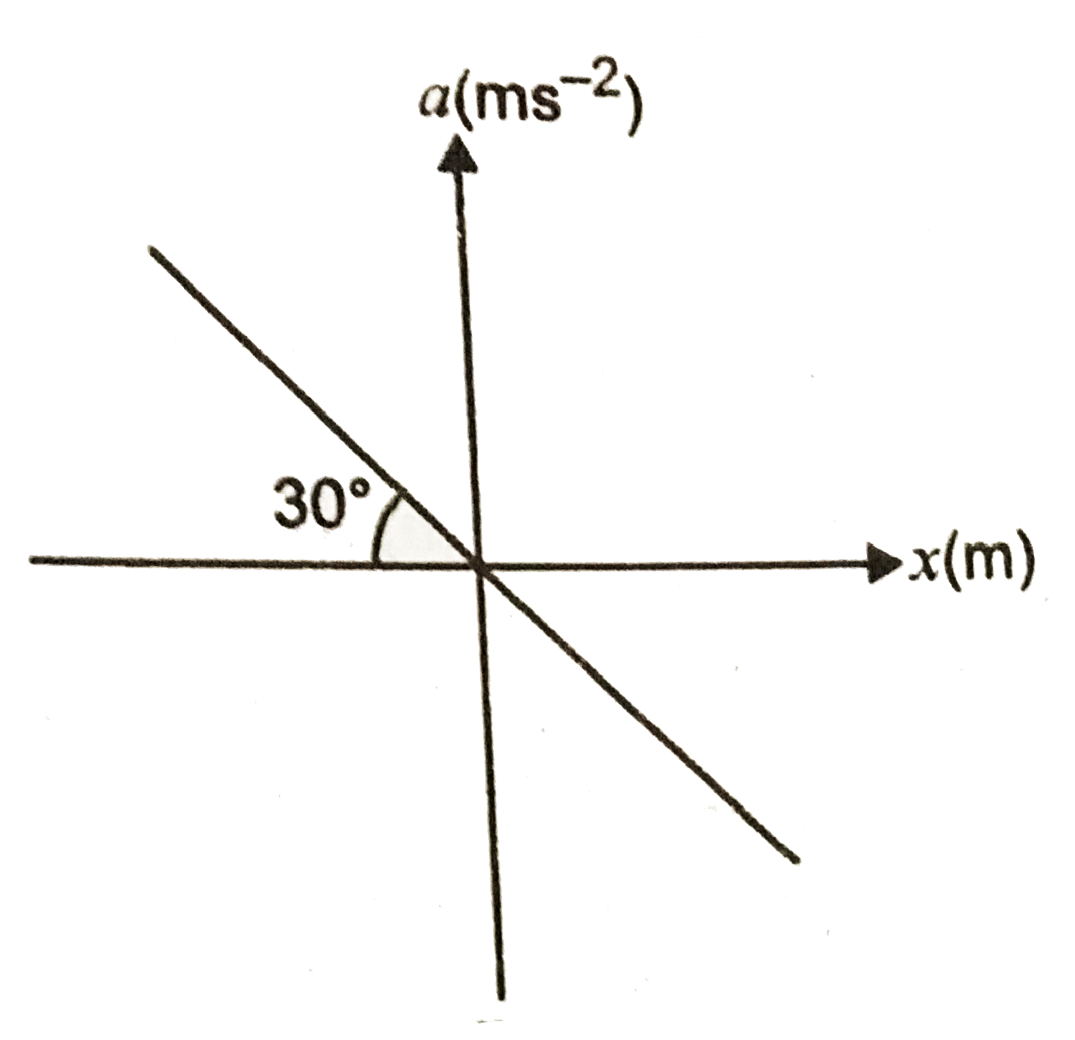
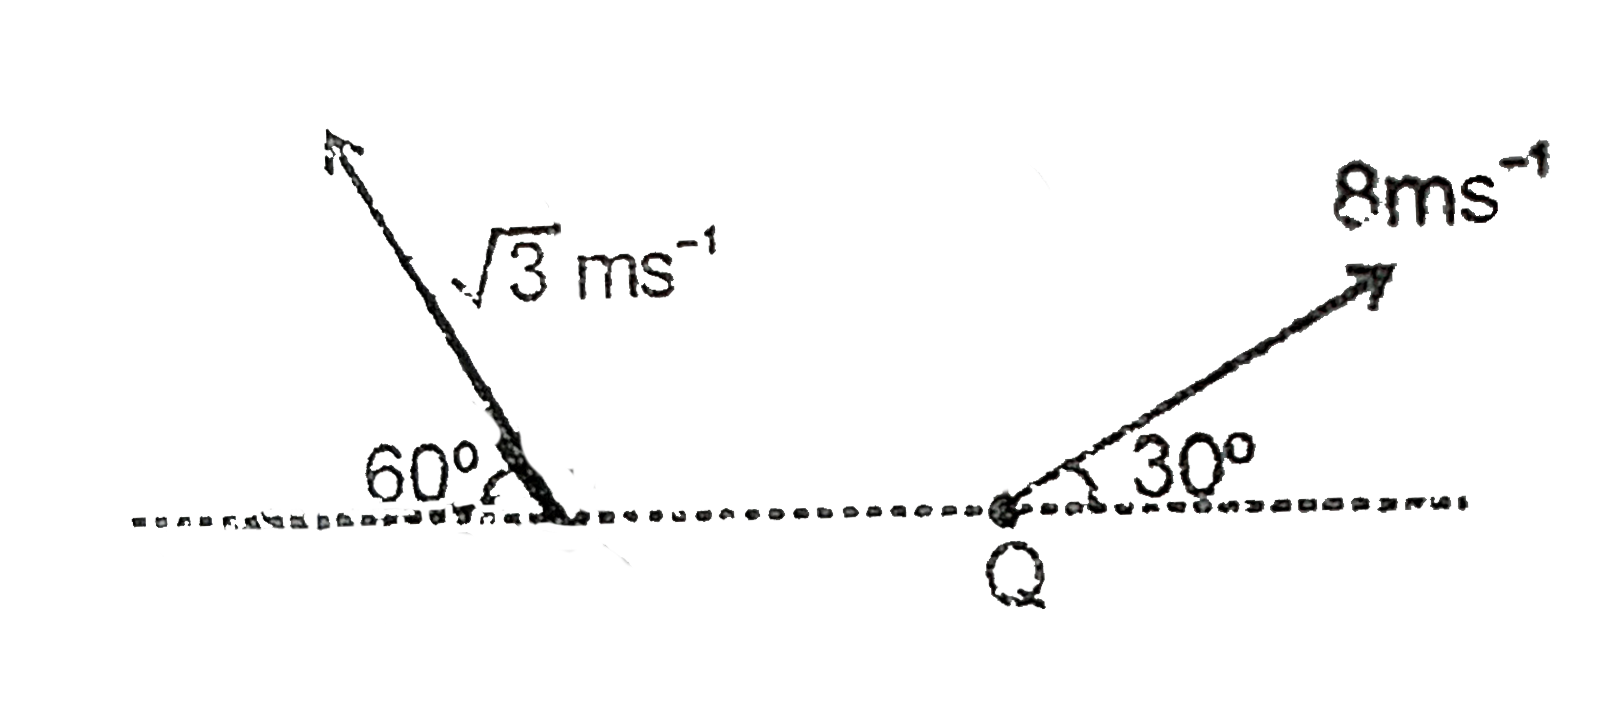
View SolutionTwo particles P and Q are moving as shown in the figure. At this moment of time the angular speed of P w.r.t. Q is
View SolutionThe displacement time graph of a particle executing S.H.M. is as shown in the figure
The corresponding force-time graph of the particle is
View Solution

