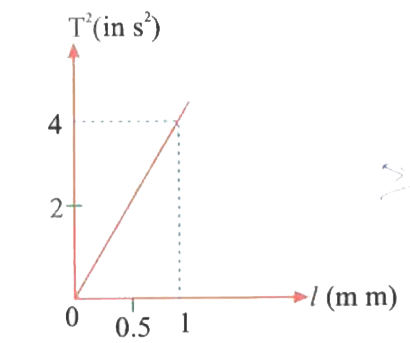
The l−T2 graph of a simple pendulum is an shown in the figure. The time period of the pendulum of length 0.5 mm is

A
1s
B
1.2 s
C
√2 s
D
1√2s
Video Solution
Text Solution
The correct Answer is:C
Slope T2l = constant
4l=T20.5,T2=2,T=√2s
|
Updated on:21/07/2023
Topper's Solved these Questions
- BOOK - NARAYNACHAPTER - OSCILLATIONSEXERCISE - EXERCISE - III29videos
OSCILLATIONS
- BOOK - NARAYNACHAPTER - OSCILLATIONSEXERCISE - EXERCISE - IV41videos
OSCILLATIONS
- BOOK - NARAYNACHAPTER - OSCILLATIONSEXERCISE - EXERCISE - II (C.W)27videos
OSCILLATIONS
- BOOK - NARAYNACHAPTER - NEWTONS LAWS OF MOTIONEXERCISE - PASSAGE TYPE QUESTION6videos
NEWTONS LAWS OF MOTION
- BOOK - NARAYNACHAPTER - PHYSICAL WORLDEXERCISE - C.U.Q10videos
PHYSICAL WORLD
Similar Questions
Knowledge Check
- Question 1 - Select One
Time period of simple pendulum is
AT=2π√lgBT=2π√glCT=√2πlgDT=12π√gl - Question 2 - Select One
The time period of a simple pendulum of infinte length is
AinfiniteB2π√R/gC2π√g/RD12π√R/g - Question 3 - Select One
The time period of a simple pendulum in a satellite is
ASame on the earth,BZeroCInfiniteDNone of these.
The graph of l against T for a simple pendulum is
View SolutionIf the length of a simple pendulum is increased by 2%, then the time period
View SolutionIf the length of a simple pendulum is increased by 2%, then the time period
View SolutionWhen the length of the pendulum increases, the time period of the pendulum ______.
View SolutionWhen the length of the pendulum increases, the time period of the pendulum ______.
View Solution

