The area under acceleration-time graph gives
intial velocity
final velocity
change in velocity
distance travelled
The correct Answer is:C
To solve the question, "The area under the acceleration-time graph gives:", we can follow these steps:
Step 1: Understand the acceleration-time graph
The acceleration-time graph represents how acceleration varies with time. The area under this graph is significant in kinematics.
Step 2: Recall the relationship between acceleration and velocity
Acceleration is defined as the rate of change of velocity with respect to time. Mathematically, this can be expressed as:
a=ΔvΔt
where a is acceleration, Δv is the change in velocity, and Δt is the change in time.
Step 3: Calculate the area under the graph
The area under the acceleration-time graph can be calculated as:
Area=a×Δt
This represents the product of acceleration and the time interval over which it acts.
Step 4: Relate the area to change in velocity
From the definition of acceleration, we can rearrange the formula:
Δv=a×Δt
Thus, the area under the acceleration-time graph gives us the change in velocity (Δv) over the time interval Δt.
Step 5: Conclusion
Therefore, the area under the acceleration-time graph represents the change in velocity.
Final Answer:
The area under the acceleration-time graph gives the change in velocity.
---
The acceleration-time graph represents how acceleration varies with time. The area under this graph is significant in kinematics.
Acceleration is defined as the rate of change of velocity with respect to time. Mathematically, this can be expressed as:
a=ΔvΔt
where a is acceleration, Δv is the change in velocity, and Δt is the change in time.
The area under the acceleration-time graph can be calculated as:
Area=a×Δt
This represents the product of acceleration and the time interval over which it acts.
From the definition of acceleration, we can rearrange the formula:
Δv=a×Δt
Thus, the area under the acceleration-time graph gives us the change in velocity (Δv) over the time interval Δt.
Therefore, the area under the acceleration-time graph represents the change in velocity.
The area under the acceleration-time graph gives the change in velocity.
Topper's Solved these Questions
- MOTION IN A STRAIGHT LINEBOOK - NCERT FINGERTPS ENGLISHCHAPTER - MOTION IN A STRAIGHT LINEEXERCISE - KINEMATIC EQUATIONS FOR UNIFORMLY ACCELERATED MOTION
32 Videos
- MOTION IN A STRAIGHT LINEBOOK - NCERT FINGERTPS ENGLISHCHAPTER - MOTION IN A STRAIGHT LINEEXERCISE - RELATIVE VELOCITY
18 Videos
- MOTION IN A STRAIGHT LINEBOOK - NCERT FINGERTPS ENGLISHCHAPTER - MOTION IN A STRAIGHT LINEEXERCISE - INSTANTANEOUS VELOCITY AND SPEED
16 Videos
- MOTION IN A PLANE BOOK - NCERT FINGERTPS ENGLISHCHAPTER - MOTION IN A PLANE EXERCISE - Assertion And Reason
15 Videos
- OSCILLATIONS BOOK - NCERT FINGERTPS ENGLISHCHAPTER - OSCILLATIONS EXERCISE - Assertion And Reason
15 Videos
Similar Questions
Knowledge Check
Assertion : For a particle, acceleration-time graph gives the velocity.
Reason : Rate of change of velocity is acceleration.AIf both assertion and reason are trure and reason is the correct explanation of assertion.BIf both assertion and reason are true but reason is not the correct explanations of assertion.CIf assertion is true but reason is false.DIf both assertion and reason is falseThe given acceleration-time graph represents which of the following physical situation?
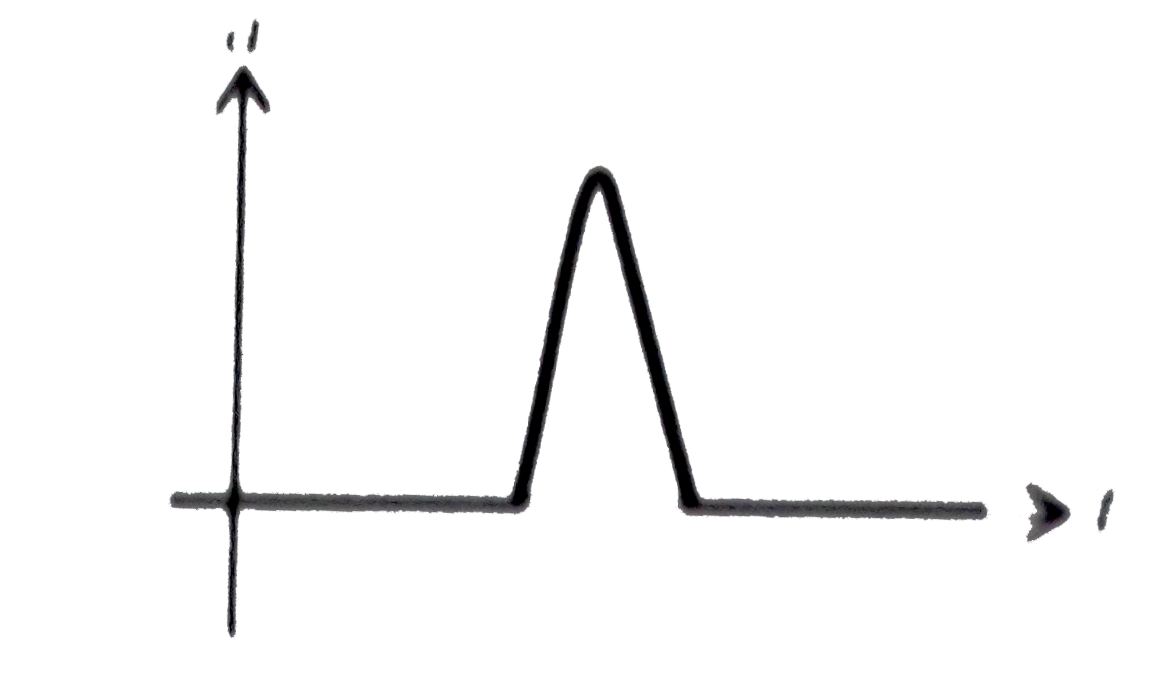 AA cricket ball moving with a uniform speed is hit with a bat for a very short time interval.BA ball is falling freely from the top of a tower.CA car moving with constant velocity on a straight road.DA football is kicked into the air vertically upwards.
The area under velocity-time graph for a particle in a given interval of time represnets
AvelocityBaccelerationCwork doneDDisplacement does not tell the nature of the actual motion of a particle between the points.
The uniform motion in the following acceleration-time graph is
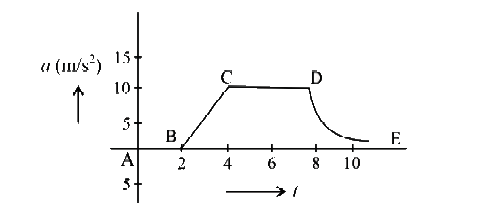
View SolutionWhich of the following graph for a body moving along a straight line is possible ?
View SolutionConsiedr the following x−t garaph to be parabolic. Draw the velocity-time graph and acceleration-time graph analyze the motion of the particle regarding its velocity and acceleration.
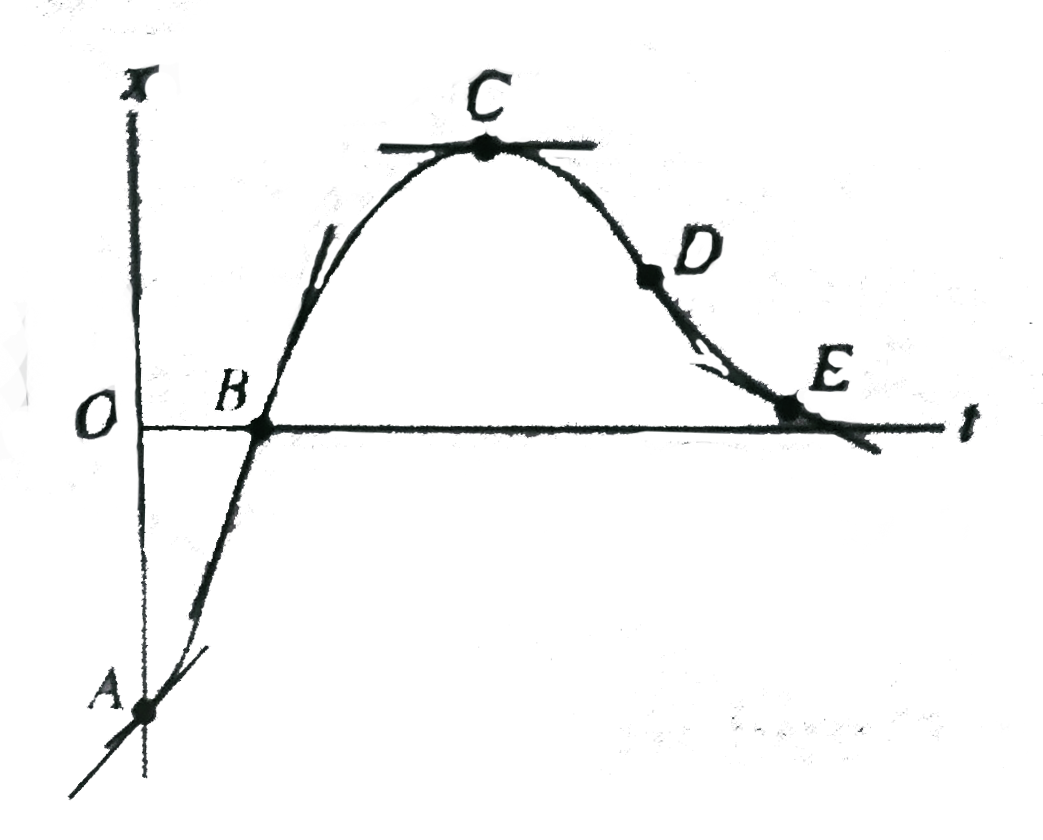 .
.
View SolutionThe velocity-time graph is given below
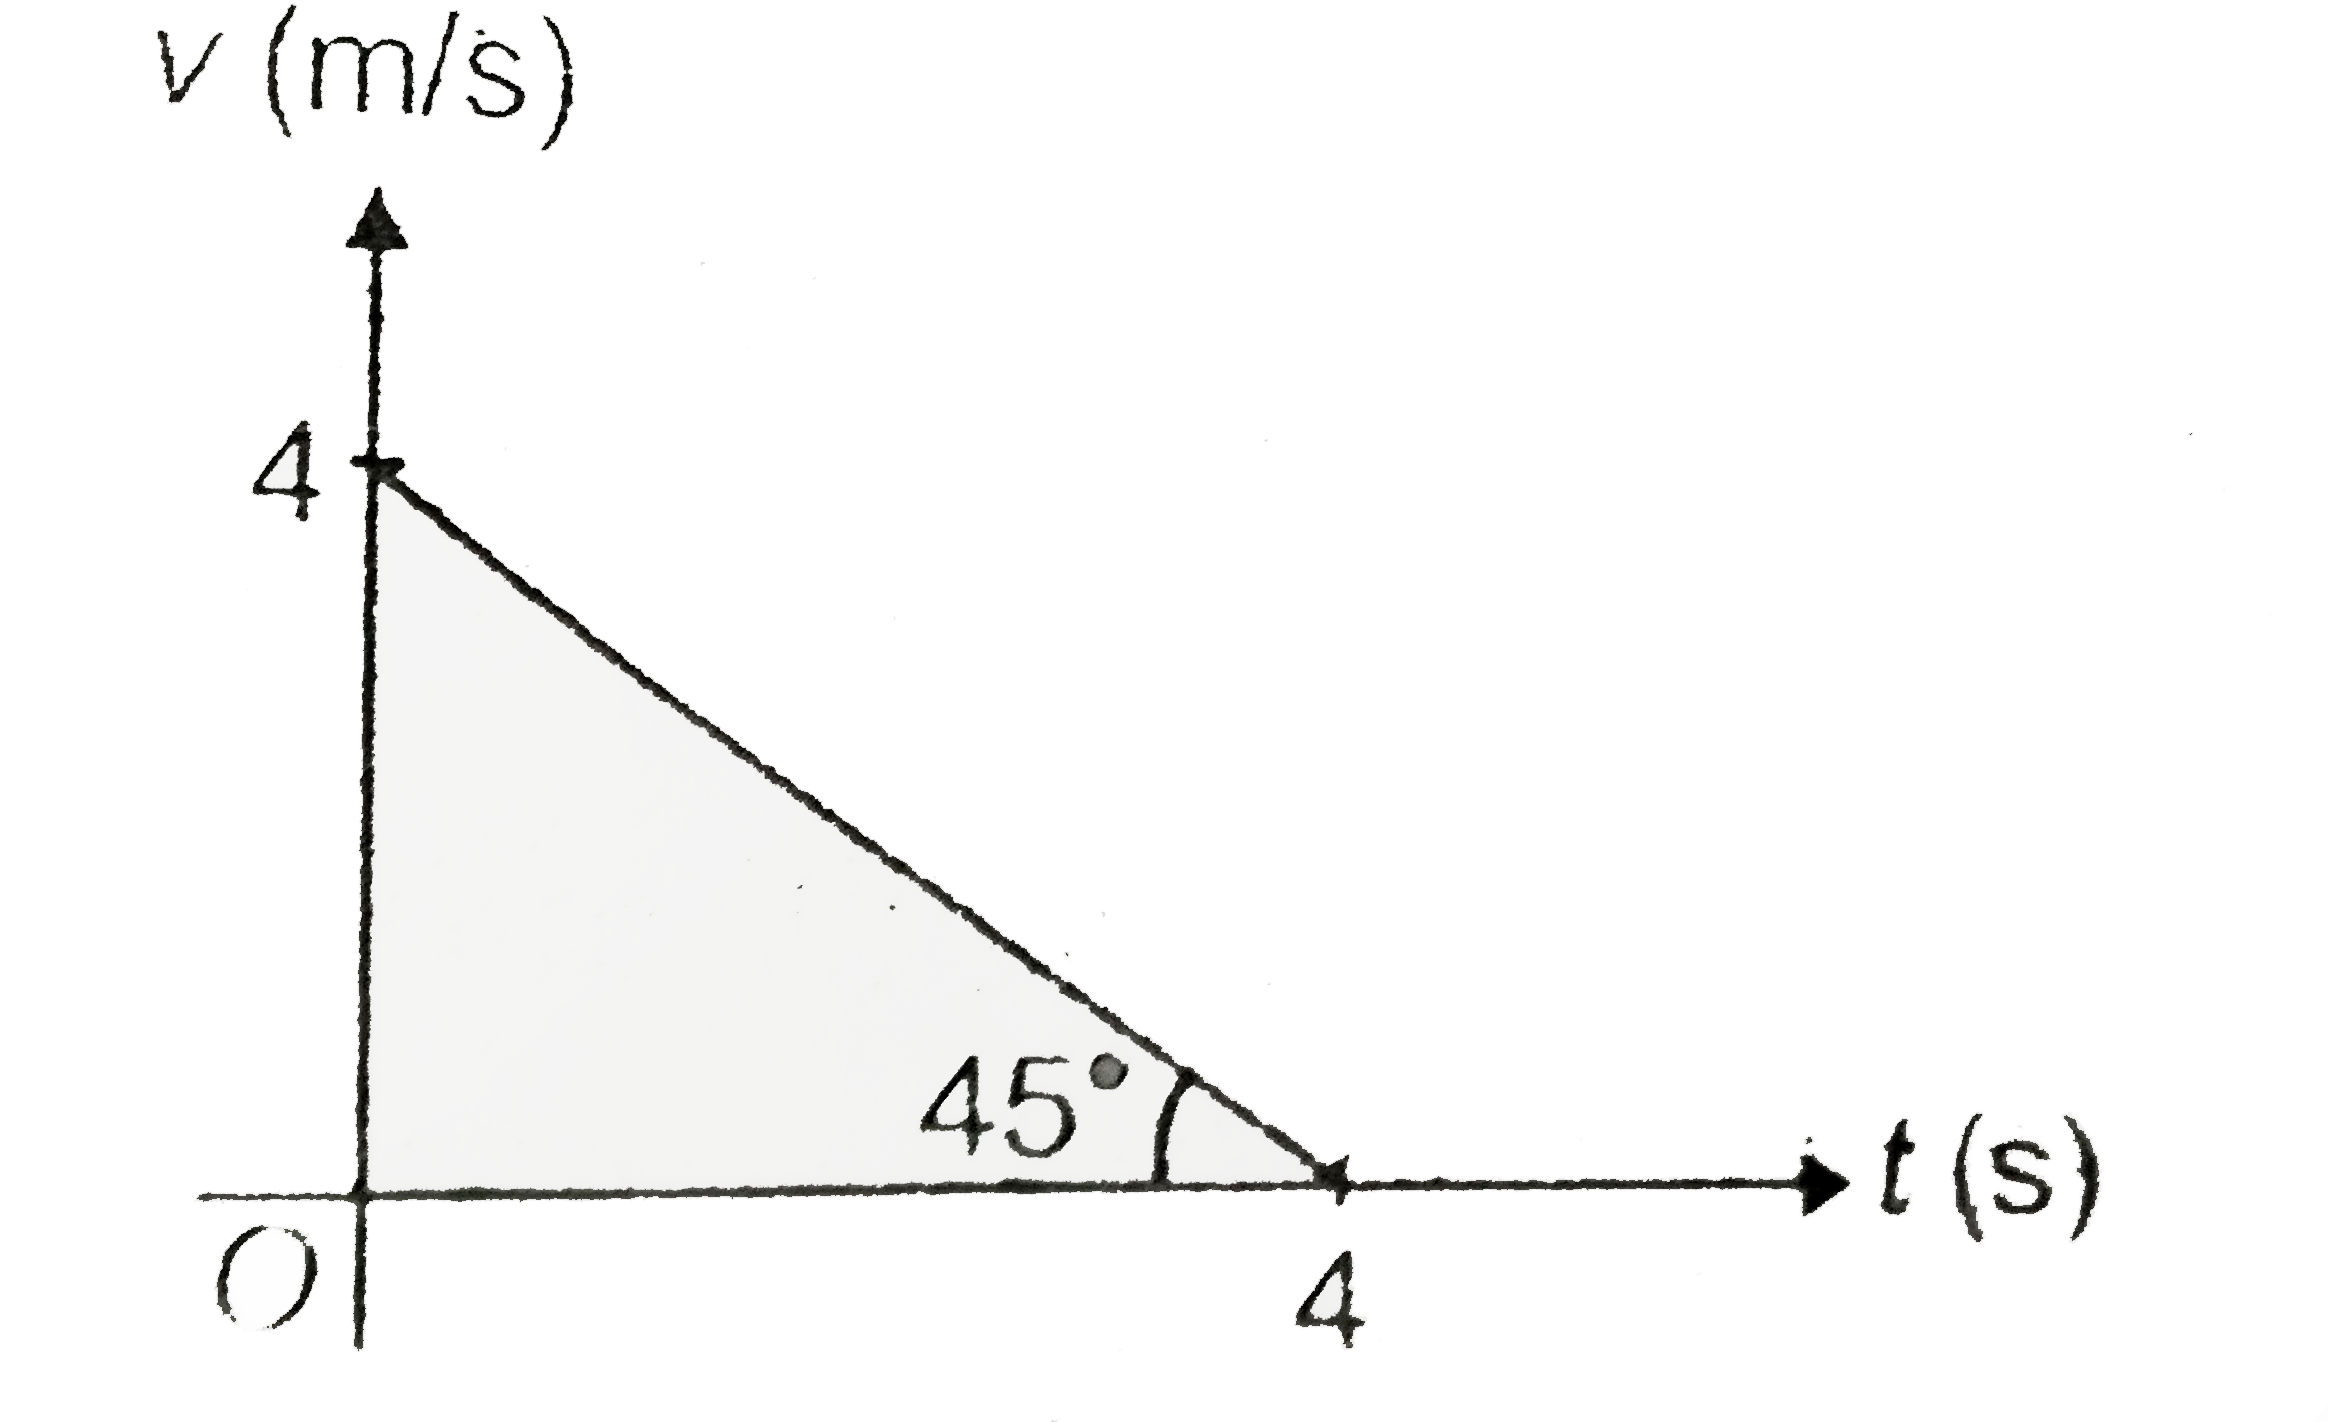
Draw the acceleration-time graph and position-time graph, given that at t = 0, particle is at origin.
View SolutionDraw the acceleration-time graphs for the given velocity-time graphs of a particle moving along x-axis.

View Solution

