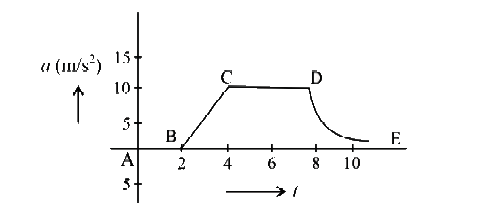
The uniform motion in the following acceleration-time graph is

AB
BC
CD
DE
The correct Answer is:D
Step by step video & image solution for The uniform motion in the following acceleration-time graph is by Physics experts to help you in doubts & scoring excellent marks in Class 12 exams.
Updated on:21/07/2023Topper's Solved these Questions
- MOTION IN A STRAIGHT LINE & PLANE BOOK - VMC MODULES ENGLISHCHAPTER - MOTION IN A STRAIGHT LINE & PLANE EXERCISE - EFFICIENT
50 Videos
- MOTION IN A STRAIGHT LINE & PLANE BOOK - VMC MODULES ENGLISHCHAPTER - MOTION IN A STRAIGHT LINE & PLANE EXERCISE - IMPECCABLE
52 Videos
- MOTION IN A STRAIGHT LINE & PLANE BOOK - VMC MODULES ENGLISHCHAPTER - MOTION IN A STRAIGHT LINE & PLANE EXERCISE - IMPECCABLE
52 Videos
- MOCK TEST 9BOOK - VMC MODULES ENGLISHCHAPTER - MOCK TEST 9EXERCISE - PHYSICS (SECTION 2)
5 Videos
- Motion in Straight Line BOOK - VMC MODULES ENGLISHCHAPTER - Motion in Straight Line EXERCISE - IN-CHAPTER EXERCISE-J
10 Videos
Similar Questions
Knowledge Check
The area under acceleration-time graph gives
Aintial velocityBfinal velocityCchange in velocityDdistance travelledFor a uniformly retarded motion, the velocity-time graph is :
Aa curveBa straight line parallel to the time axisCa straight line perpendicular to the time axis.Da straight line inclined to the time axis.
The velocity-time graph of a bosy moving along a straight line is given below find:
(a) Average velocity in whole time of motion
(b) Average speed in whole time of motion
(c ) Draw acceleration vs time graph.
 .
.
View SolutionA : The area under acceleration - time graph is equal to velocity of object.
R : For an object moving with constant acceleration, position - time graph is a straight line.
View SolutionGraphs are very useful to represent a physical situation. Various quantities can be easily represented on graphs and other quantites can be determined from the graph. For example the slope of velocity-time graph represents instantaneous acceleration. For a motion with constant acceleration slope of velocity-time graph is constant. If acceleration is changing with time, slope with change and thus velocity-time graph will be a non-linear curve. Further the area of velocity-time graph gives displacement.
For the above situation let t1 be the time of accelerated motion and t2 be the time or retarded motion, then the correct relation is
View SolutionGraphs are very useful to represent a physical situation. Various quantities can be easily represented on graphs and other quantites can be determined from the graph. For example the slope of velocity-time graph represents instantaneous acceleration. For a motion with constant acceleration slope of velocity-time graph is constant. If acceleration is changing with time, slope will change and thus velocity-time graph will be a non-linear curve. Further the area of velocity-time graph gives displacement.
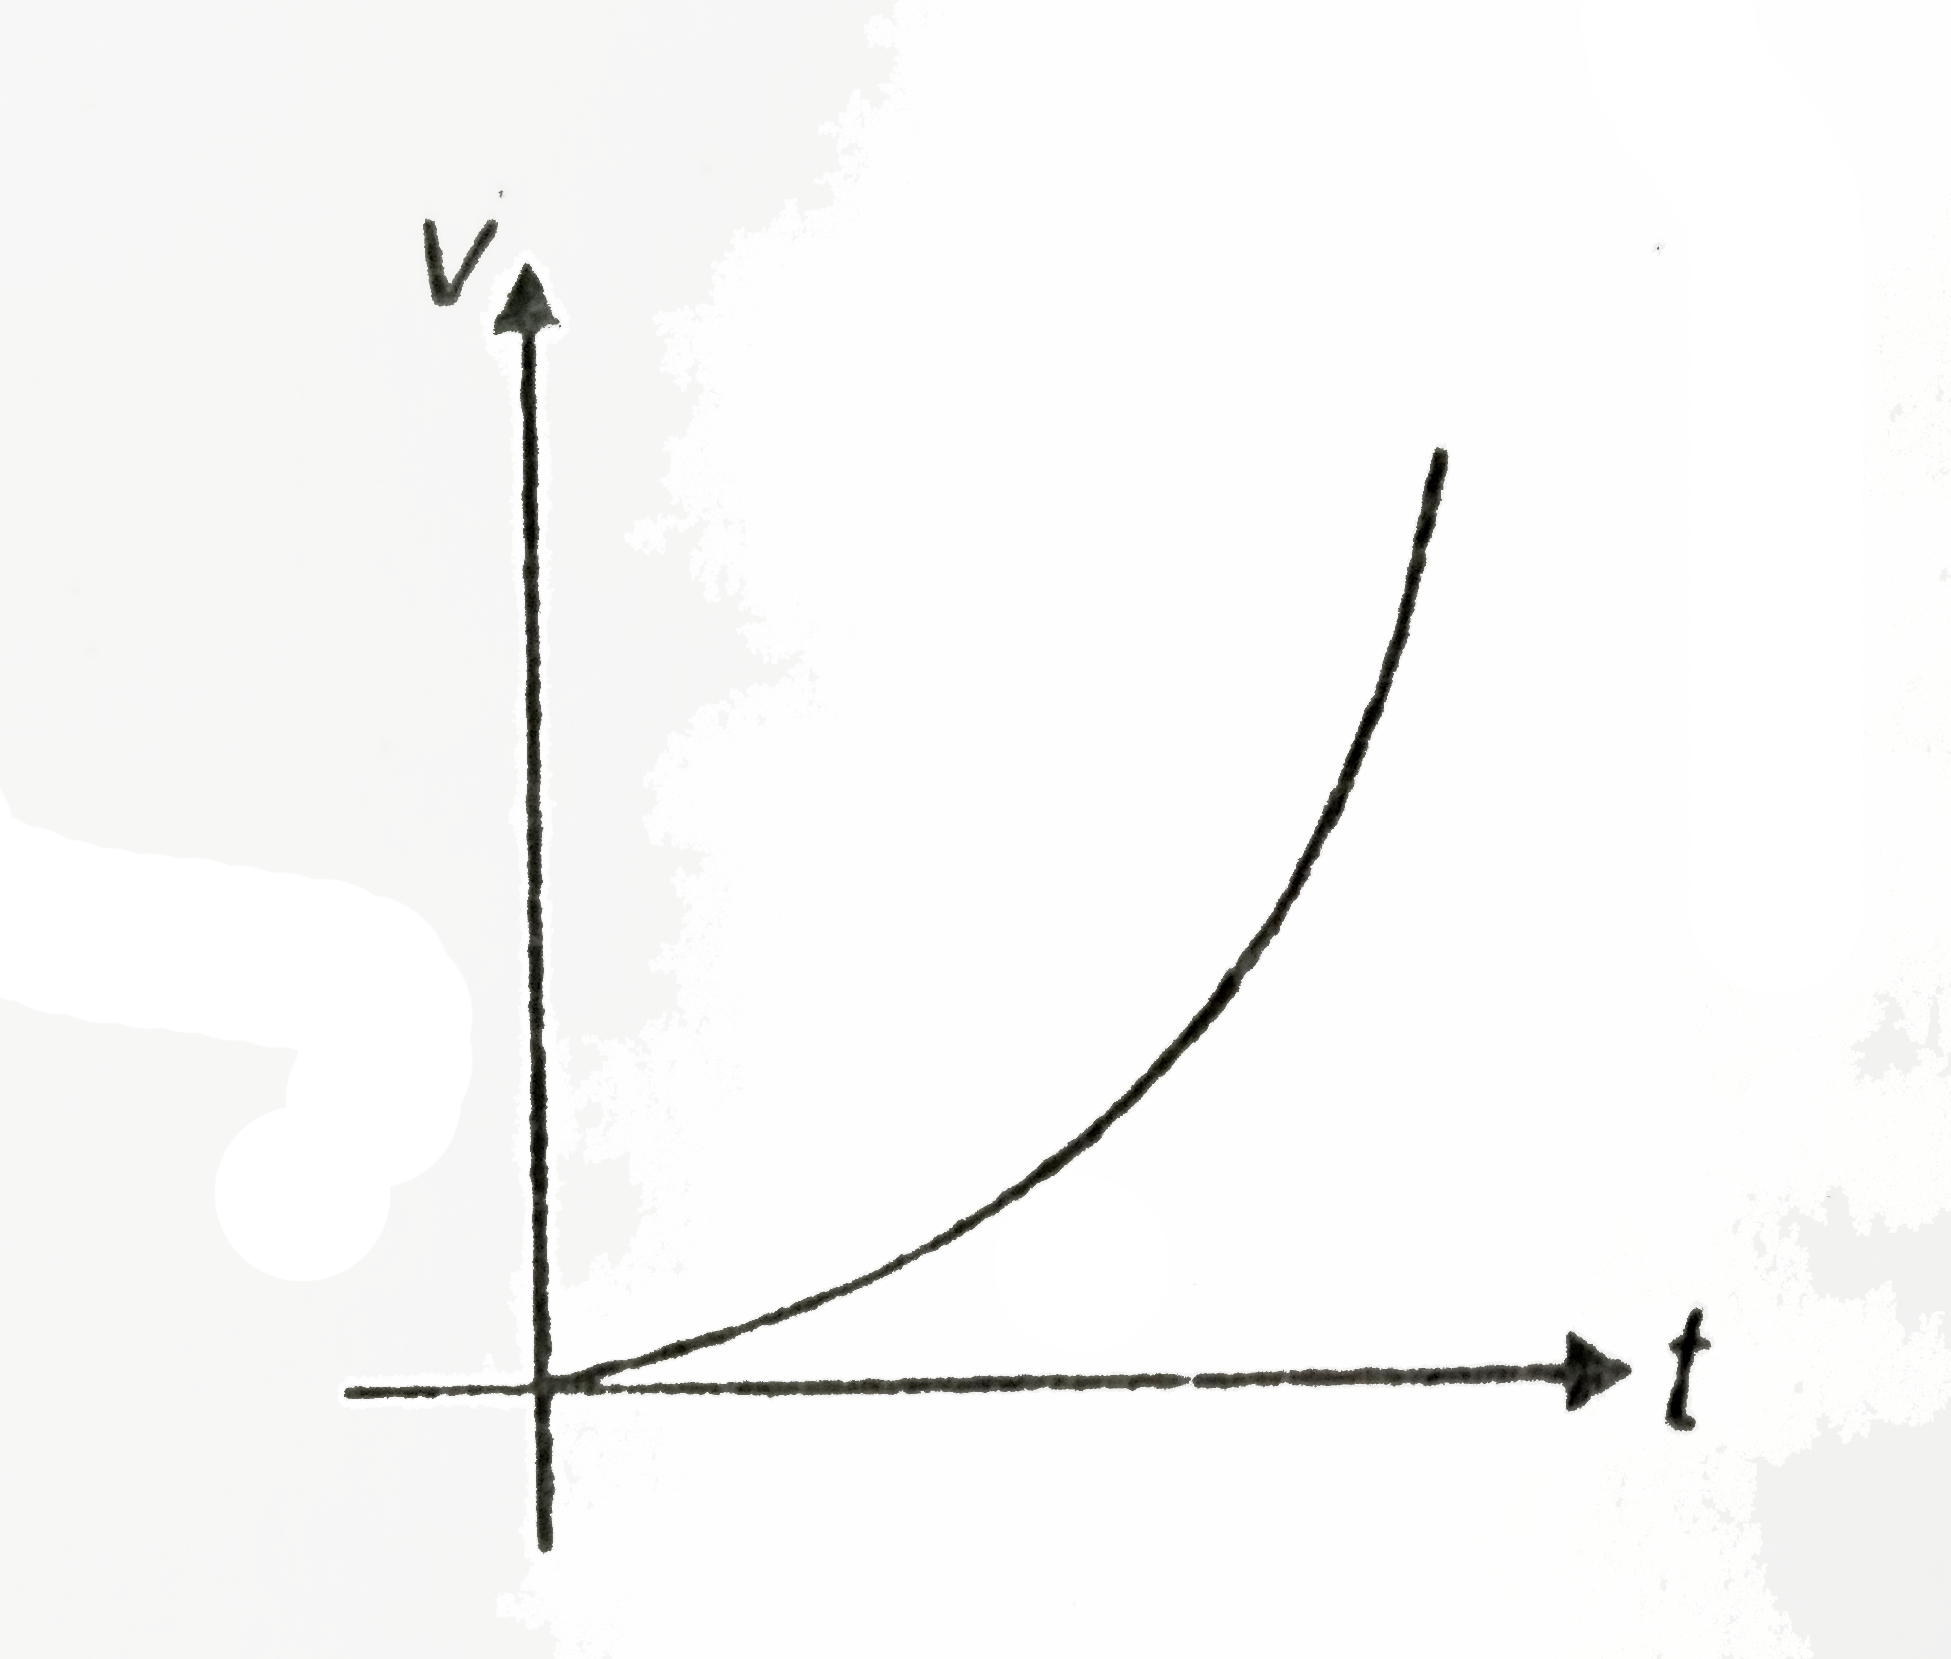
For the given velocity-time graph the possibly correct acceleration-time relationship is

View SolutionGraphs are very useful to represent a physical situation. Various quantities can be easily represented on graphs and other quantites can be determined from the graph. For example the slope of velocity-time graph represents instantaneous acceleration. For a motion with constant acceleration slope of velocity-time graph is constant. If acceleration is changing with time, slope with change and thus velocity-time graph will be a non-linear curve. Further the area of velocity-time graph gives displacement.
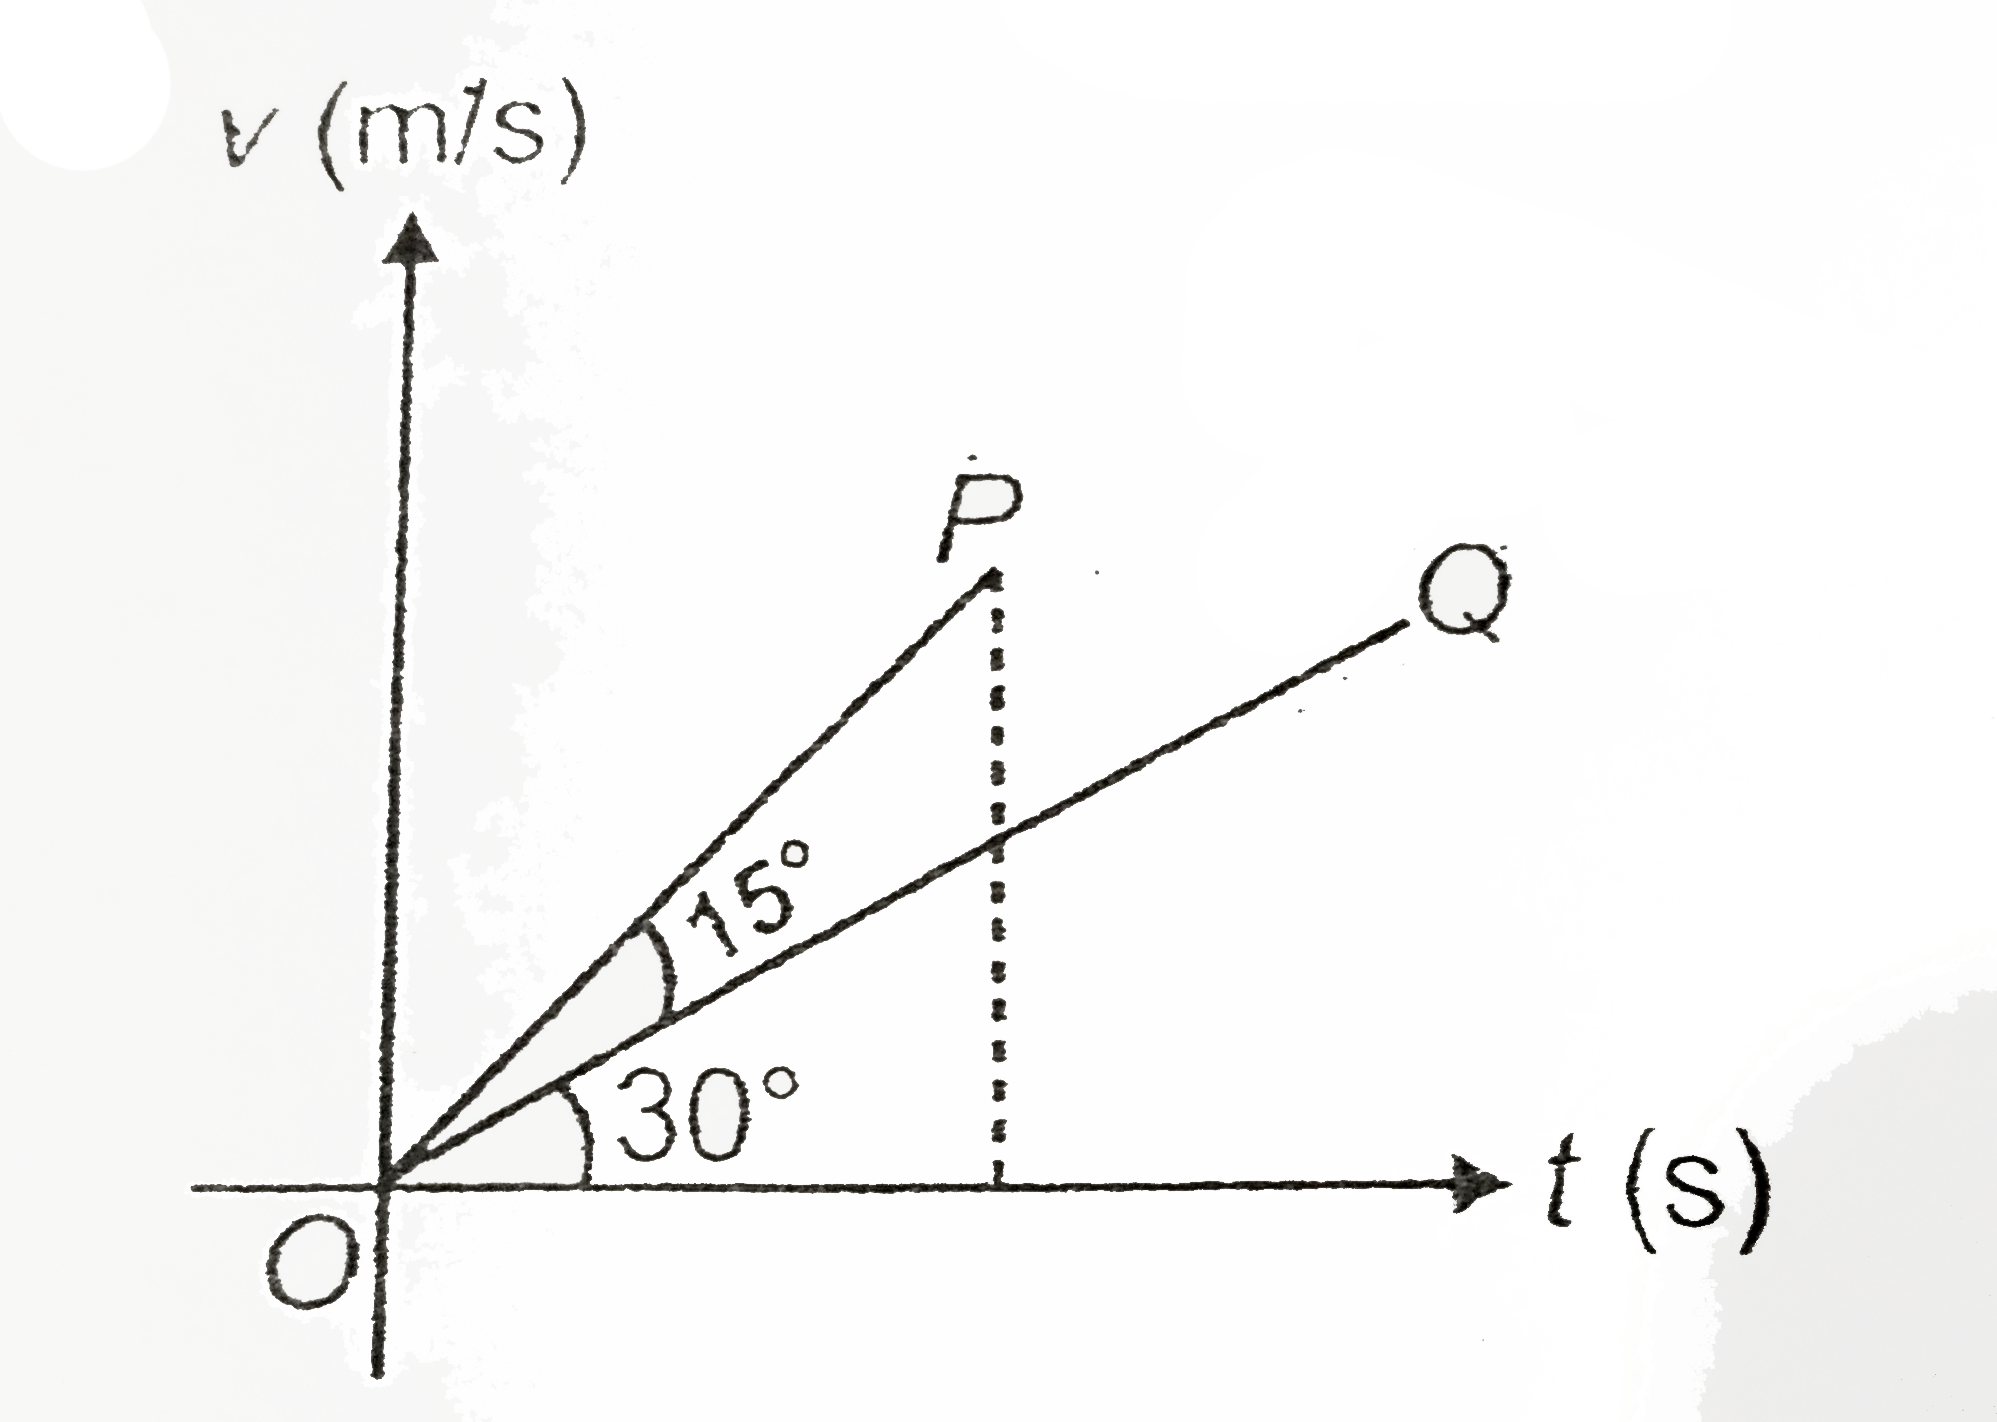
The velocity-time graph for two objects P and Q are shown. The ratio of their respective acceleration is

View Solution(A) : No force is required by the body to remain in a state of uniform motion.
(r) : In uniform linear motion, acceleration has a finite value.
View Solution

