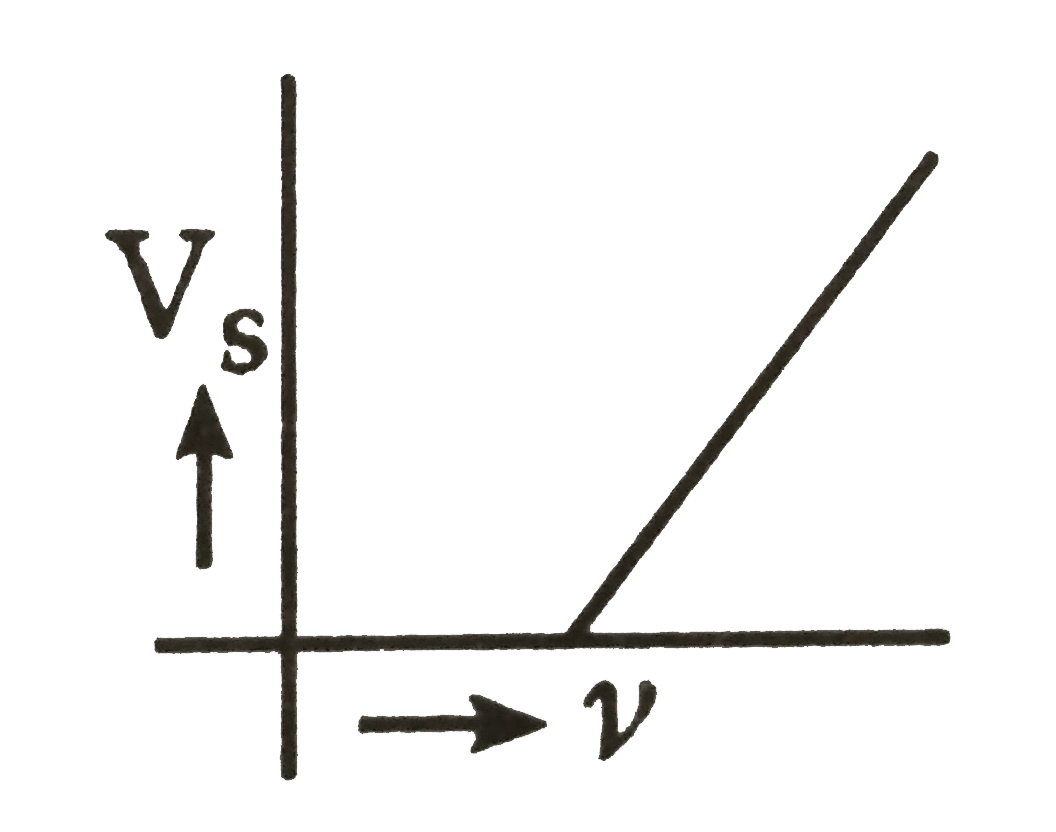
The correct curve between the stopping potential (V) and intensity of incident light (I) is
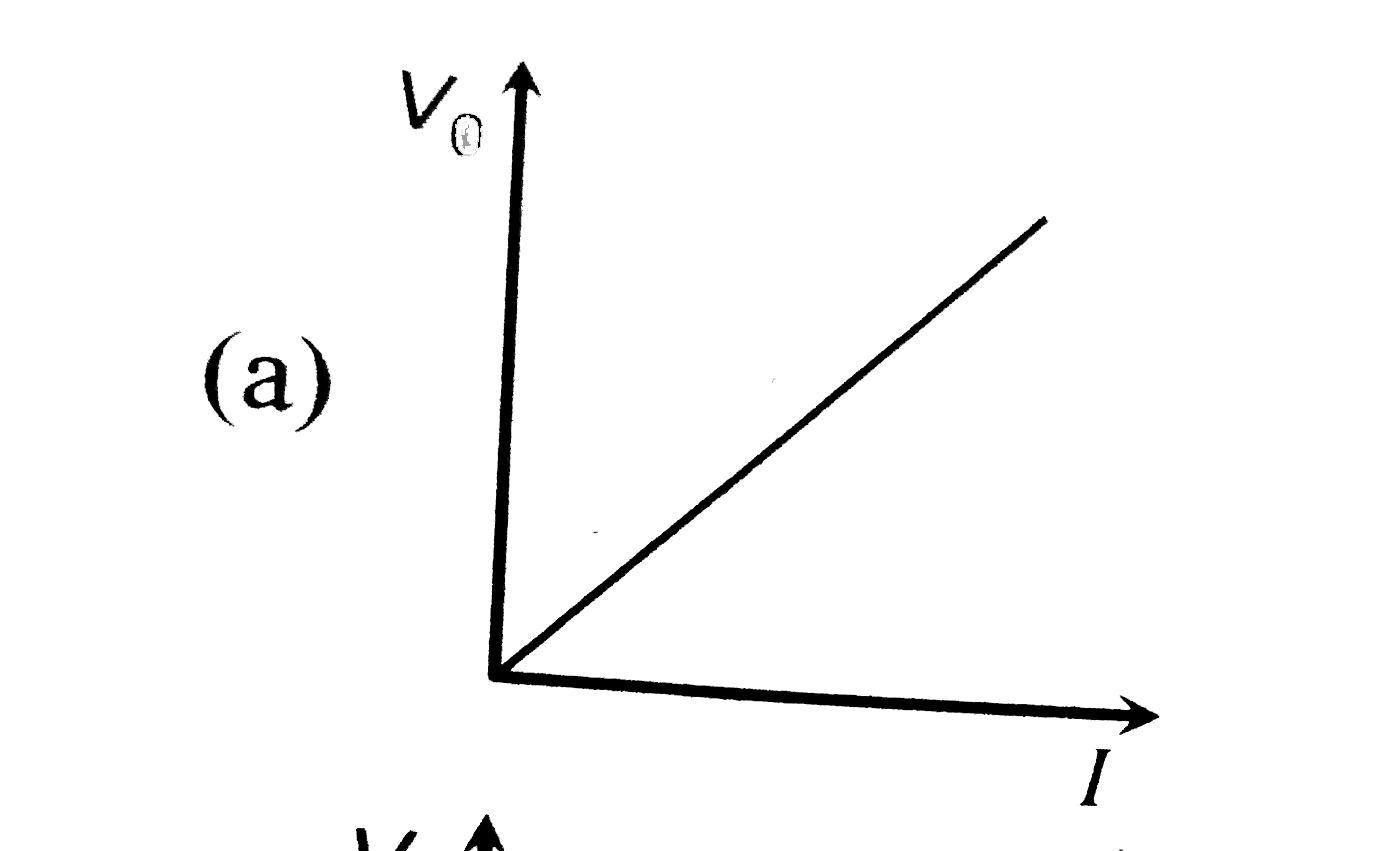
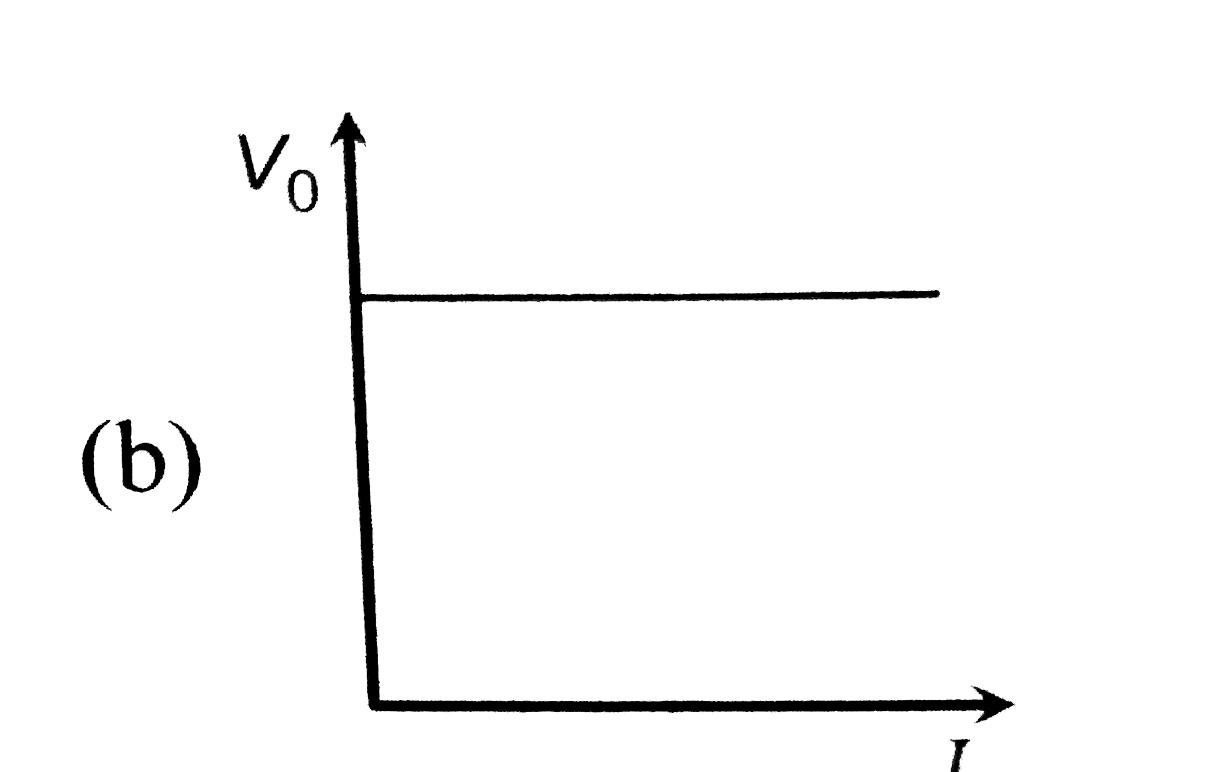
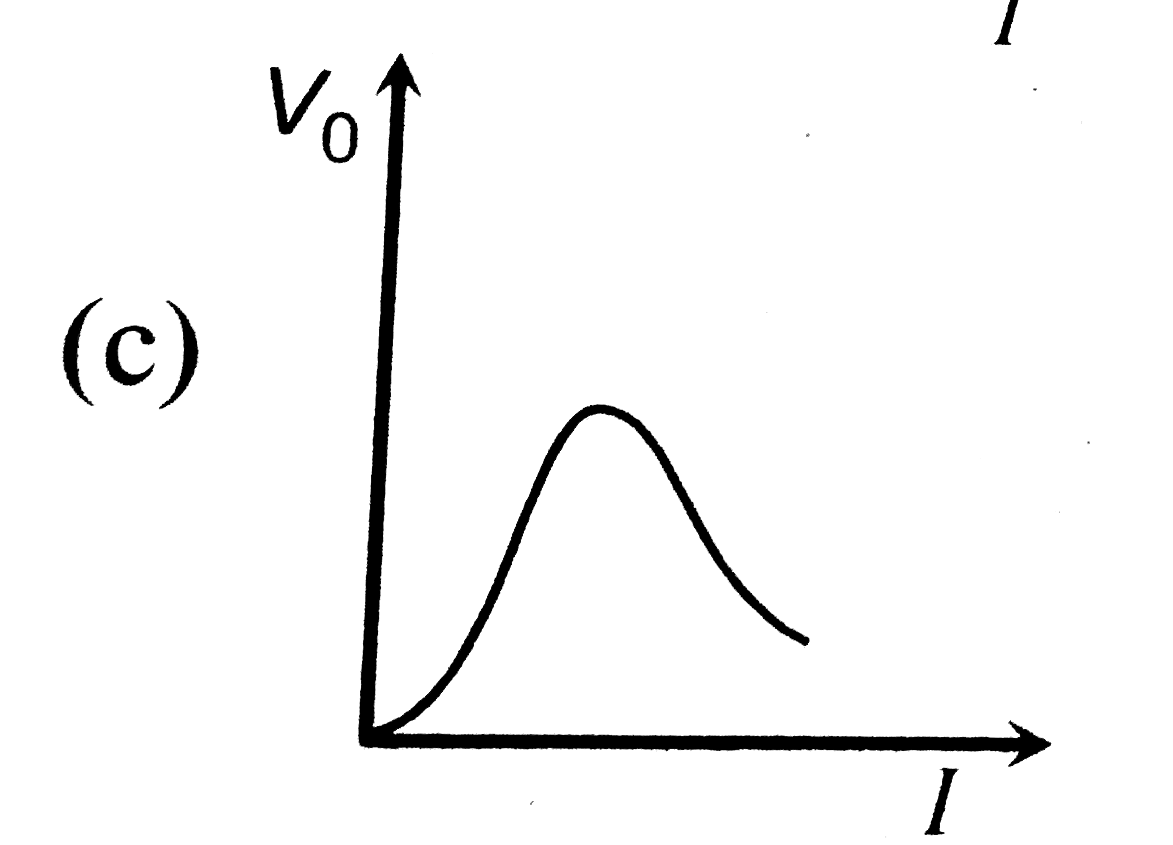
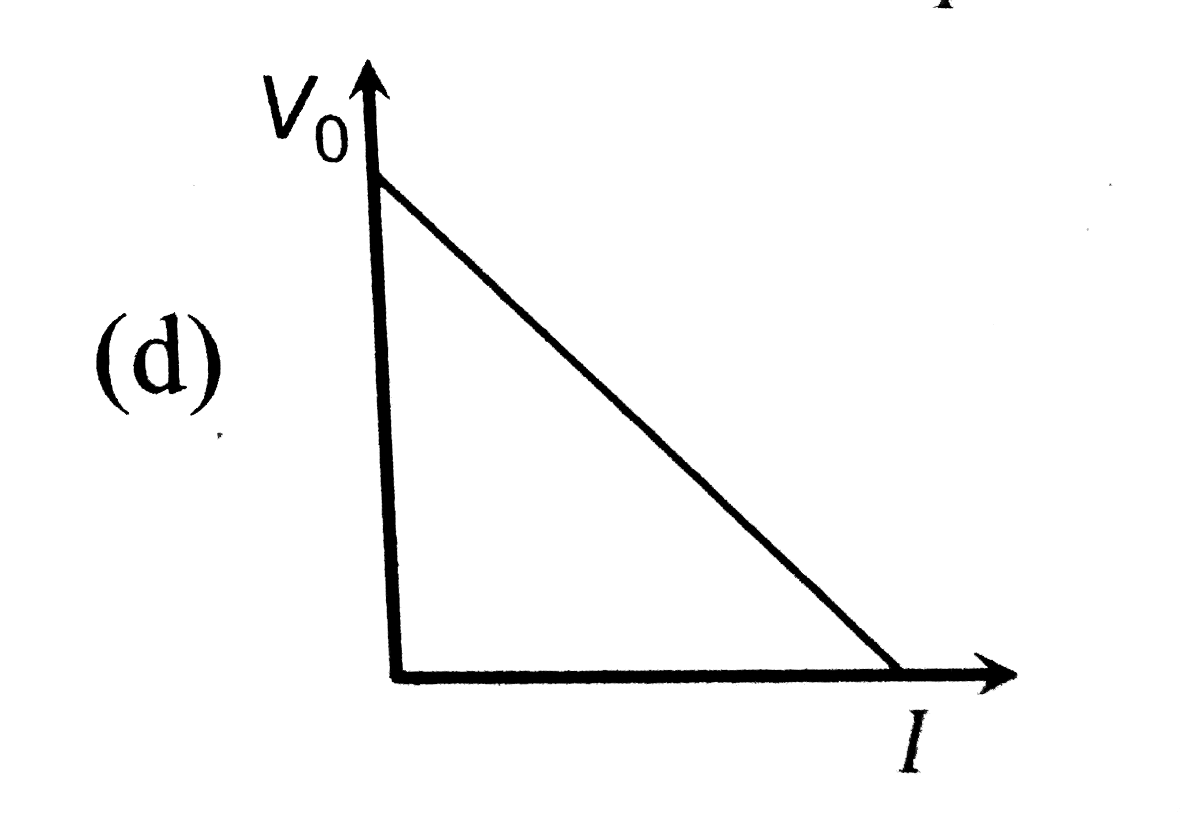
The correct Answer is:B
To analyze the relationship between the stopping potential (V) and the intensity of incident light (I), we can follow these steps:
1. Understanding Stopping Potential:
- Stopping potential (V) is the negative potential applied to stop the emitted photoelectrons from reaching the anode. It is related to the kinetic energy of the emitted electrons.
2. Einstein's Photoelectric Equation:
- According to Einstein's photoelectric equation, the energy of the emitted electrons can be expressed as:
Ek=hν−ϕ
where Ek is the kinetic energy of the emitted electrons, h is Planck's constant, ν is the frequency of the incident light, and ϕ is the work function of the material.
3. Relating Stopping Potential to Kinetic Energy:
- The kinetic energy of the emitted electrons is also related to the stopping potential:
Ek=eV
where e is the charge of the electron. Setting the two expressions for kinetic energy equal gives:
eV=hν−ϕ
Rearranging this gives:
V=hν−ϕe
4. Effect of Intensity on Photoelectric Effect:
- The intensity (I) of the incident light is proportional to the number of photons hitting the surface per unit time. Higher intensity means more photons, which can lead to more electrons being emitted, but does not affect the energy of individual photons.
5. Conclusion on the Relationship:
- The stopping potential (V) is dependent on the frequency of light (or wavelength) and the work function, but not directly on the intensity. Therefore, as the intensity increases, the number of emitted electrons increases (leading to a higher current), but the stopping potential remains constant for a given frequency of light.
6. Graphical Representation:
- When plotting the stopping potential (V) against the intensity (I), the graph will show that the stopping potential remains constant as the intensity increases. This indicates that the stopping potential does not change with intensity, leading to a horizontal line on the graph.
Final Answer:
The correct curve between the stopping potential (V) and the intensity of incident light (I) is a horizontal line, indicating that stopping potential is independent of intensity.
- Stopping potential (V) is the negative potential applied to stop the emitted photoelectrons from reaching the anode. It is related to the kinetic energy of the emitted electrons.
- According to Einstein's photoelectric equation, the energy of the emitted electrons can be expressed as:
Ek=hν−ϕ
where Ek is the kinetic energy of the emitted electrons, h is Planck's constant, ν is the frequency of the incident light, and ϕ is the work function of the material.
- The kinetic energy of the emitted electrons is also related to the stopping potential:
Ek=eV
where e is the charge of the electron. Setting the two expressions for kinetic energy equal gives:
eV=hν−ϕ
Rearranging this gives:
V=hν−ϕe
- The intensity (I) of the incident light is proportional to the number of photons hitting the surface per unit time. Higher intensity means more photons, which can lead to more electrons being emitted, but does not affect the energy of individual photons.
- The stopping potential (V) is dependent on the frequency of light (or wavelength) and the work function, but not directly on the intensity. Therefore, as the intensity increases, the number of emitted electrons increases (leading to a higher current), but the stopping potential remains constant for a given frequency of light.
- When plotting the stopping potential (V) against the intensity (I), the graph will show that the stopping potential remains constant as the intensity increases. This indicates that the stopping potential does not change with intensity, leading to a horizontal line on the graph.
The correct curve between the stopping potential (V) and the intensity of incident light (I) is a horizontal line, indicating that stopping potential is independent of intensity.
Topper's Solved these Questions
- BOOK - A2ZCHAPTER - DUAL NATURE OF RADIATION AND MATTEREXERCISE - Section B - Assertion Reasoning18videos
DUAL NATURE OF RADIATION AND MATTER
- BOOK - A2ZCHAPTER - DUAL NATURE OF RADIATION AND MATTEREXERCISE - AIPMT/NEET Questions46videos
DUAL NATURE OF RADIATION AND MATTER
- BOOK - A2ZCHAPTER - DUAL NATURE OF RADIATION AND MATTEREXERCISE - X-Rays45videos
DUAL NATURE OF RADIATION AND MATTER
- BOOK - A2ZCHAPTER - CURRENT ELECTRICITYEXERCISE - Section D - Chapter End Test29videos
CURRENT ELECTRICITY
- BOOK - A2ZCHAPTER - ELECTRIC CHARGE, FIELD & FLUXEXERCISE - Section D - Chapter End Test29videos
ELECTRIC CHARGE, FIELD & FLUX
Similar Questions
Knowledge Check
- Question 1 - Select One
As the intensity of incident light increases
APhotoelectric current increasesBPhotoelectric current decreasesCKinetic energy of emitted photoelectrons increasesDKinetic energy of emitted photoelectrons decreases - Question 2 - Select One
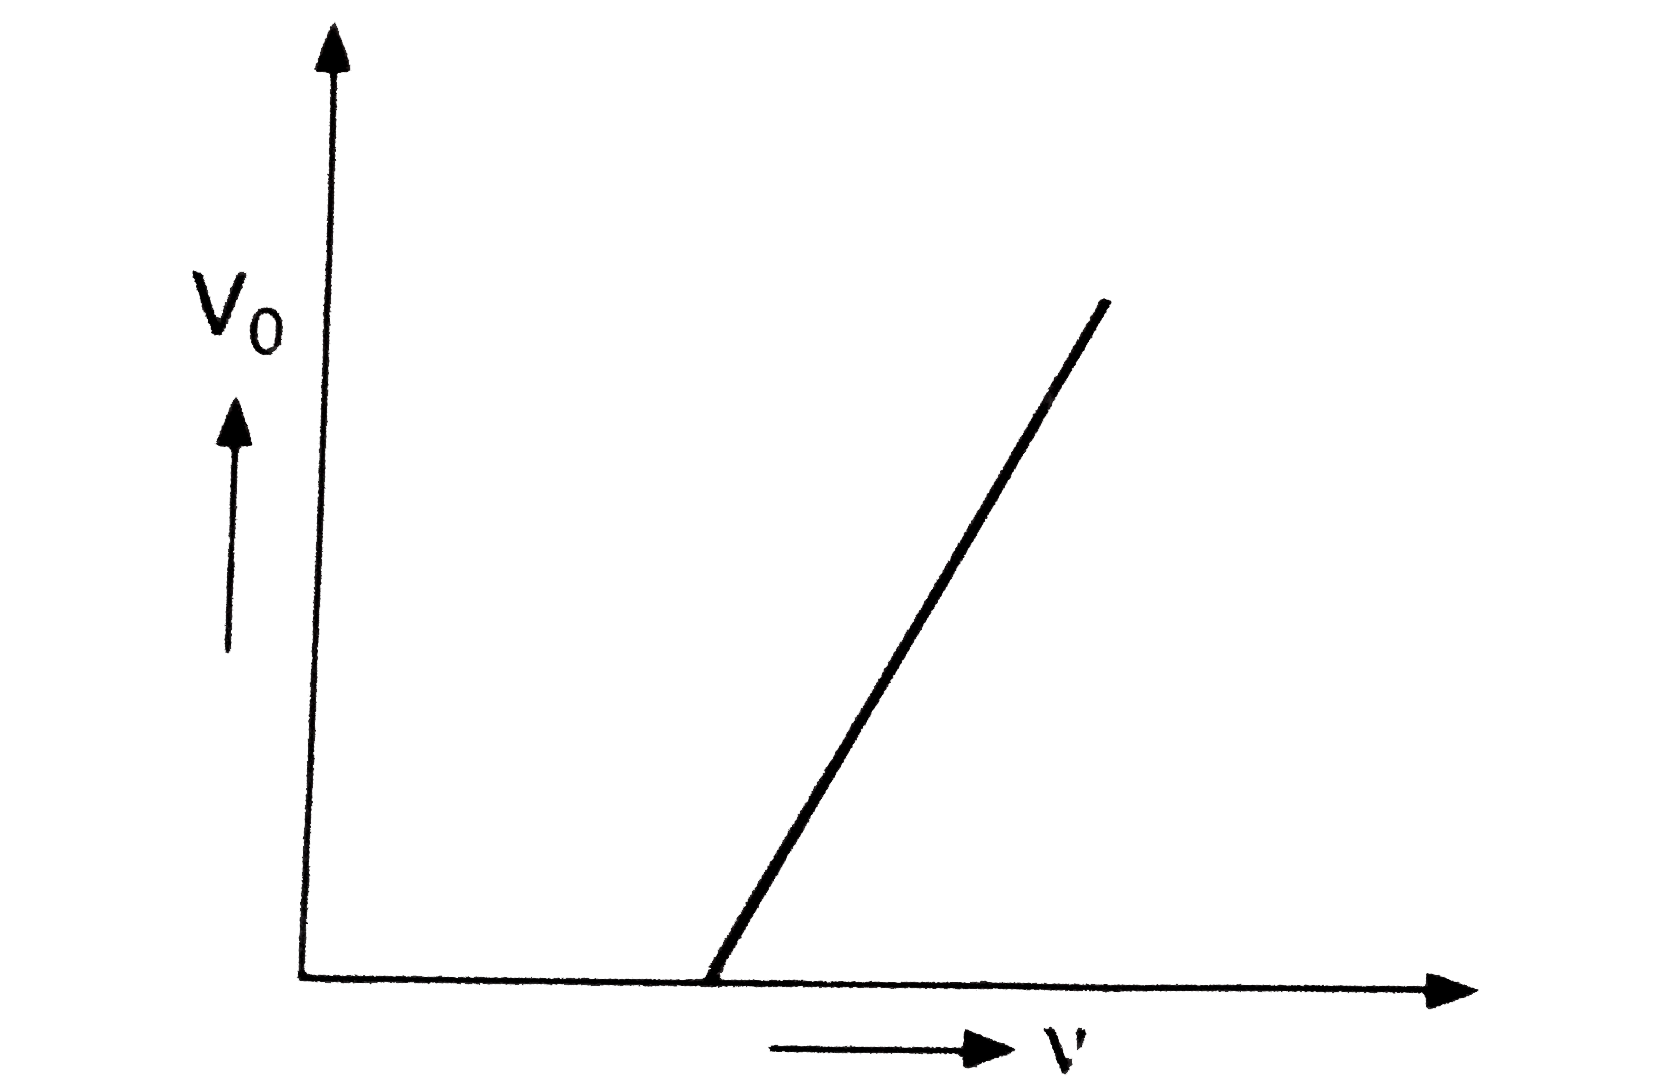
In photoelectric effect the slope of straight line graph between stopping potential (V0) and freqency of incident light (v) gives:
 Acharge on electronBwork function of emitterCPlanck's constantDratio of Planck's constant to charge on electron
 - Question 3 - Select One
The figure showing the correct relationship between the stopping potential V and the frequency v of the light for potassium and tungsten is
A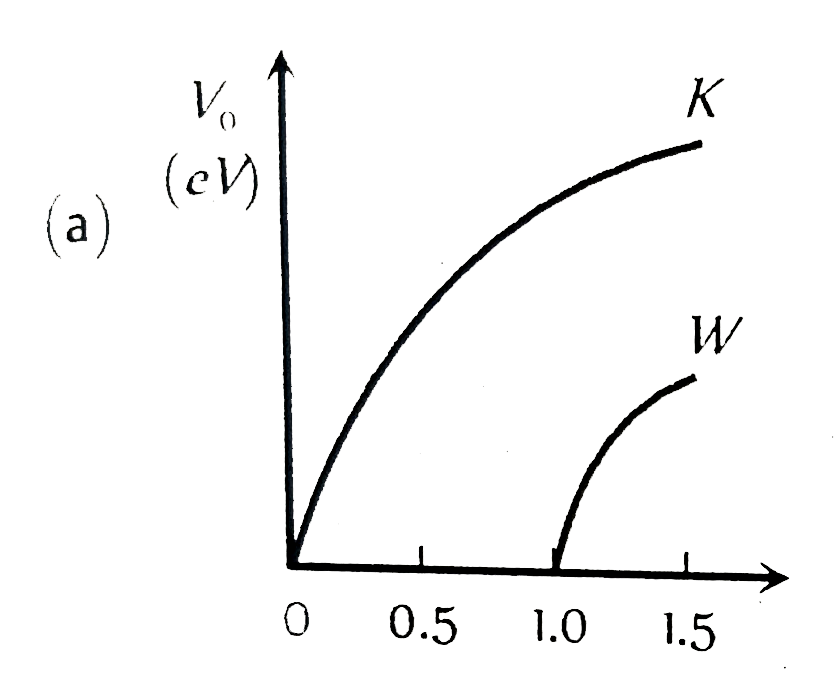 B
B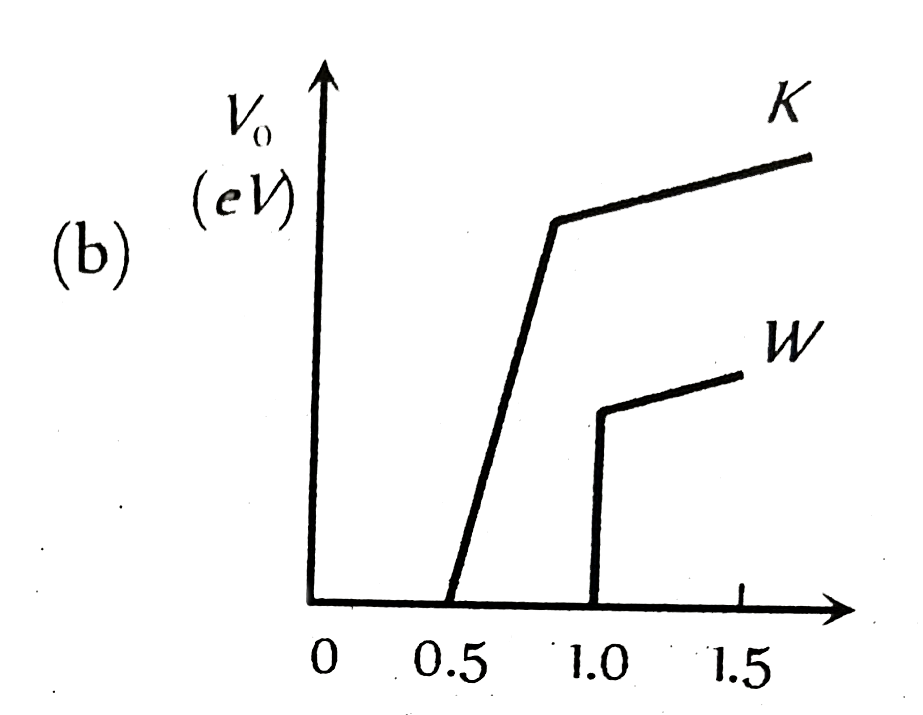 C
C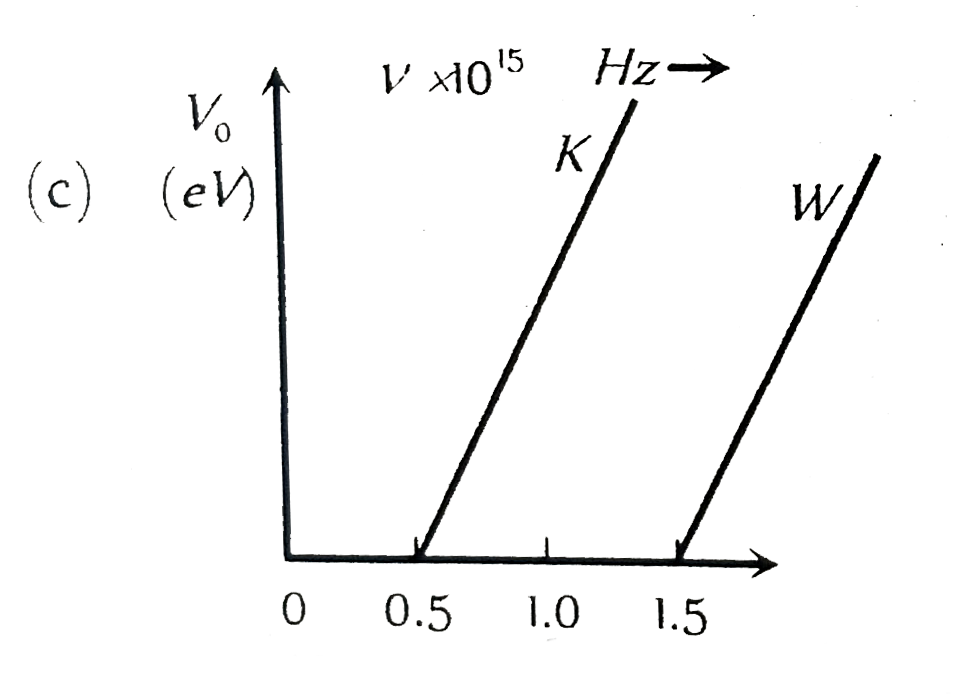 D
D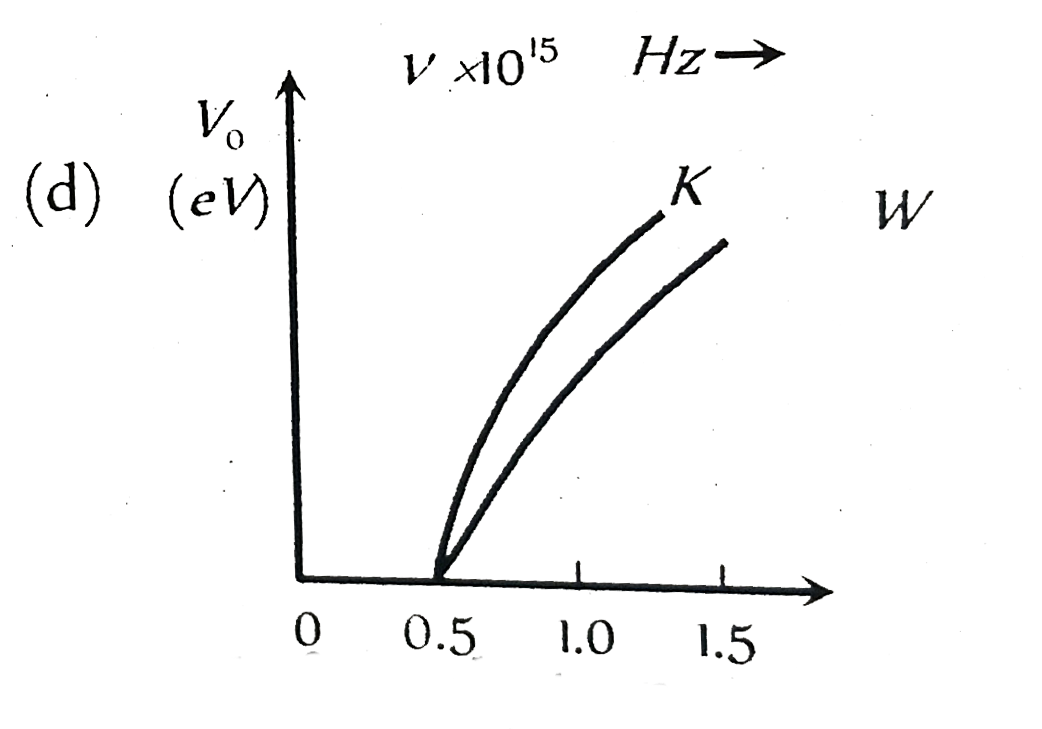
Of the following statement about the photoelectric effect, which are true and which are false?
(a) The greater the frequency of the incident light is, the greater is the stopping potential.
(b) The greater the intensity of the incident light is, the greater is the cutoff frequency.
(c) The greater the work function of the target material is, the greater is the stopping potential.
(d) The greater the work function of the target material is, the greater is the cutoff frequency.
(e) The greater the frequency of the incident light is, the greater is the maximum kinetic energy of the ejected electrons.
(f) The greater the energy of the photons is, the smaller is the stopping potential.View SolutionChoose the graph showing the correct relationship between the stopping potential V0 and the frequency v of light for potassium and tungsten.
View SolutionThe graph between stopping potential and intensity of light in photoelectric effect is
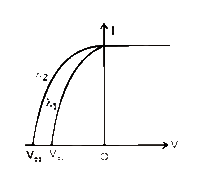
View SolutionIn the given diagram if V represent the stopping potential and wavelength of incident light is λ. If V2>V1 then
 View Solution
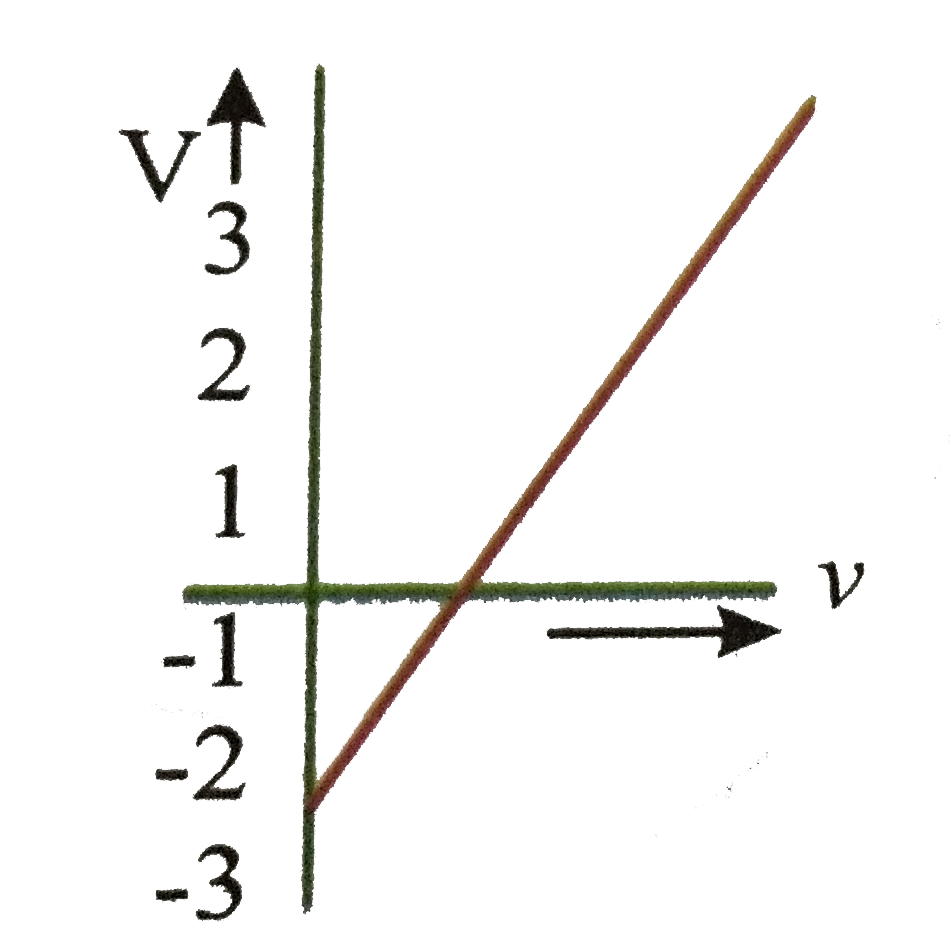
From the graph shown, the value of work function if the stopping potential (V), and frequency of the incident light vare on y and x-axes respectively is
 View Solution


