The correct graph representing the relation between energy (E) of the photoelectrons and frequency v of the incident light is :


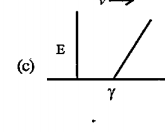

The correct Answer is:C
Similar Questions
The correct graph respectivley the relation between energy (E) of photoelectrons and frequency v of incident light is
View SolutionIn an experiment of photo-electric effect, the graph of maximum kinetic energy Ek of the emitted photoelectrons versus the frequency v of the incident light is a straight line AB as shown in figure below :
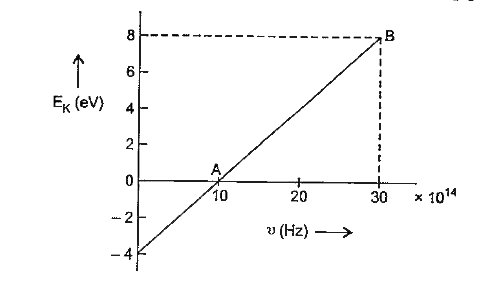
Threshold frequency of the metal.
View Solution
Knowledge Check
The correct graph respectivley the relation between energy (E) of photoelectrons and frequency v of incident light is
A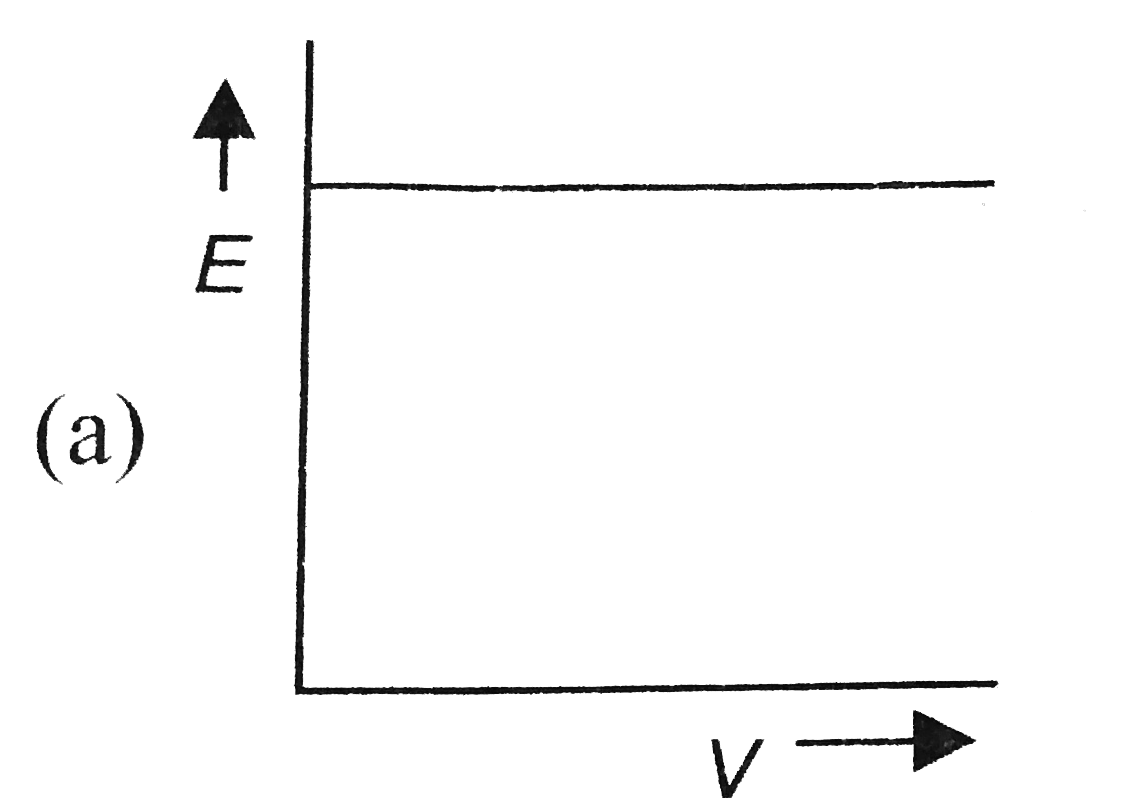 B
B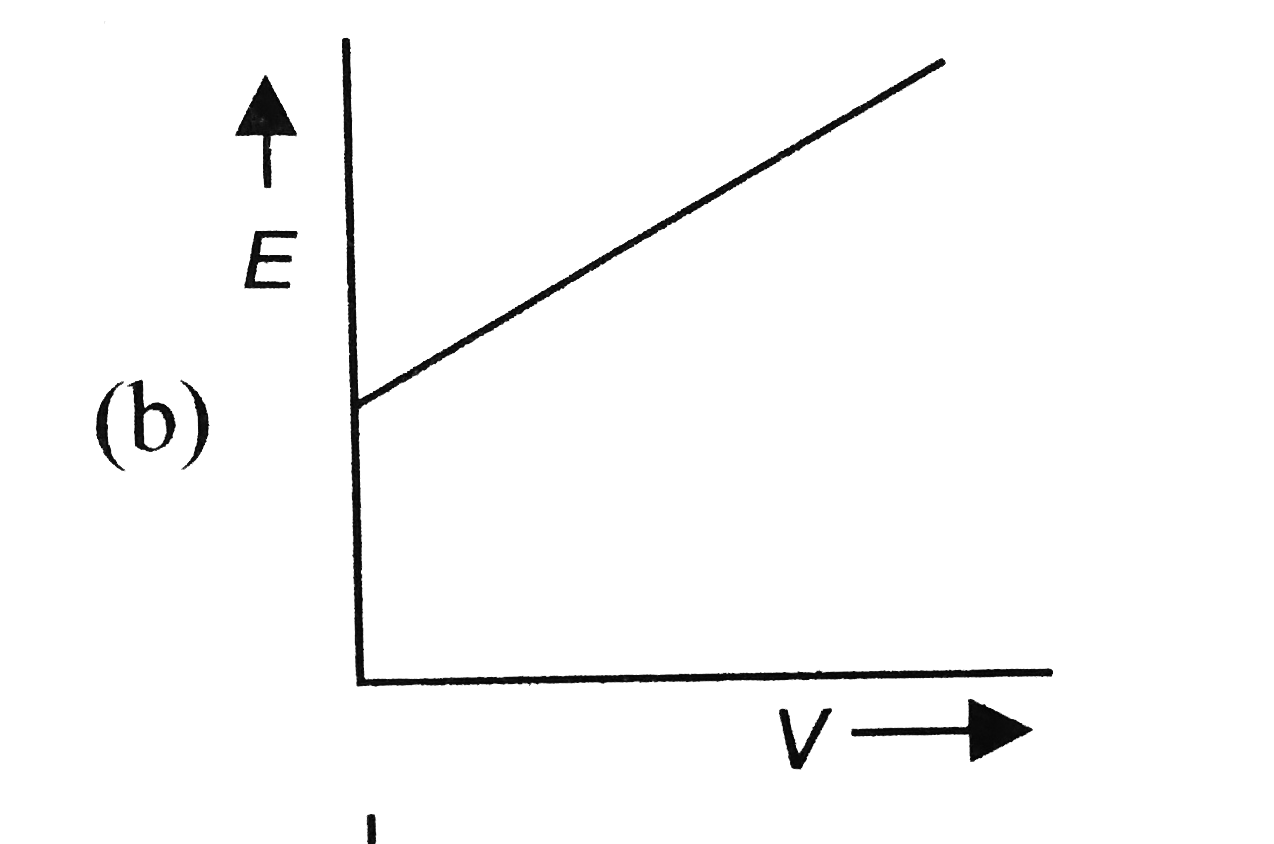 C
C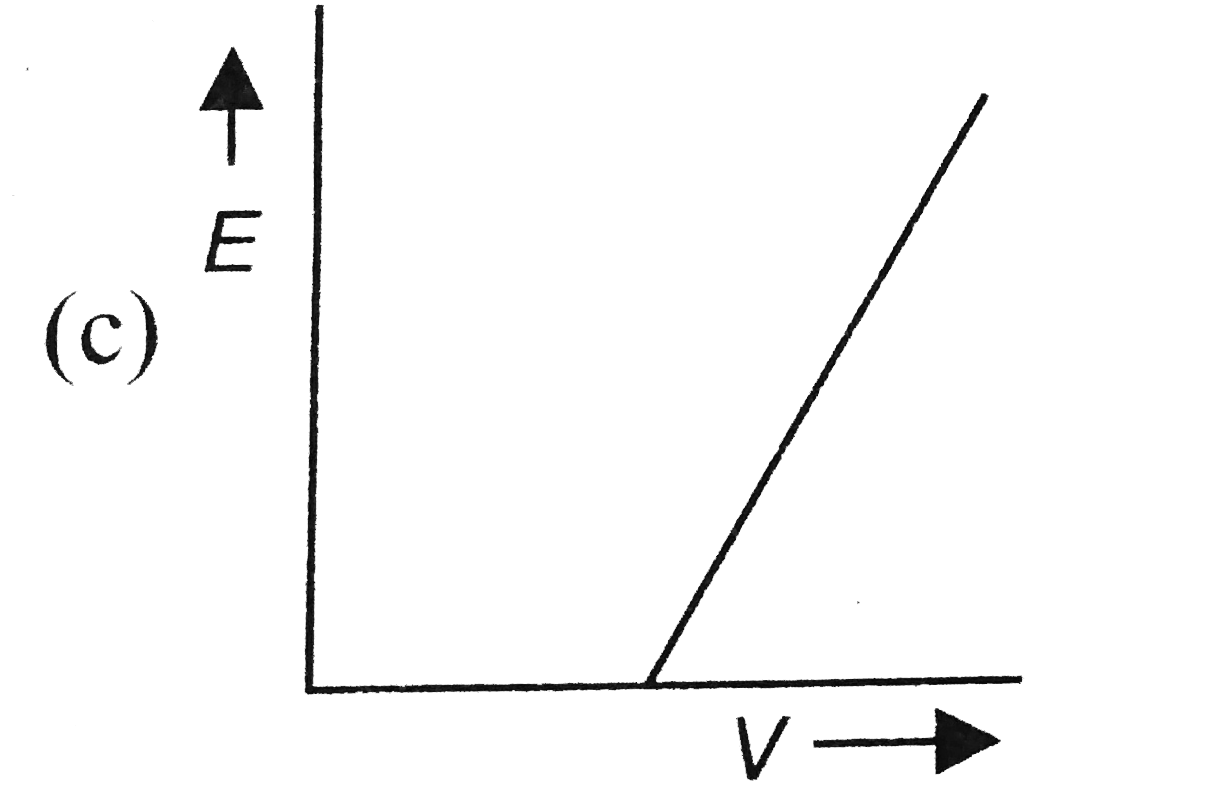 D
D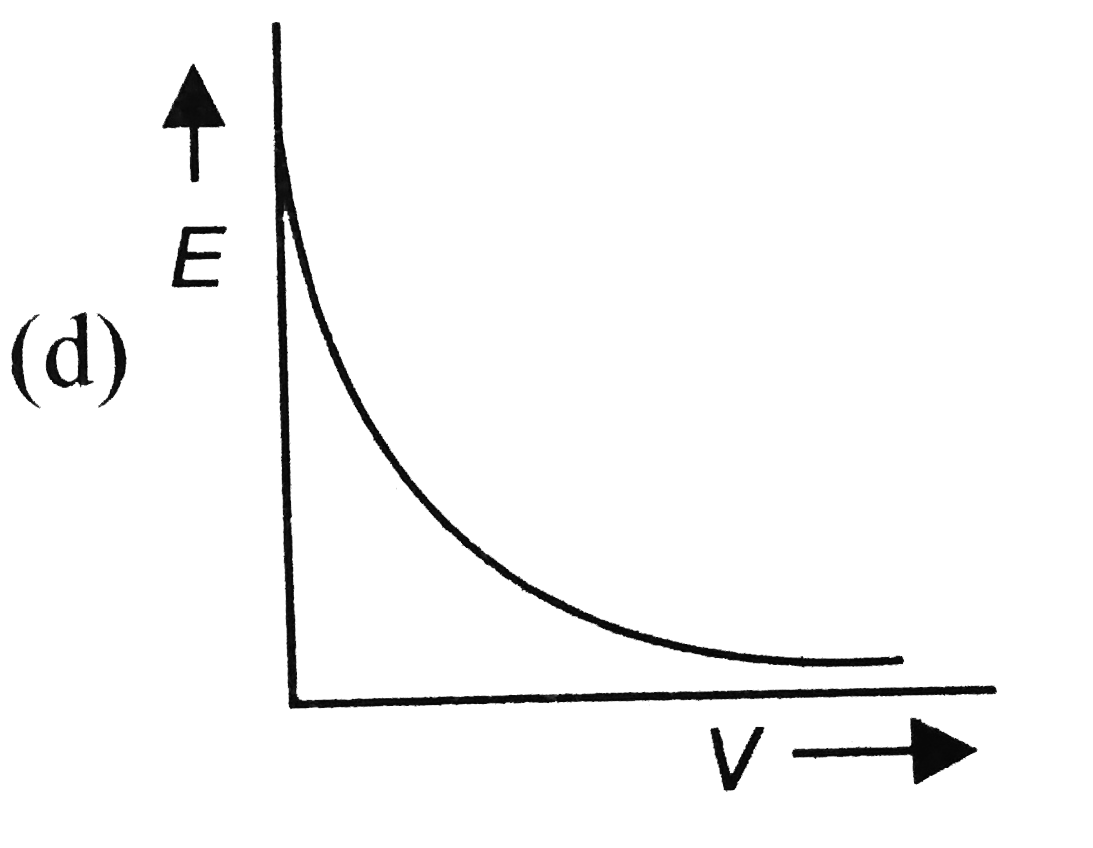
The maximu kinetic energy (Ek) of the photoelectron varies with frequency (v) of the incident light as shown by the curve:
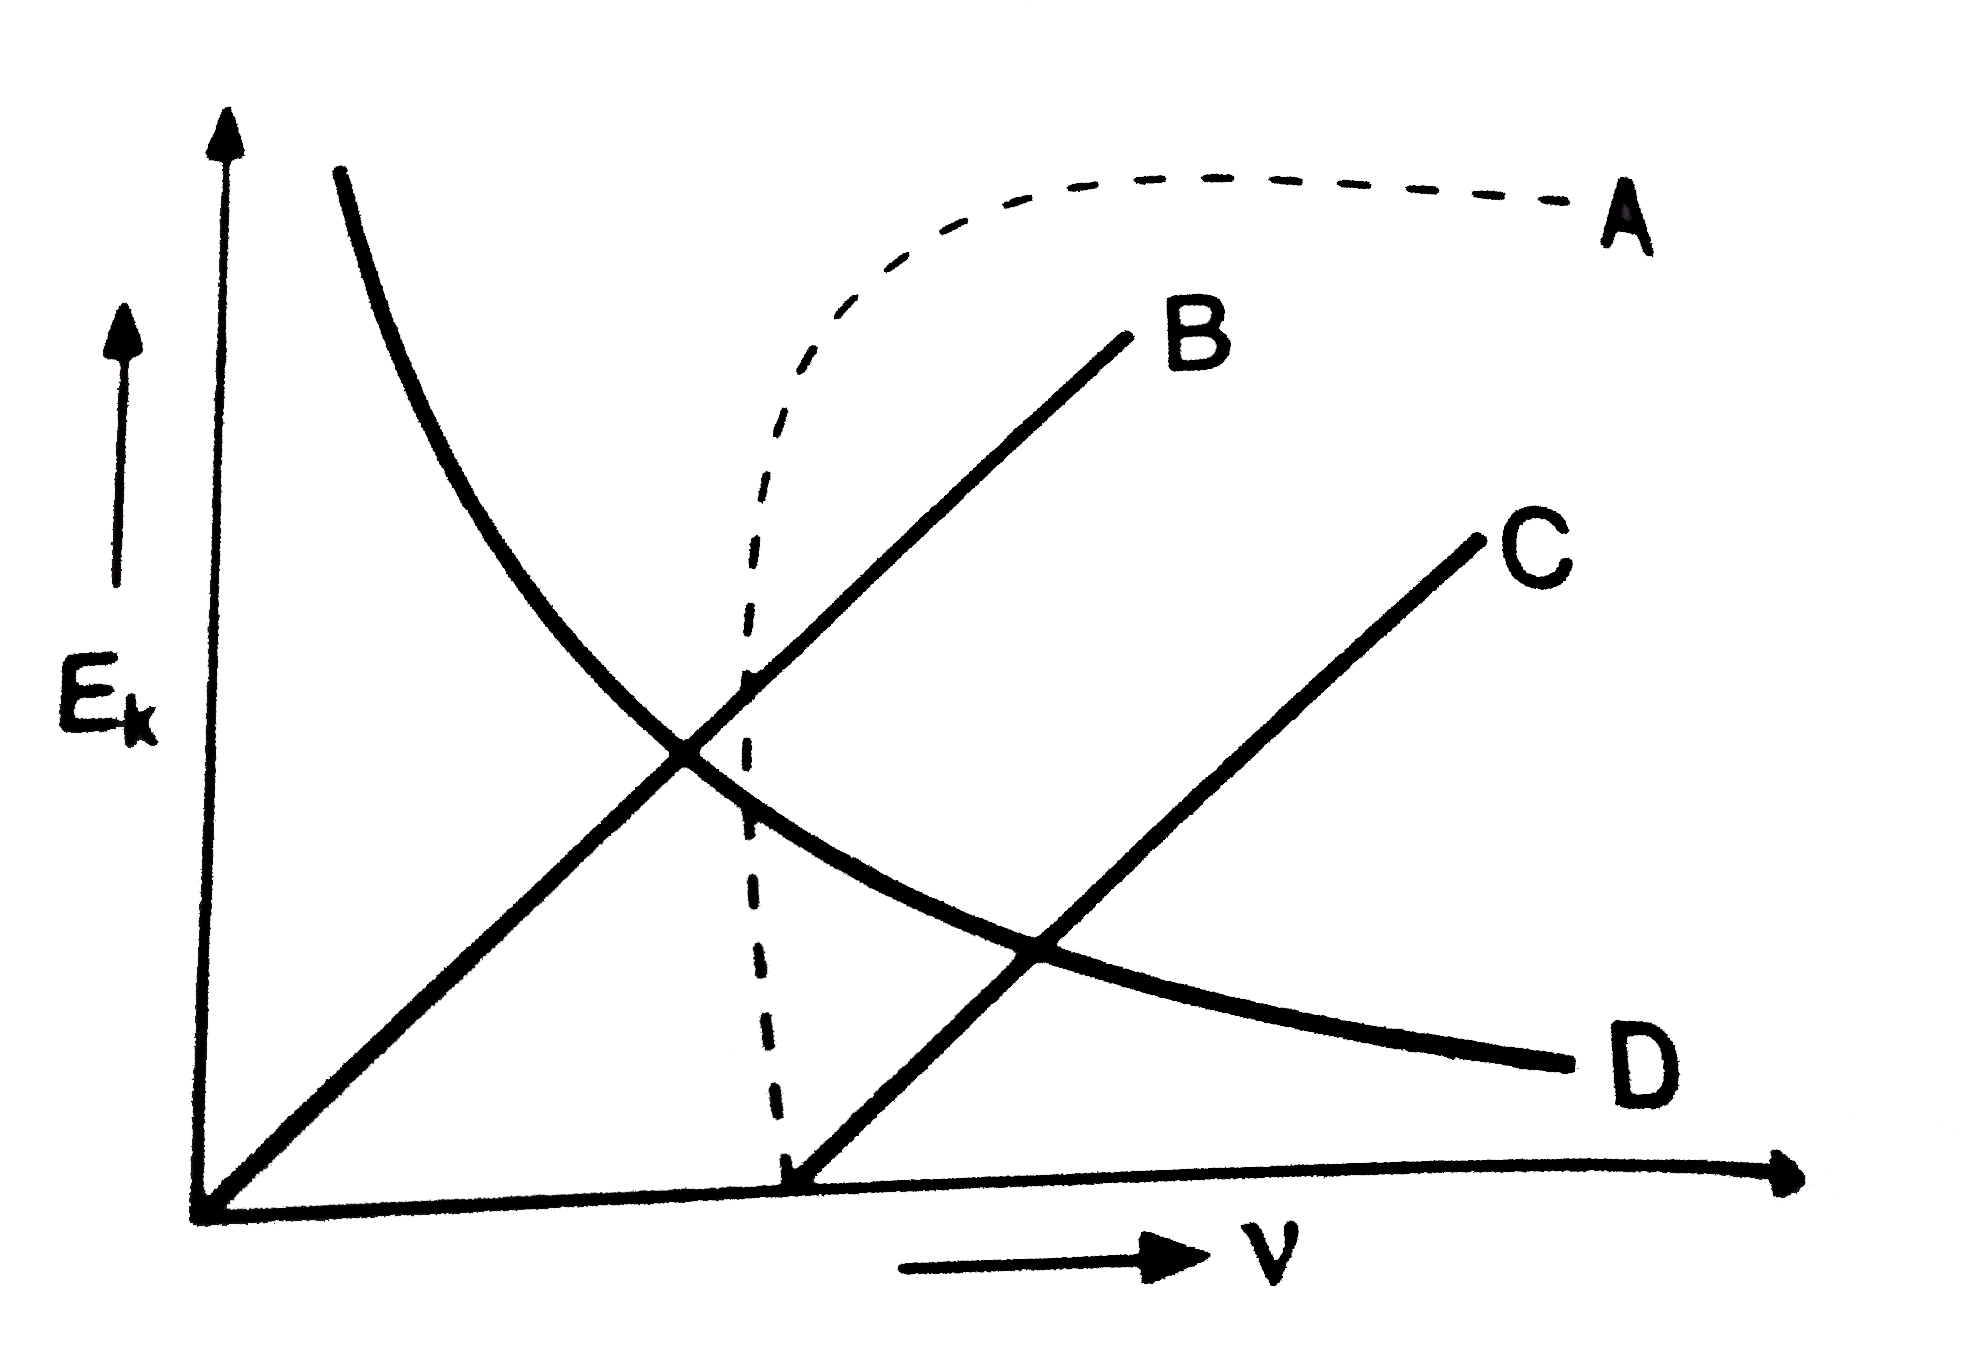 AABBCCDD
The graph between the energy of photoelectrons E and the wavelength of incident light (λ) is
A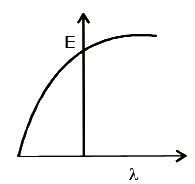 B
B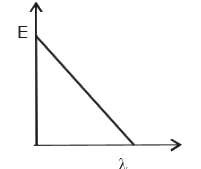 C
C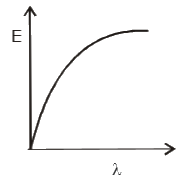 D
D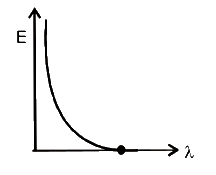
In an experiment of photo-electric effect, the graph of maximum kinetic energy Ek of the emitted photoelectrons versus the frequency v of the incident light is a straight line AB as shown in figure below :
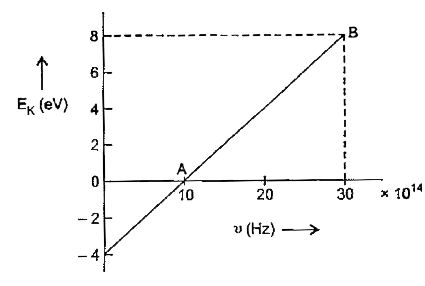
Stopping potential for the photoelectrons emitted by the light of frequency
v=30×1014Hz
View SolutionAccording to Einstein's photoelectric equation, the graph between kinetic energy of photoelectrons ejected and the frequency of the incident radiation is :
View SolutionAccording to Einstein's photoelectric equation, the graph between kinetic energy of photoelectrons ejected and the frequency of the incident radiation is :
View SolutionIn an experiment of photo-electric effect, the graph of maximum kinetic energy Ek of the emitted photoelectrons versus the frequency v of the incident light is a straight line AB as shown in figure below :
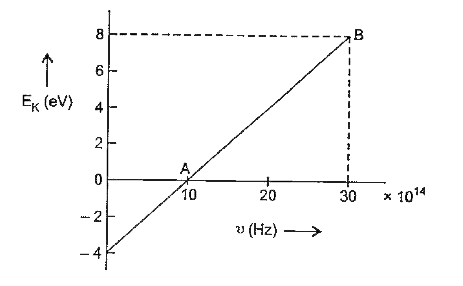
Work function of the metal.
View SolutionMaximum kinetic energy (Ek) of a photoelectron varies with the frequency (v) of the incident radiation as
View Solution
