The diagram shows the velocity-time graph for a particle moving in a straight line. The sum of the two shaded areas represents :
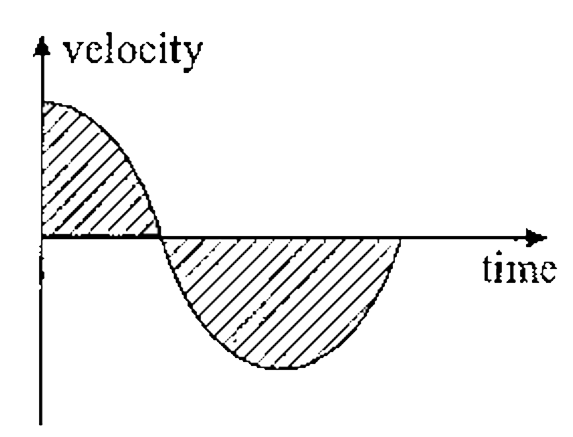
The increase in displacement of the particle
The average velocity of the particle
The average acceleration ofthe particle
The distance moved by the particle
The correct Answer is:D
Step by step video, text & image solution for The diagram shows the velocity-time graph for a particle moving in a straight line. The sum of the two shaded areas represents : by Physics experts to help you in doubts & scoring excellent marks in Class 11 exams.
Topper's Solved these Questions
- BOOK - PHYSICS GALAXY - ASHISH ARORACHAPTER - KINEMATICSEXERCISE - Numerical111videos
KINEMATICS
- BOOK - PHYSICS GALAXY - ASHISH ARORACHAPTER - KINEMATICSEXERCISE - Advance MCQs with One or More Options Correct17videos
KINEMATICS
- BOOK - PHYSICS GALAXY - ASHISH ARORACHAPTER - KINEMATICSEXERCISE - Discussion Question18videos
KINEMATICS
- BOOK - PHYSICS GALAXY - ASHISH ARORACHAPTER - GRAVITATIONEXERCISE - Unsolved Numerical94videos
GRAVITATION
- BOOK - PHYSICS GALAXY - ASHISH ARORACHAPTER - LINEAR MOMENTUM & ITS CONSERVATIONEXERCISE - exercise 1.33videos
LINEAR MOMENTUM & ITS CONSERVATION
Similar Questions
Knowledge Check
- Question 1 - Select One
The diagram shows a velocity-time graph for a car moving in a straight line. At point Q the car must be
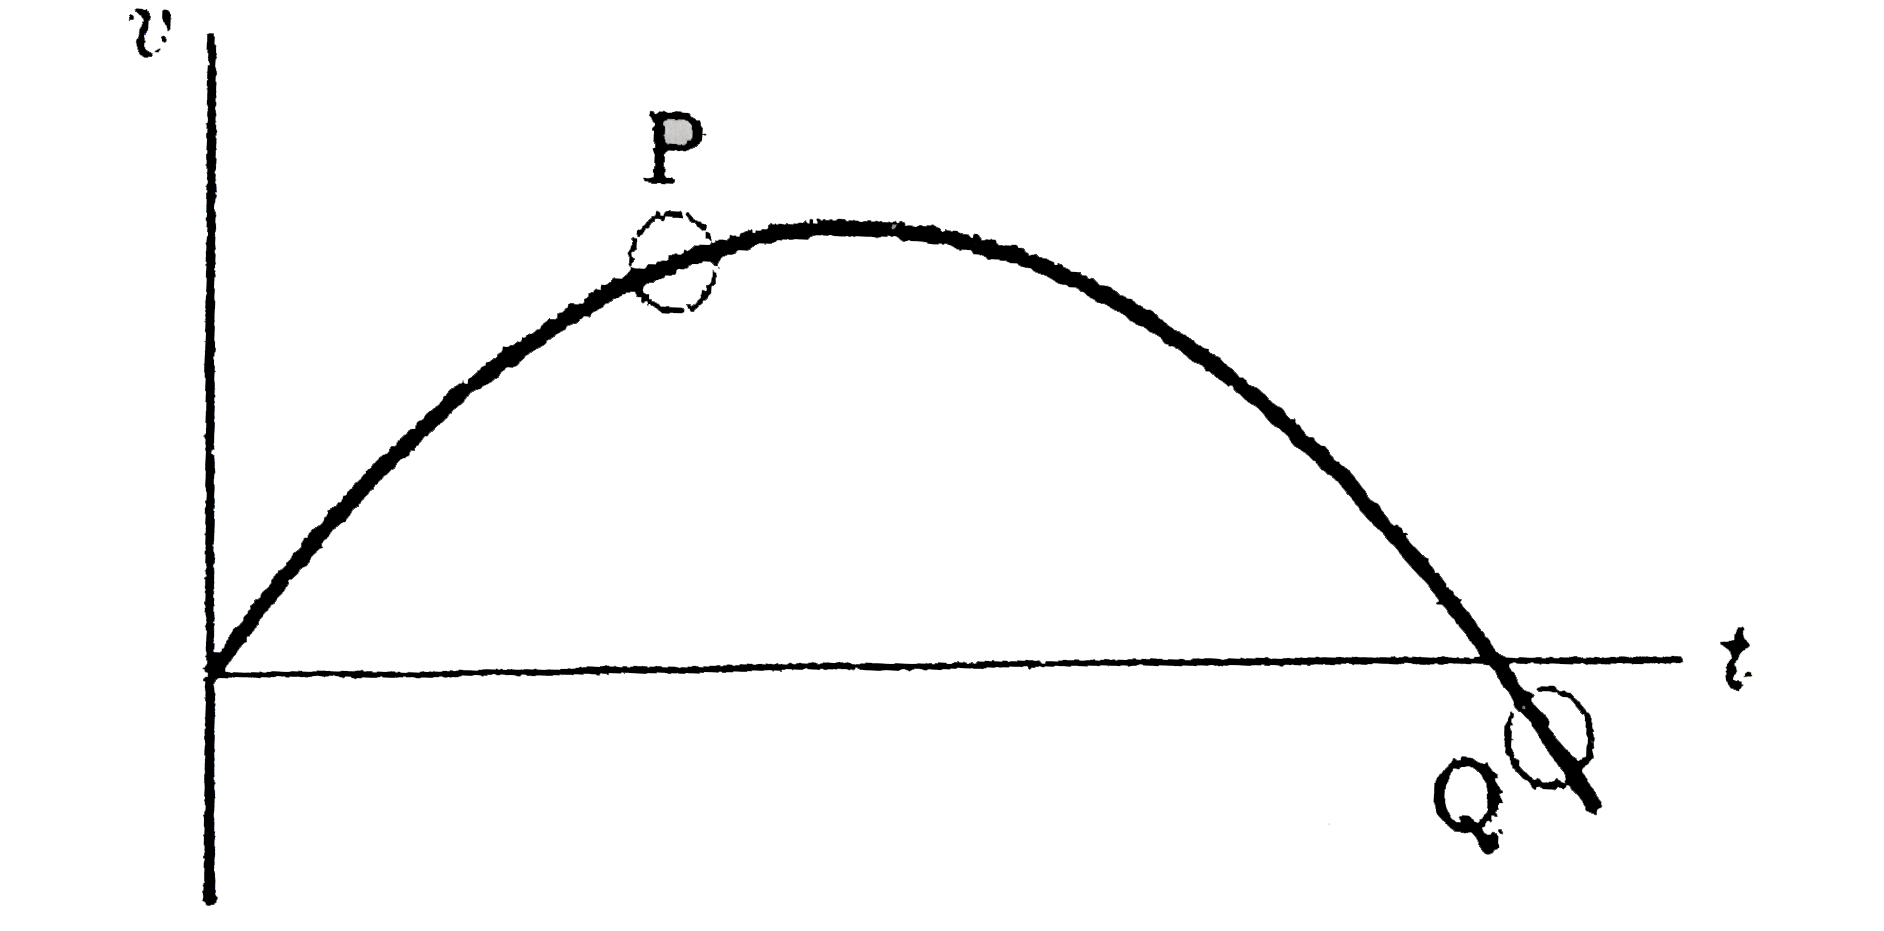 Amoving the with zero accelerationBtravelling in the reverse direction to that at point PCtraveling below ground -levelDmoving with decreasing speed.
 - Question 2 - Select One or More
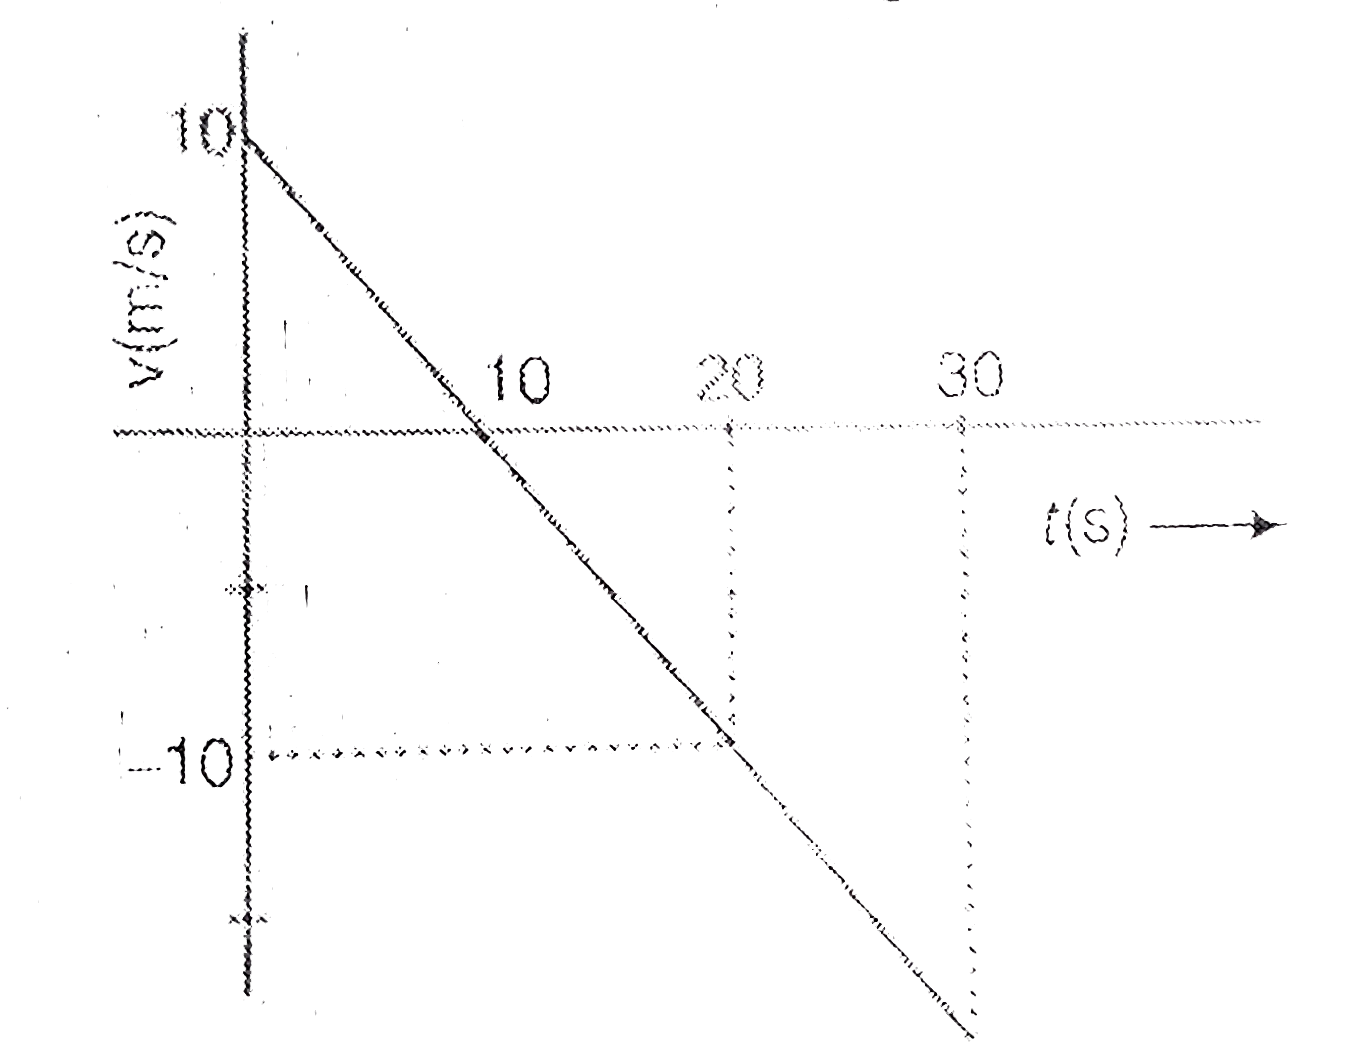
The velocity-time plot for a particle moving on a straight line is shown in figure.
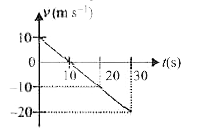 AThe particle has a constant acceleration.BThe particle has never tumed around.CThe particle has zero displacement.DThe average speed in the interval 0 to 10 s is the same as the average speed in the interval 10s to 20 s.
 - Question 3 - Select One
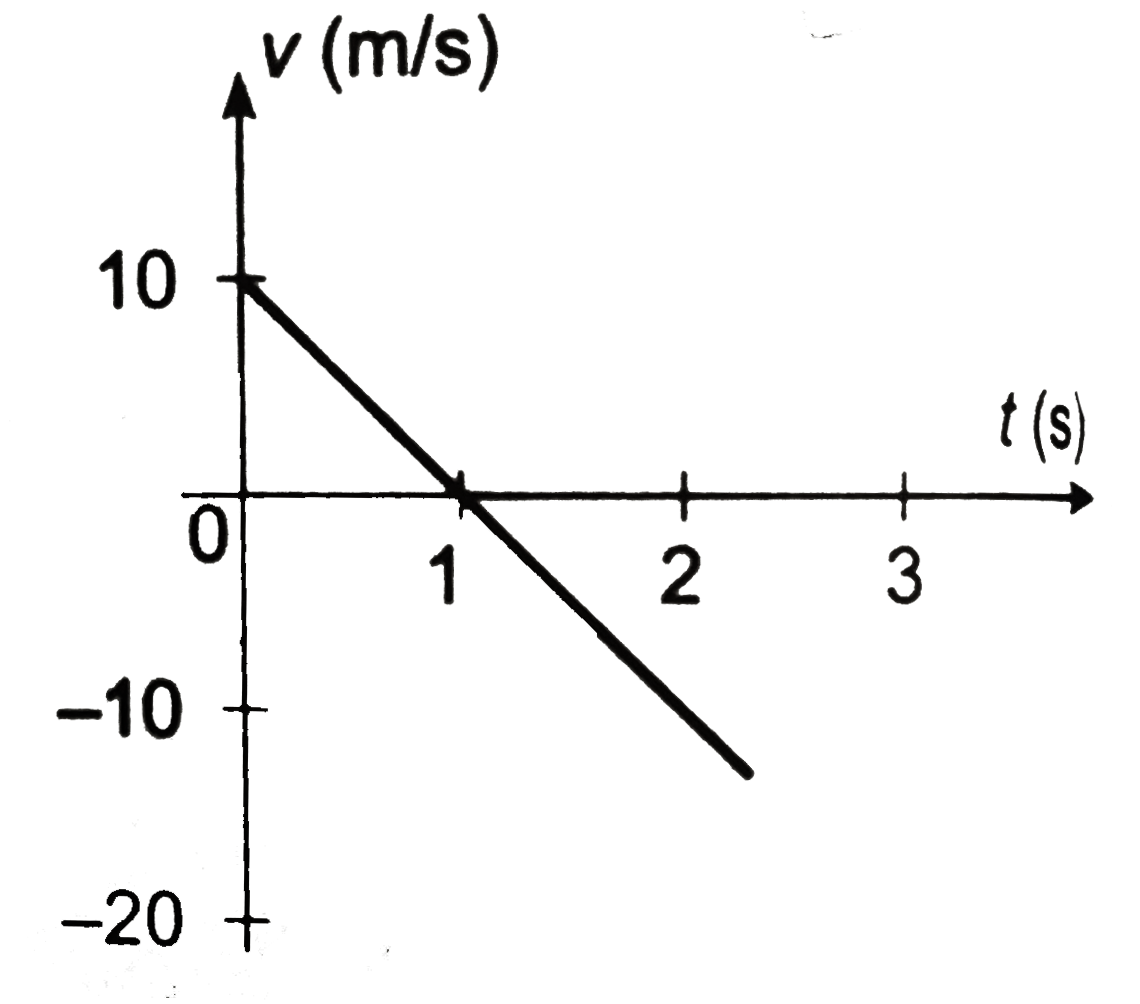
The velocity- time plot for a particle moving on a straight line is shown in the figure
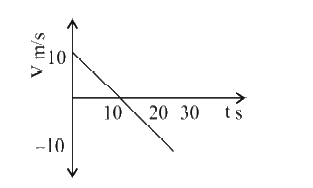 Athe particle has a non uniform accelerationBthe particle has never turned aroundCthe particle has zero displacementDthe average speed in the interval 0 to 10 s is the same as the average speed in the interval 10 s to 20 s
The velocity-time graph of a particle is not a straight line. Its acceleration is
View SolutionThe velocity-time graph of a body moving in a straight line is shown in the figure.
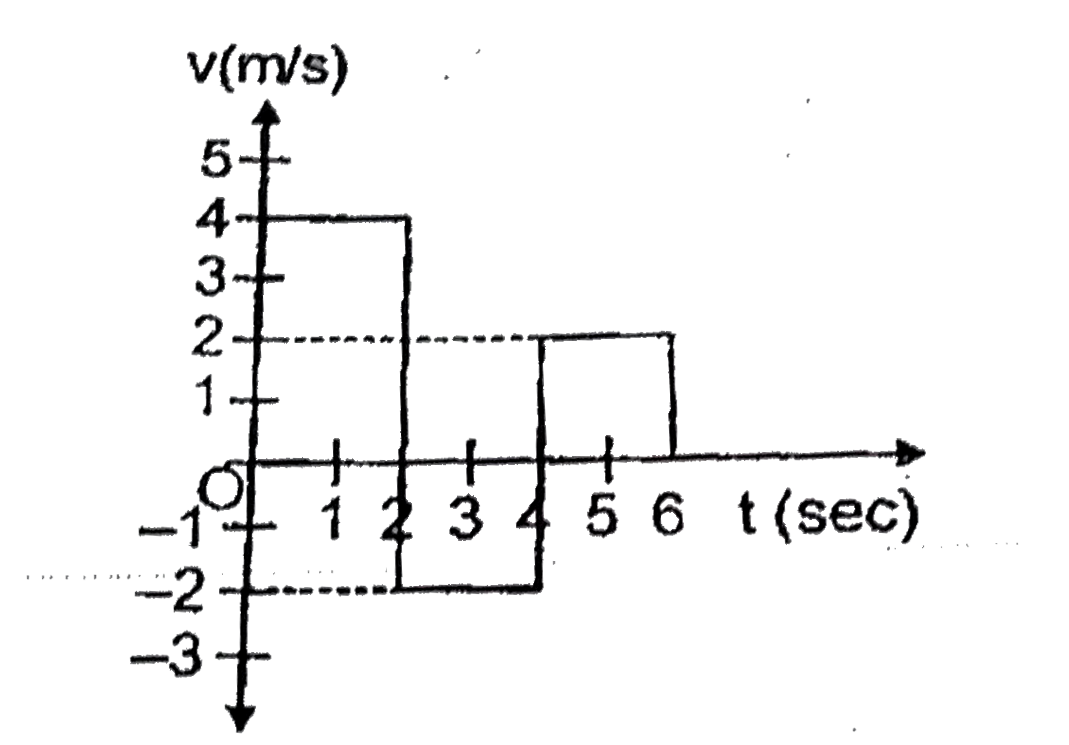 View Solution
The velocity time plot for a particle moving on straight line is shown in the figure.
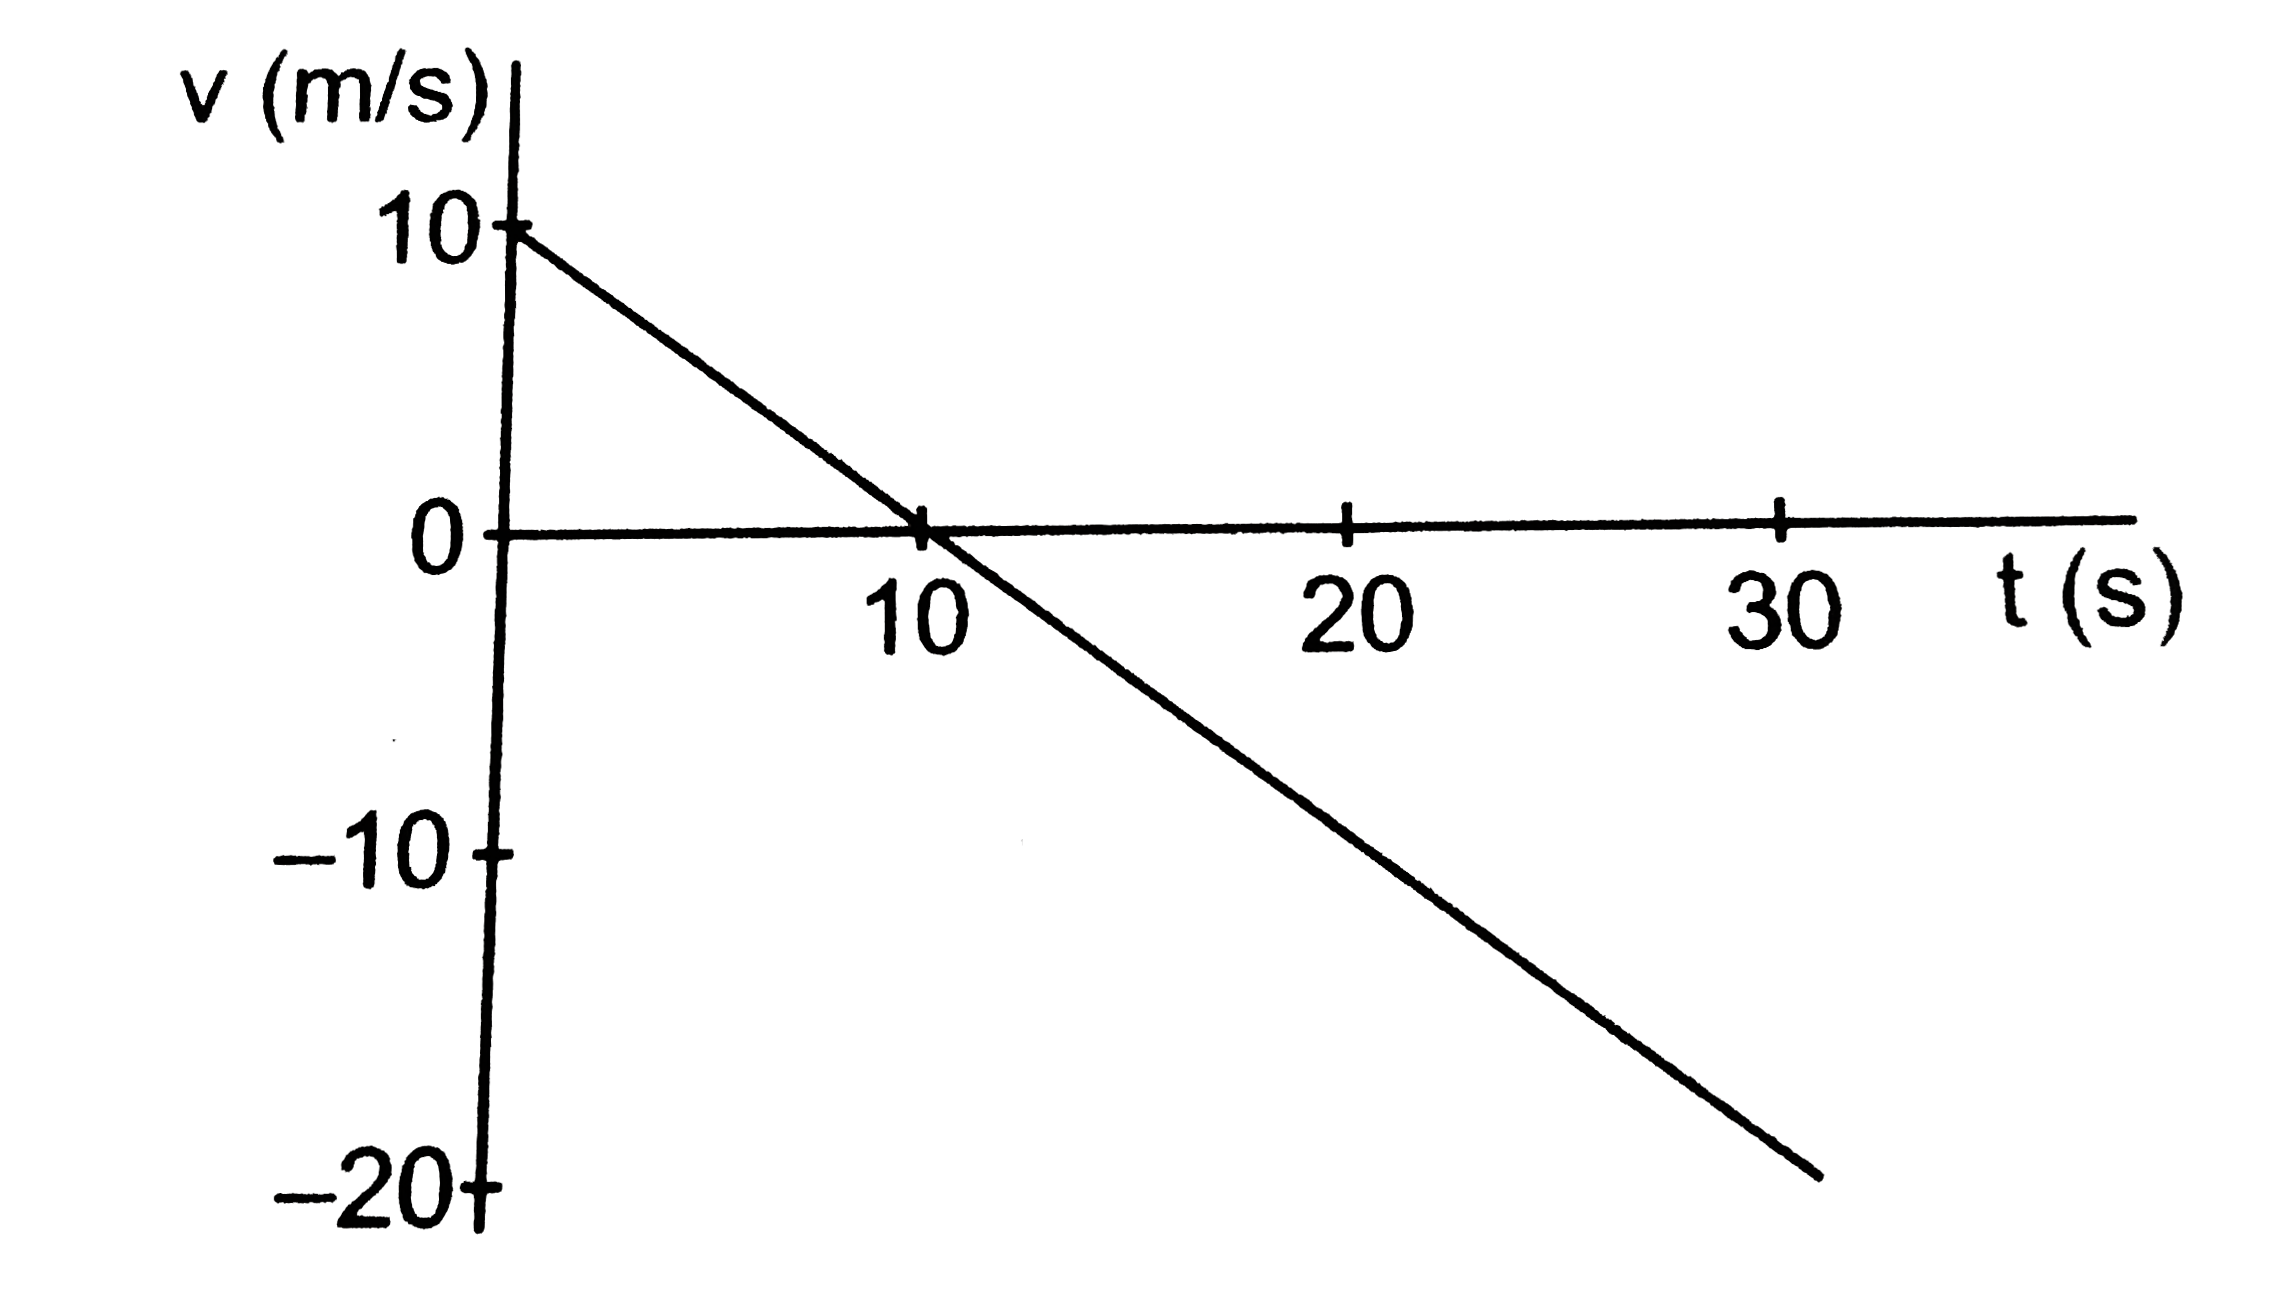 View Solution
The figure shows a velocity-time graph of a particle moving along a straight line
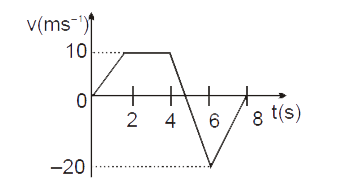
The maximum of displacement of the particle isView SolutionThe figure shows a velocity-time graph of a particle moving along a straight line
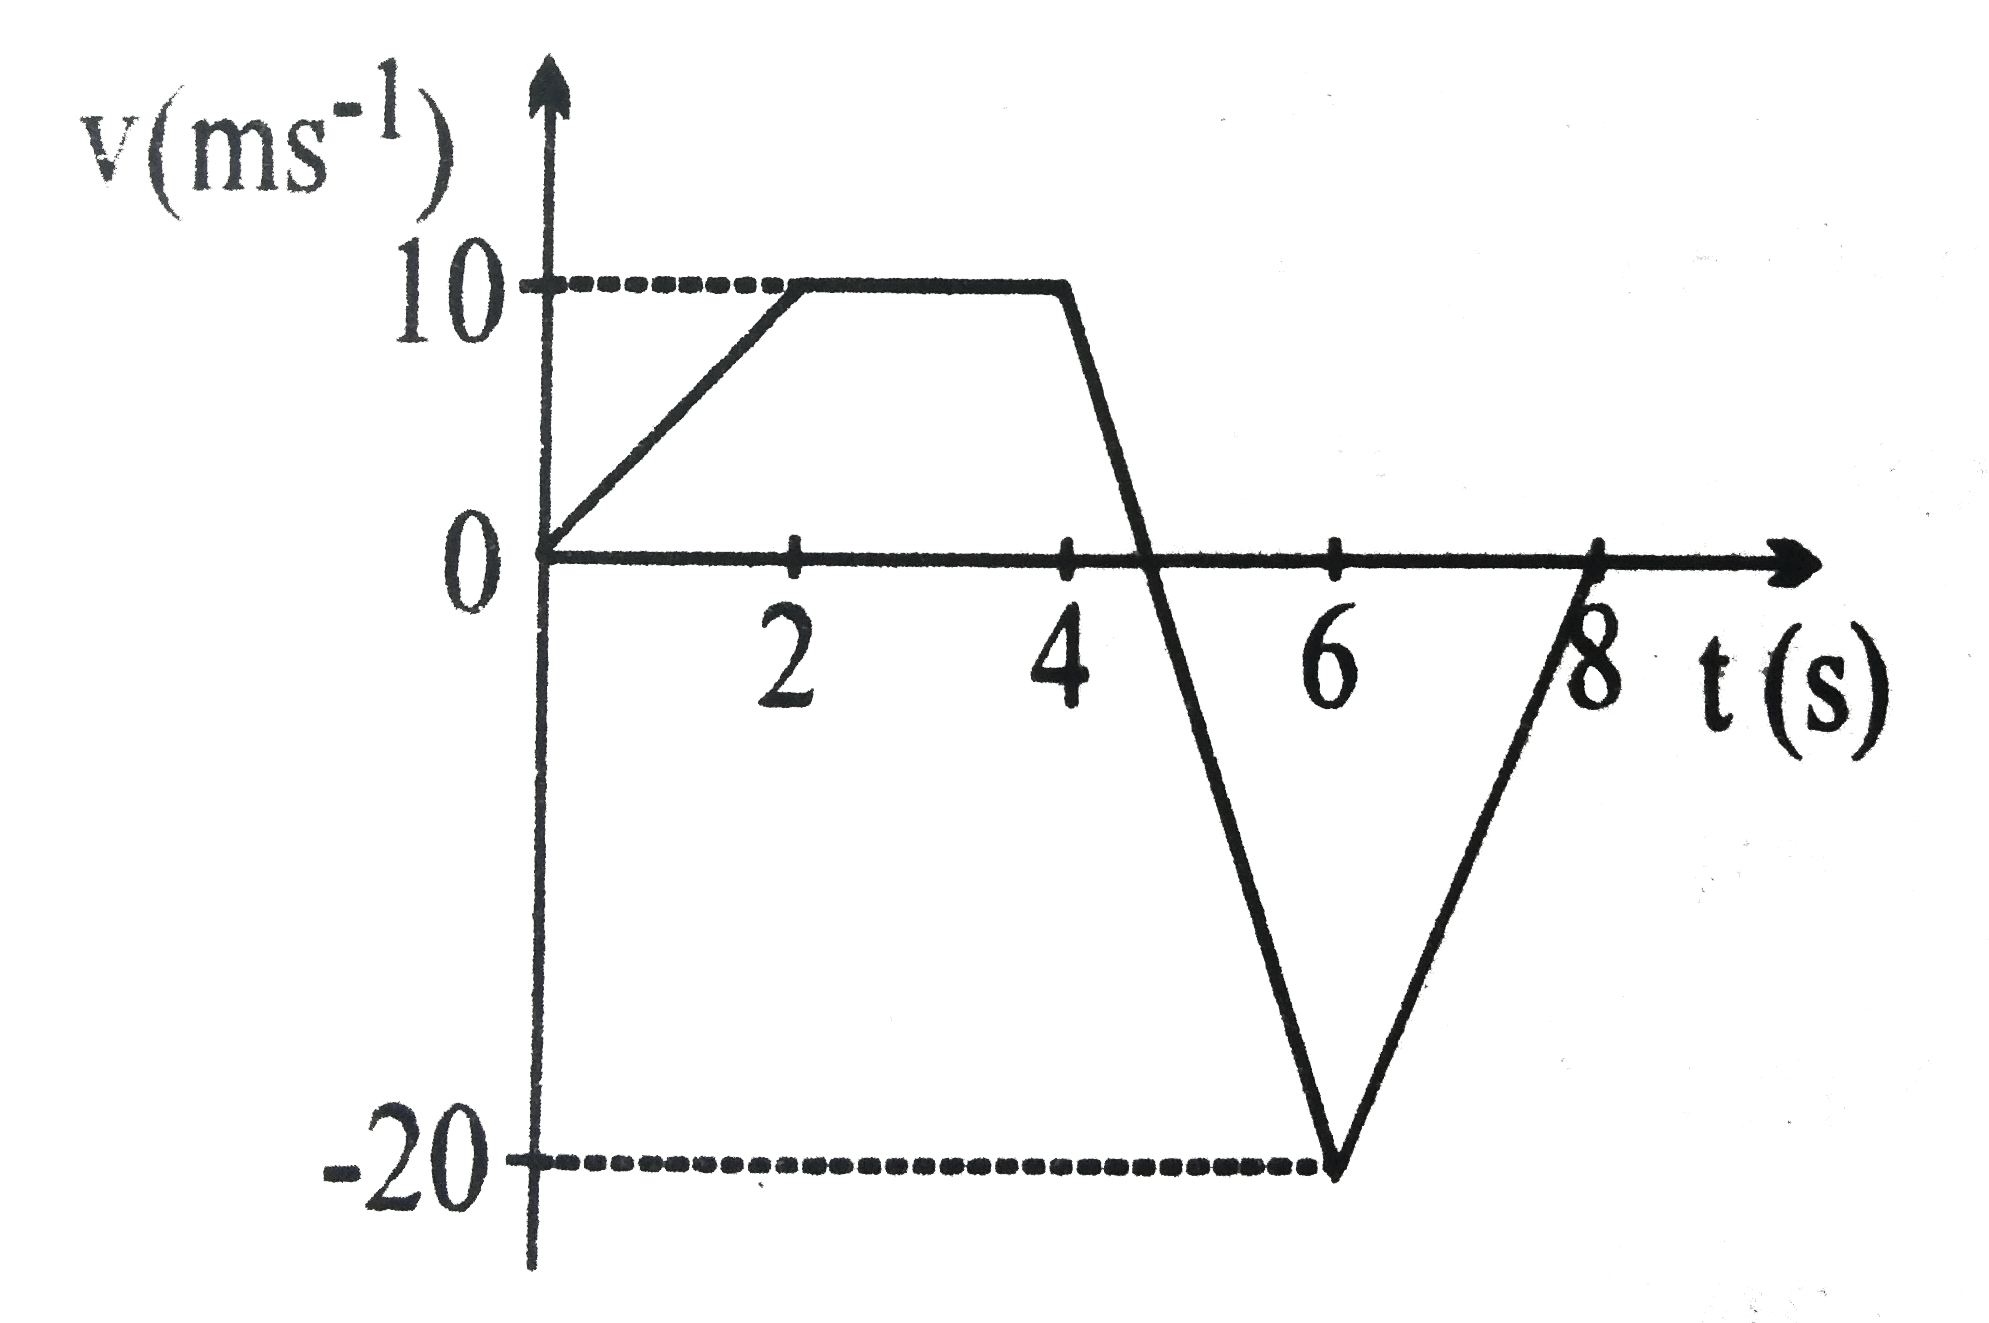
The maximum displacement of the particle isView Solution


