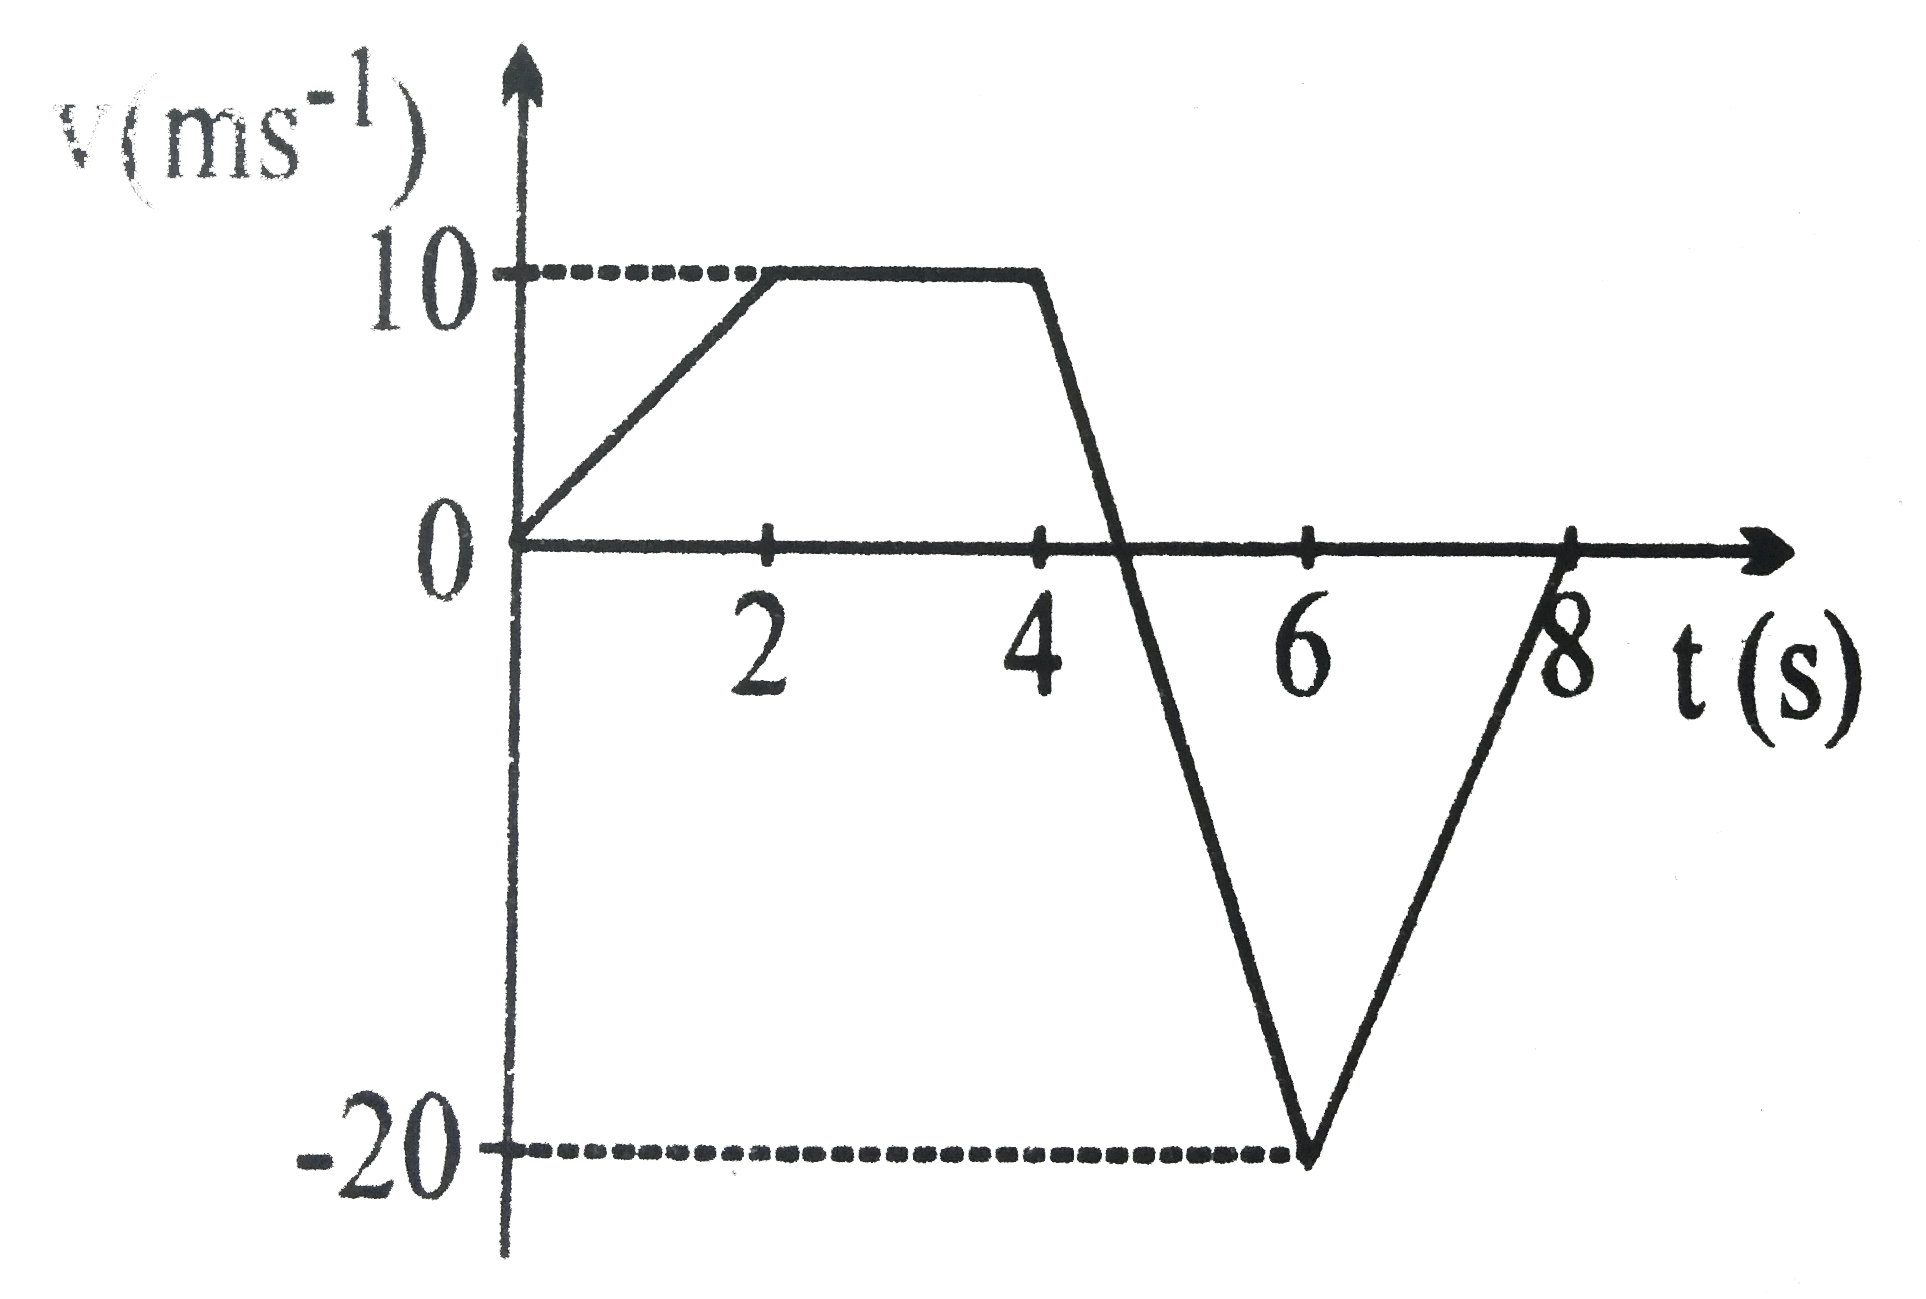
The figure shows velocity-time graph of a particle moving along a straight line. Identify the correct statement.
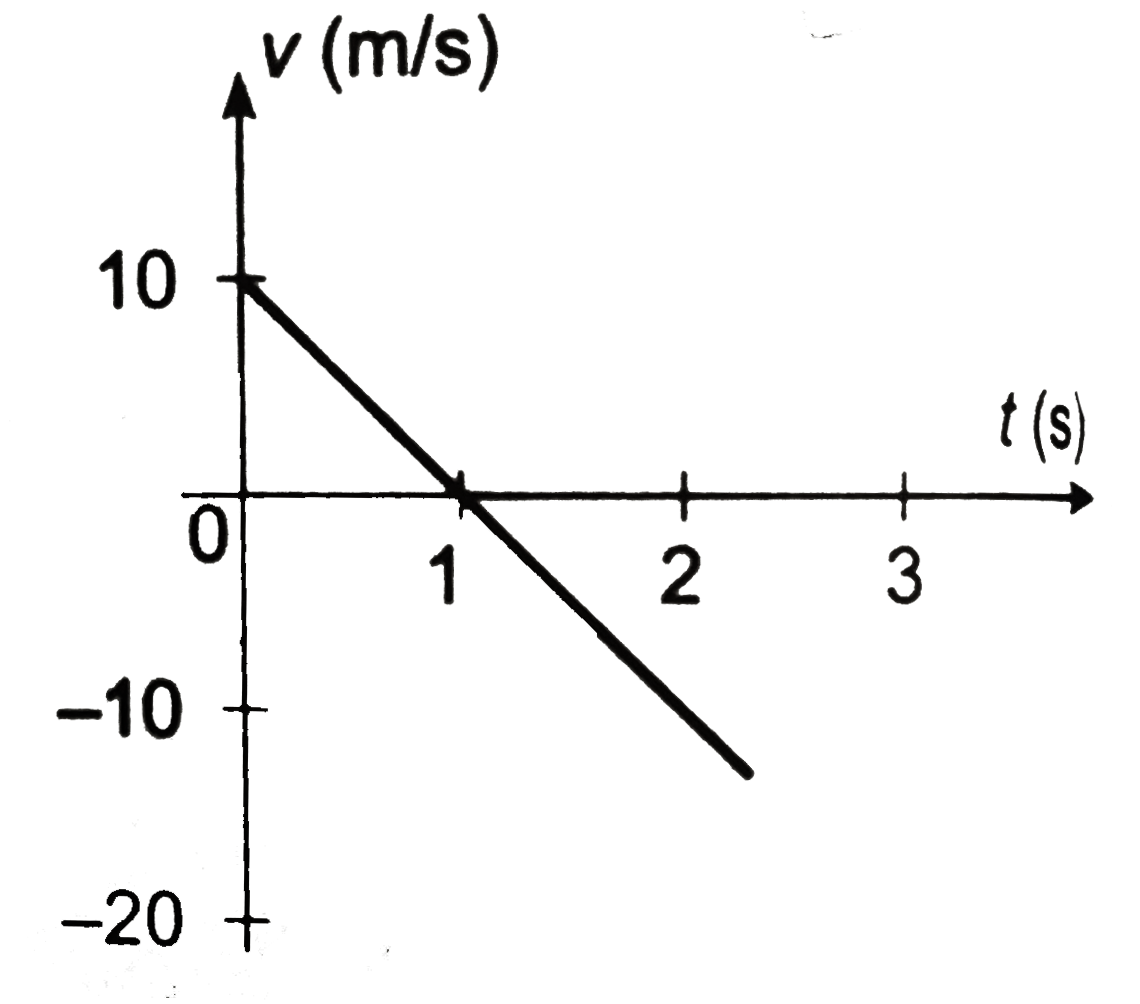
The particle starts from the origin
The particle crosses it initial position at t=2s
The average speed of the particle in the time interval, 0≤t≤2s is zero
All of the above
The correct Answer is:B
s=net area of v-t graph
At 2s, net area=0
∴s=0
and the particle crosses its initial position.
Topper's Solved these Questions
- KINEMATICSBOOK - DC PANDEYCHAPTER - KINEMATICSEXERCISE - Subjective
51 Videos
- KINEMATICSBOOK - DC PANDEYCHAPTER - KINEMATICSEXERCISE - More Than One Correct
6 Videos
- KINEMATICSBOOK - DC PANDEYCHAPTER - KINEMATICSEXERCISE - Assertion And Reason
12 Videos
- GRAVITATIONBOOK - DC PANDEYCHAPTER - GRAVITATIONEXERCISE - (C) Chapter Exercises
45 Videos
- KINEMATICS 1BOOK - DC PANDEYCHAPTER - KINEMATICS 1EXERCISE - INTEGER_TYPE
15 Videos
Similar Questions
The figure shows a velocity-time graph of a particle moving along a straight line
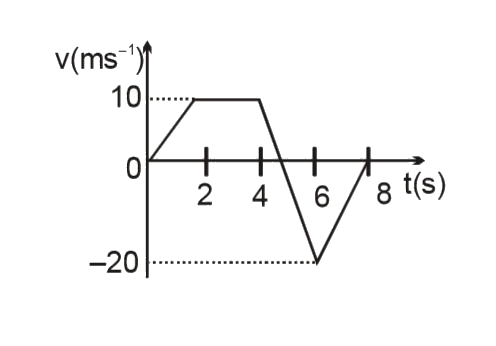
Q. The correct displacement-time graph of the particle is shown as
View SolutionThe figure shows a velocity-time graph of a particle moving along a straight line
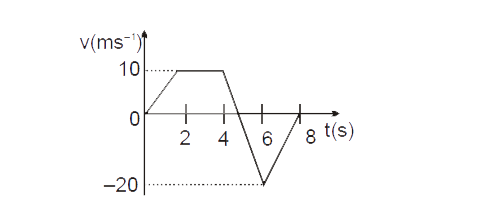
Identify the region in which the rate of change of velocity ∣∣∣Δ¯vΔt∣∣∣ of the particle is maximum
View Solution
Knowledge Check
The figure shows a velocity-time graph of a particle moving along a straight line
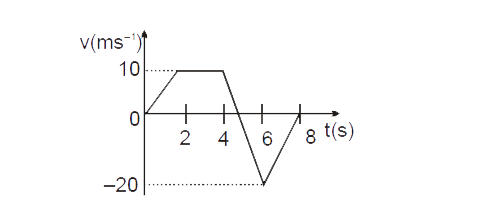
Choose the incorrect statement. The particle comes to rest atAt = 0 sBt = 5 sCt = 8 sDNone of theseThe figure shows a velocity-time graph of a particle moving along a straight line
Choose the incorrect statement. The particle comes to rest atAt=0sBt=5sCt=8sDnoe of theseThe figure shows a velocity-time graph of a particle moving along a straight line
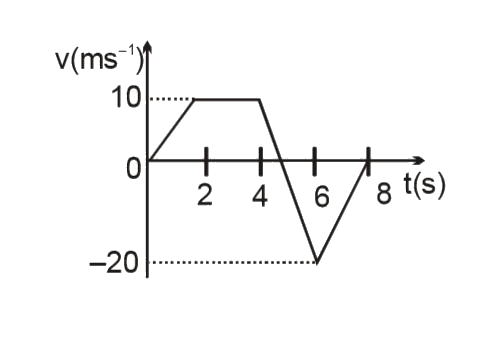
Q. Identify the region in which the rate of change of velocity ∣∣∣Δ→vΔt∣∣∣ of the particle is maximumA0 to 2sB2 to 4sC4 to 6sD6 to 8s
The figure shows a velocity-time graph of a particle moving along a straight line
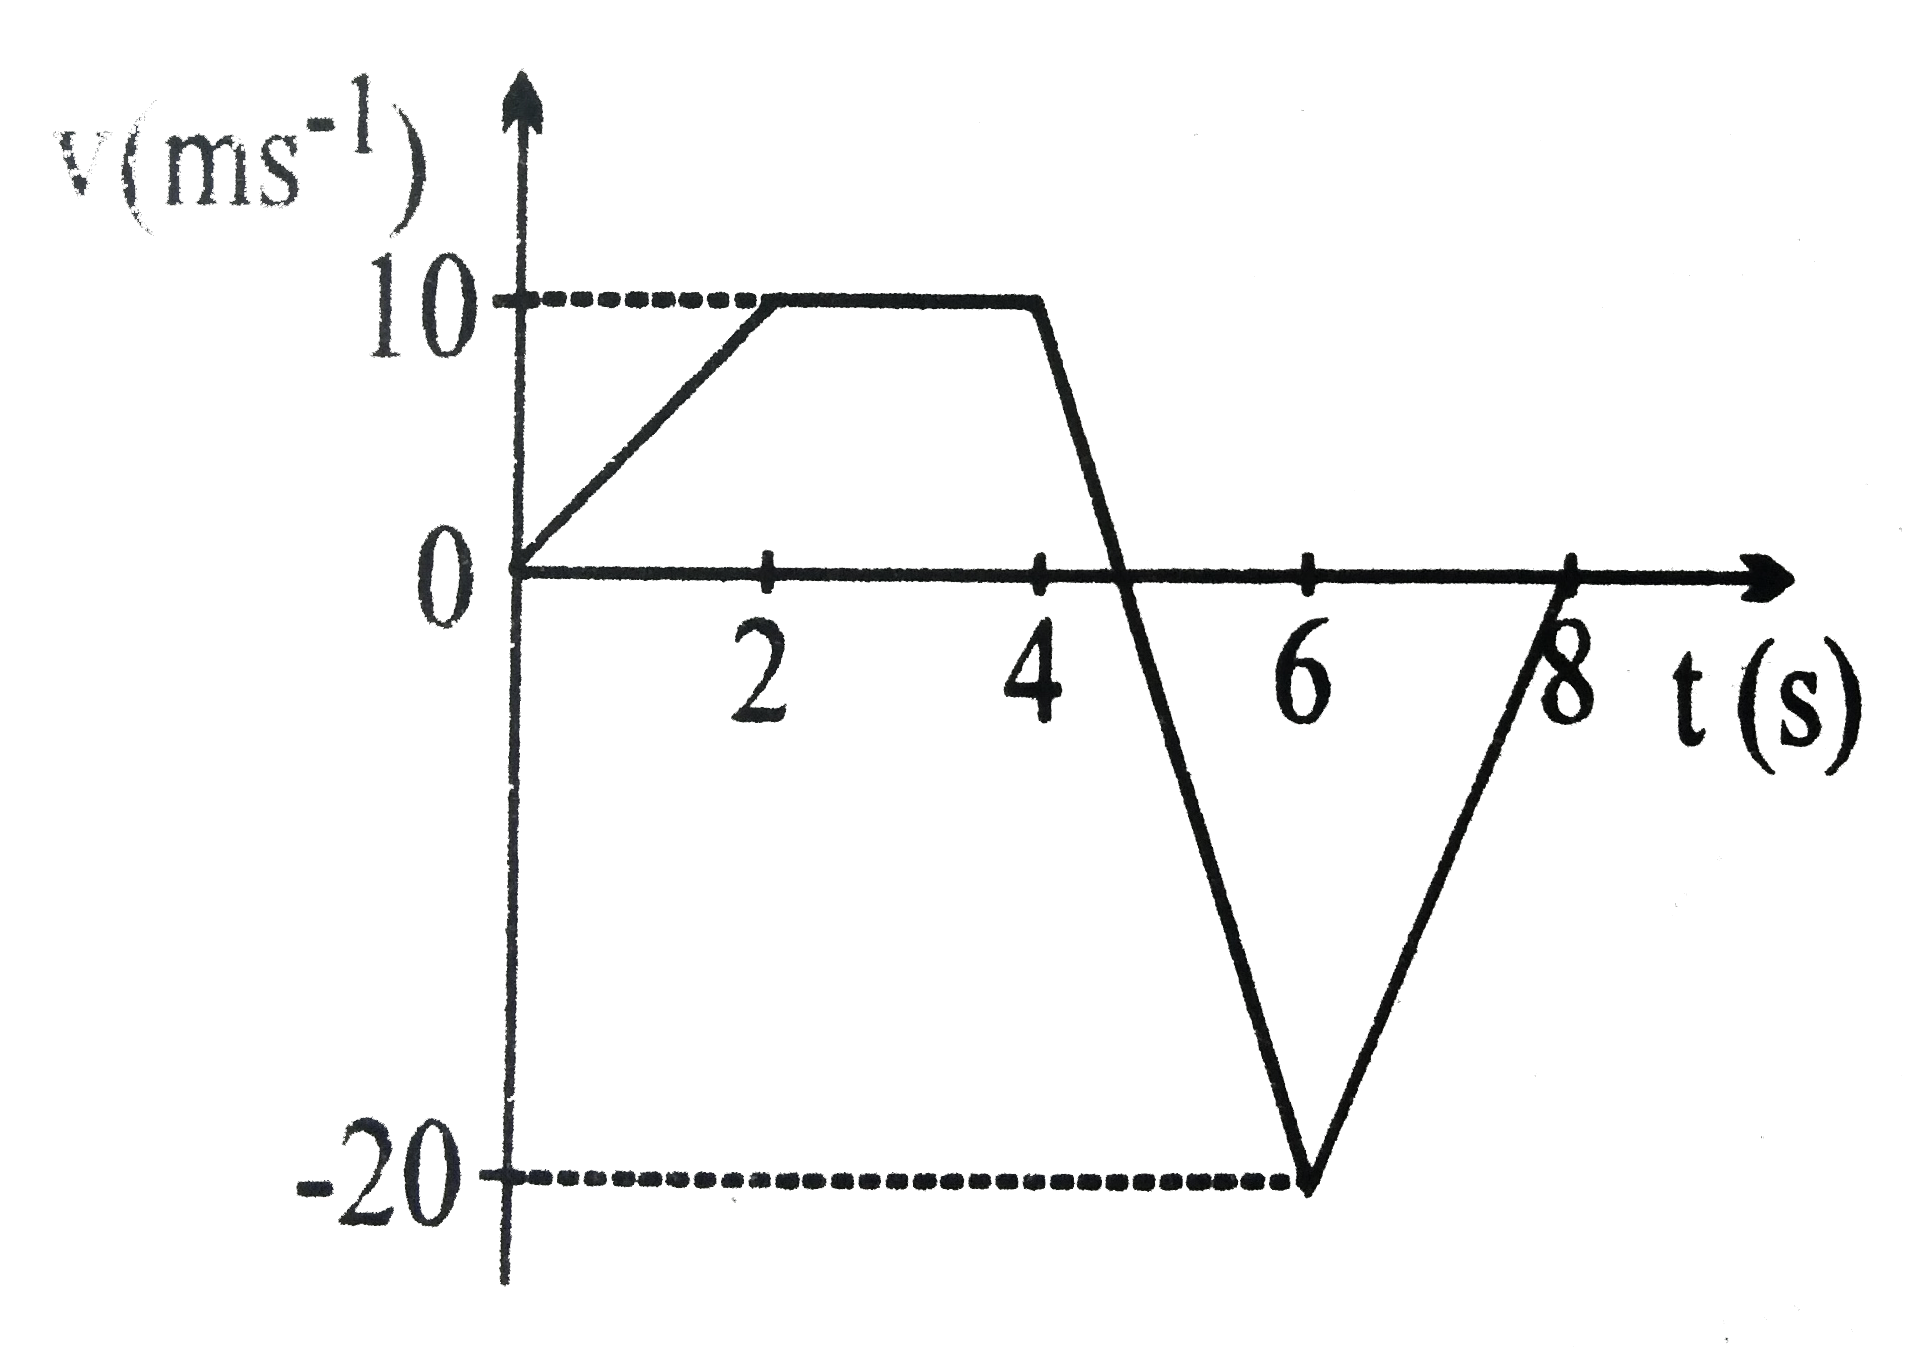
Identify the region in which the rate of change of velocity ∣∣∣Δ→vΔt∣∣∣ of the particle is maximum
View SolutionThe figure shows a velocity-time graph of a particle moving along a straight line
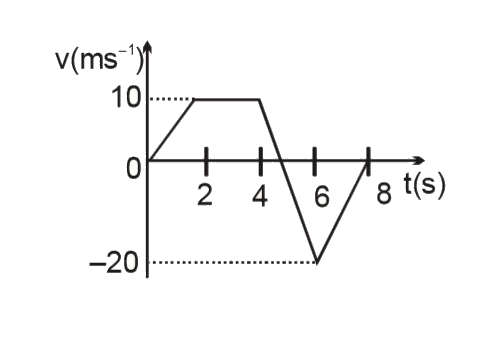
Q. If the particle starts from the position x0 = –15 m, then its position at t = 2s will be
View SolutionThe figure shows a velocity-time graph of a particle moving along a straight line
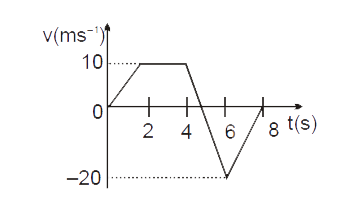
If the particle starts from the position x0=–15 m, then its position at t = 2s will be
View SolutionThe figure shows a velocity-time graph of a particle moving along a straight line
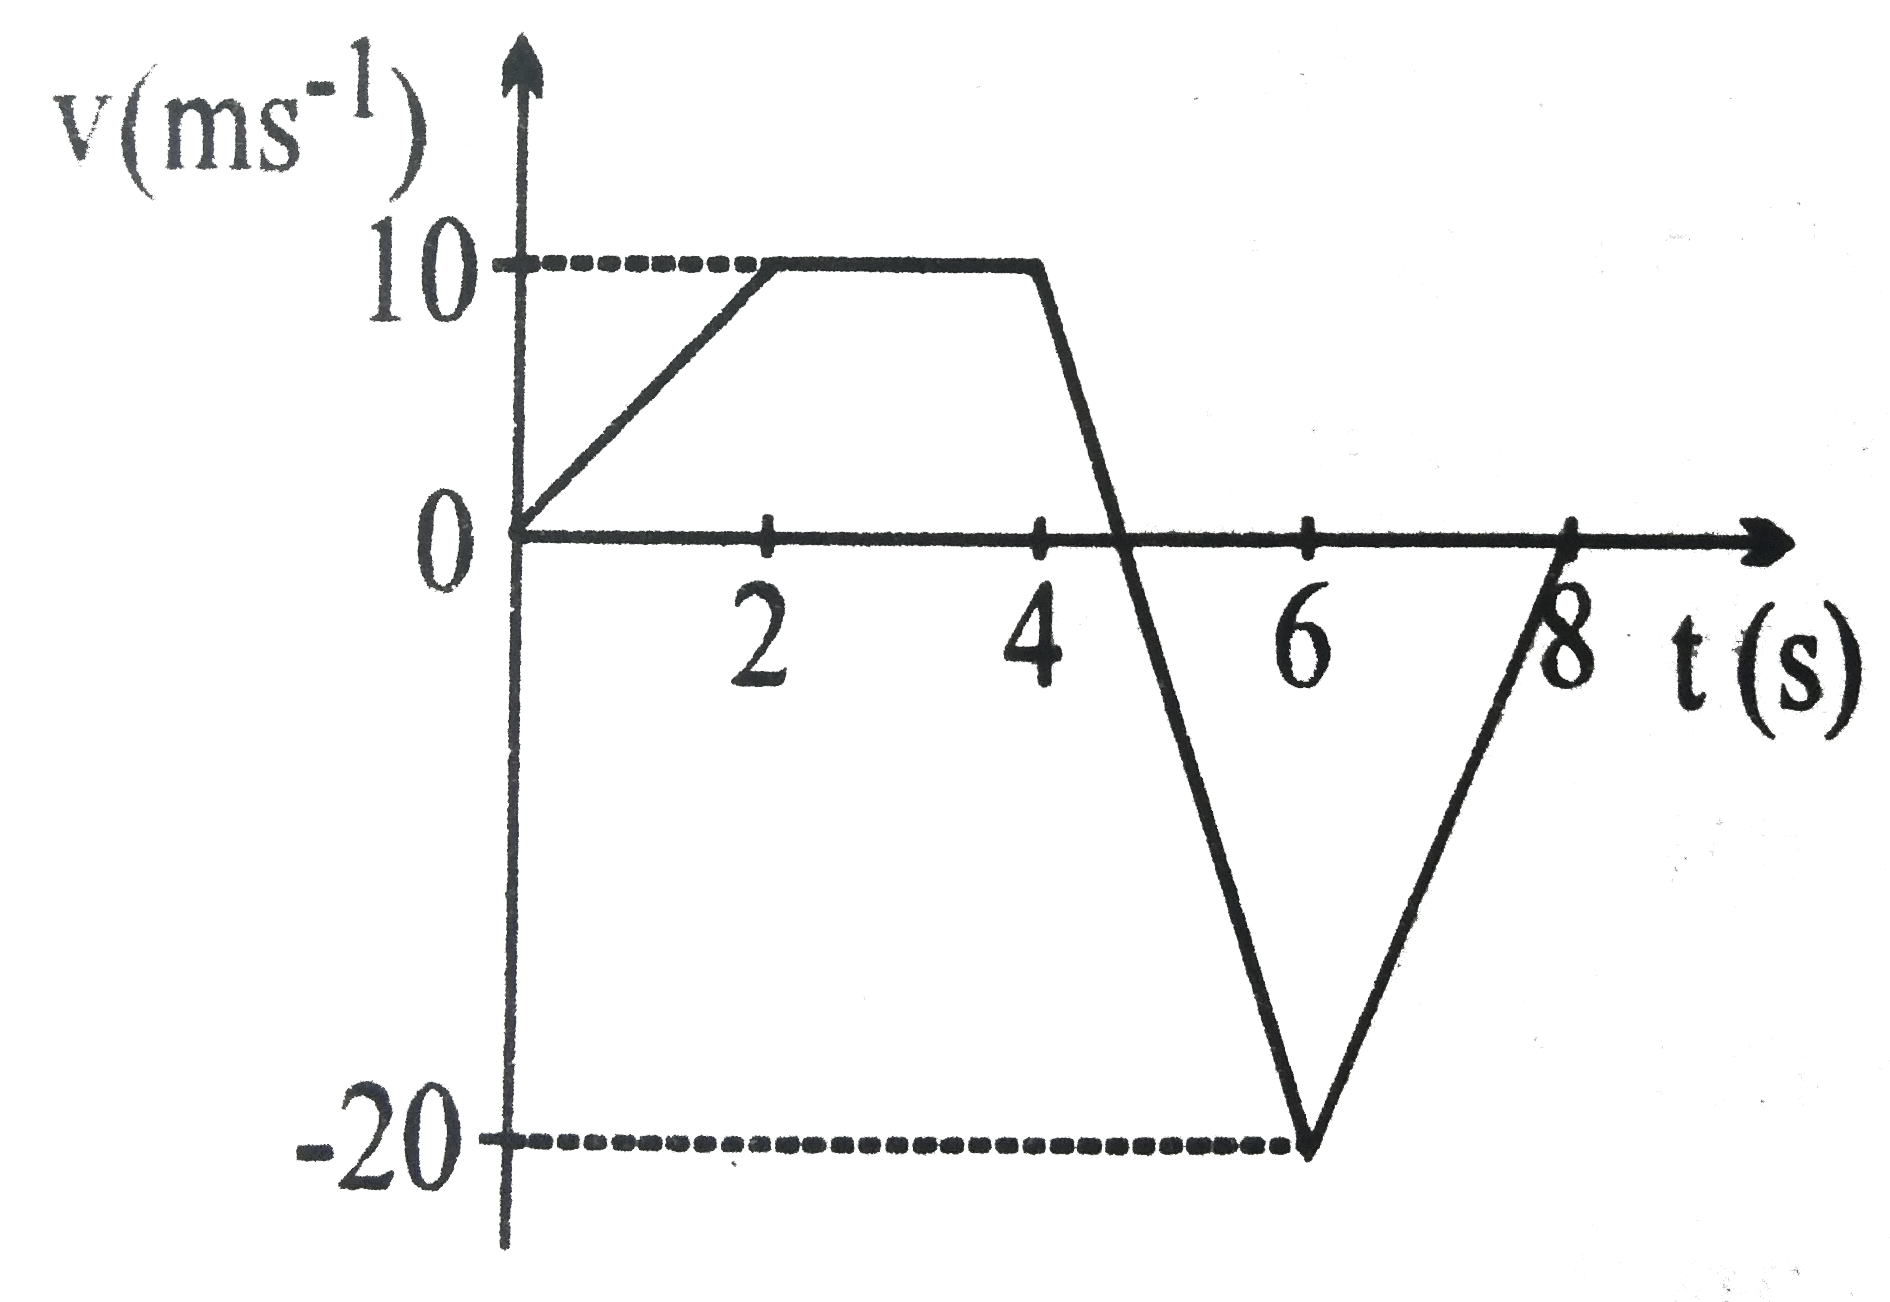
If the particles starts form the position x0=−15m, then its position at t=2s will be
View SolutionThe figure shows a velocity-time graph of a particle moving along a straight line
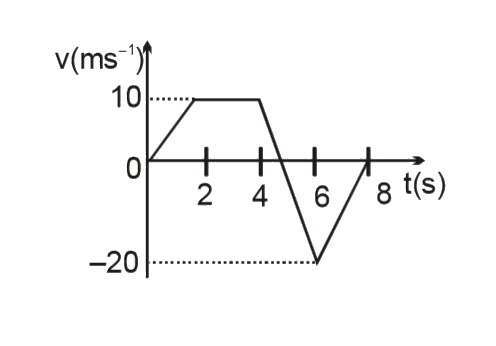
Q. The total distance travelled by the particle is
View Solution
