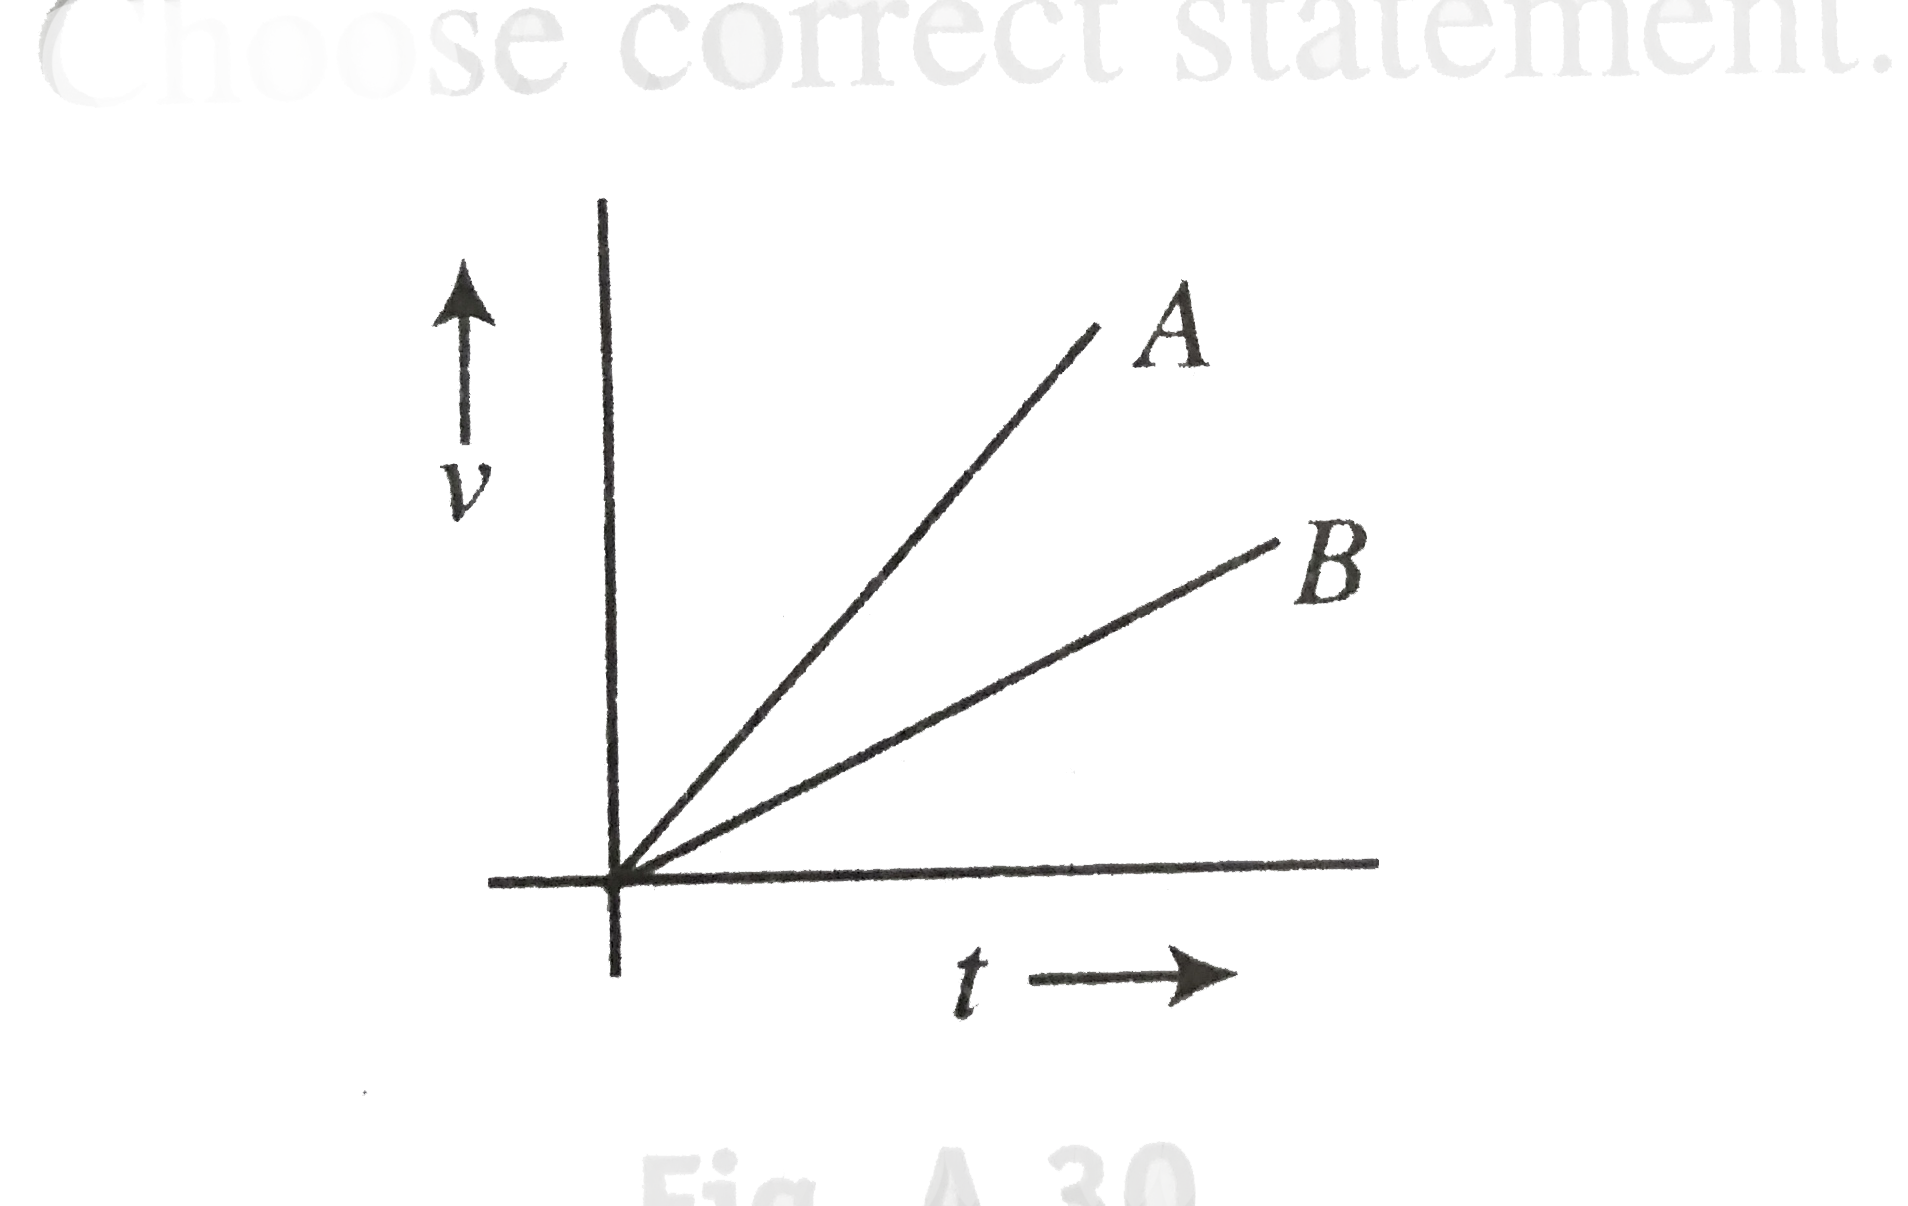
A time-velocity graph of two vehicles A and B starting from rest at the same time is given in the figure-1.107. The statement that can be deduced correctly from the graph is :
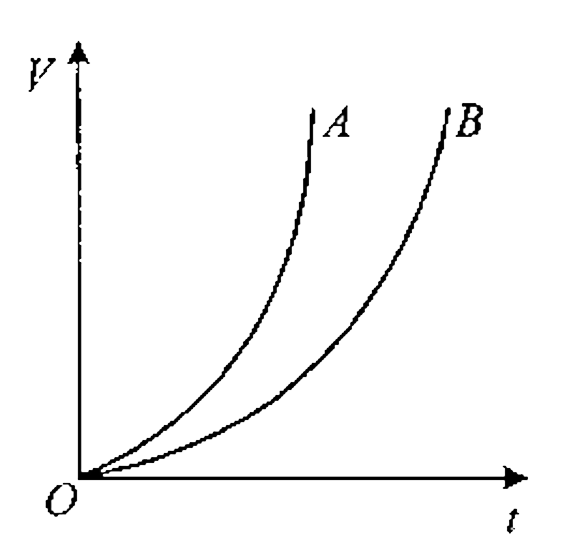
Acceleration of A is greater thanthat of B
Acceleration of B is greater than that of A
Acceleration of A is increasing at a slower rate than that of B
Velocity of B is greaterthan that of A.
The correct Answer is:A
Step by step video, text & image solution for A time-velocity graph of two vehicles A and B starting from rest at the same time is given in the figure-1.107. The statement that can be deduced correctly from the graph is : by Physics experts to help you in doubts & scoring excellent marks in Class 11 exams.
Updated on:21/07/2023Topper's Solved these Questions
- KINEMATICSBOOK - PHYSICS GALAXY - ASHISH ARORACHAPTER - KINEMATICSEXERCISE - Numerical
111 Videos
- KINEMATICSBOOK - PHYSICS GALAXY - ASHISH ARORACHAPTER - KINEMATICSEXERCISE - Advance MCQs with One or More Options Correct
17 Videos
- KINEMATICSBOOK - PHYSICS GALAXY - ASHISH ARORACHAPTER - KINEMATICSEXERCISE - Discussion Question
18 Videos
- GRAVITATIONBOOK - PHYSICS GALAXY - ASHISH ARORACHAPTER - GRAVITATIONEXERCISE - Unsolved Numerical
94 Videos
- LINEAR MOMENTUM & ITS CONSERVATIONBOOK - PHYSICS GALAXY - ASHISH ARORACHAPTER - LINEAR MOMENTUM & ITS CONSERVATIONEXERCISE - exercise 1.3
3 Videos
Similar Questions
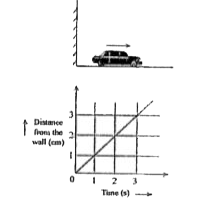
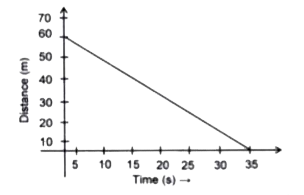
A toy car is moving away from a wall, as shown in the given figure. As time increases, the distance of the car from the wall also increases, as depicted in the graph. The hypothesis that can be derived from the given graph is
View SolutionSuppose that the acceleration versus time graph of a particle that starts from rest at t = 0 is as shown in the figure :
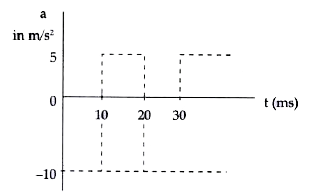
At what instant does the particle come to rest for the first time ?
View Solution
Knowledge Check
A velocity-time graph of two vehicals A & B starting from rest at the same time is given in the figure. The statements which is correct from graph.
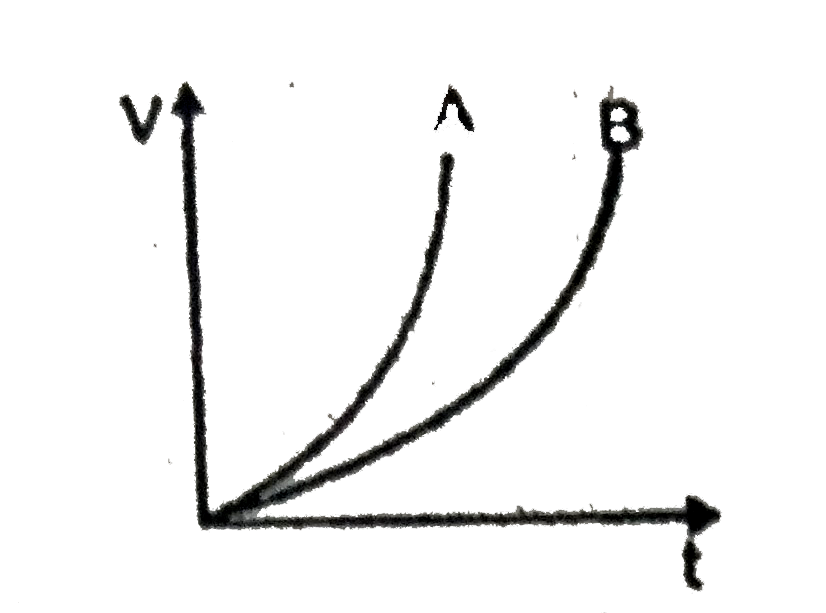 AAcceleration of A is always greater than that of BBAcceleration of B is always greater than that of ACacceleration of A and B is constant.DCannot say
The velocity - time graph of two bodies A and B is shown in figure. Choose correct statement.
 Aacceleration of Bgt acceleration of ABacceleration of A gt acceleration of BCboth are starting from same pointDA covers greater distance than B in the same time.
A graph of acceleration versus time of a particle starting from rest at t=0 is as shown in figure. The speed of the particle at t=14s is
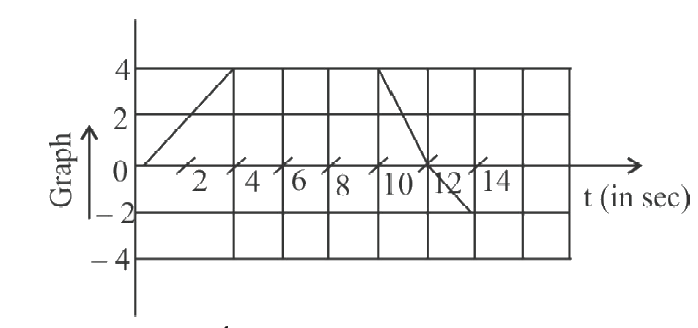 A2ms−1B34ms−1C20ms−1D42ms−1
The velocity − time graph of a particle is as shown in figure

View SolutionA body starts from rest at time t=0 , the acceleration time graph is shown in the figure . The maximum velocity attained by the body will be
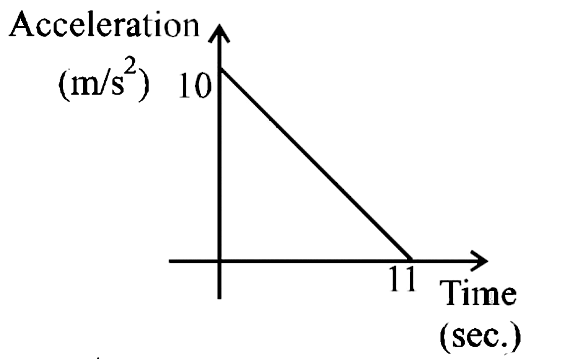
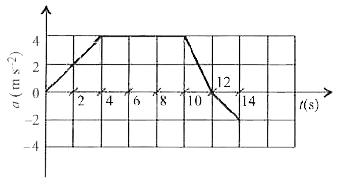
View SolutionA graph of acceleration versus time of a particle starting from rest at t =0 is shown. The speed of the particle at t=14 second is
View SolutionThe distance-time graph of a moving vehicle is as shown in the figure.
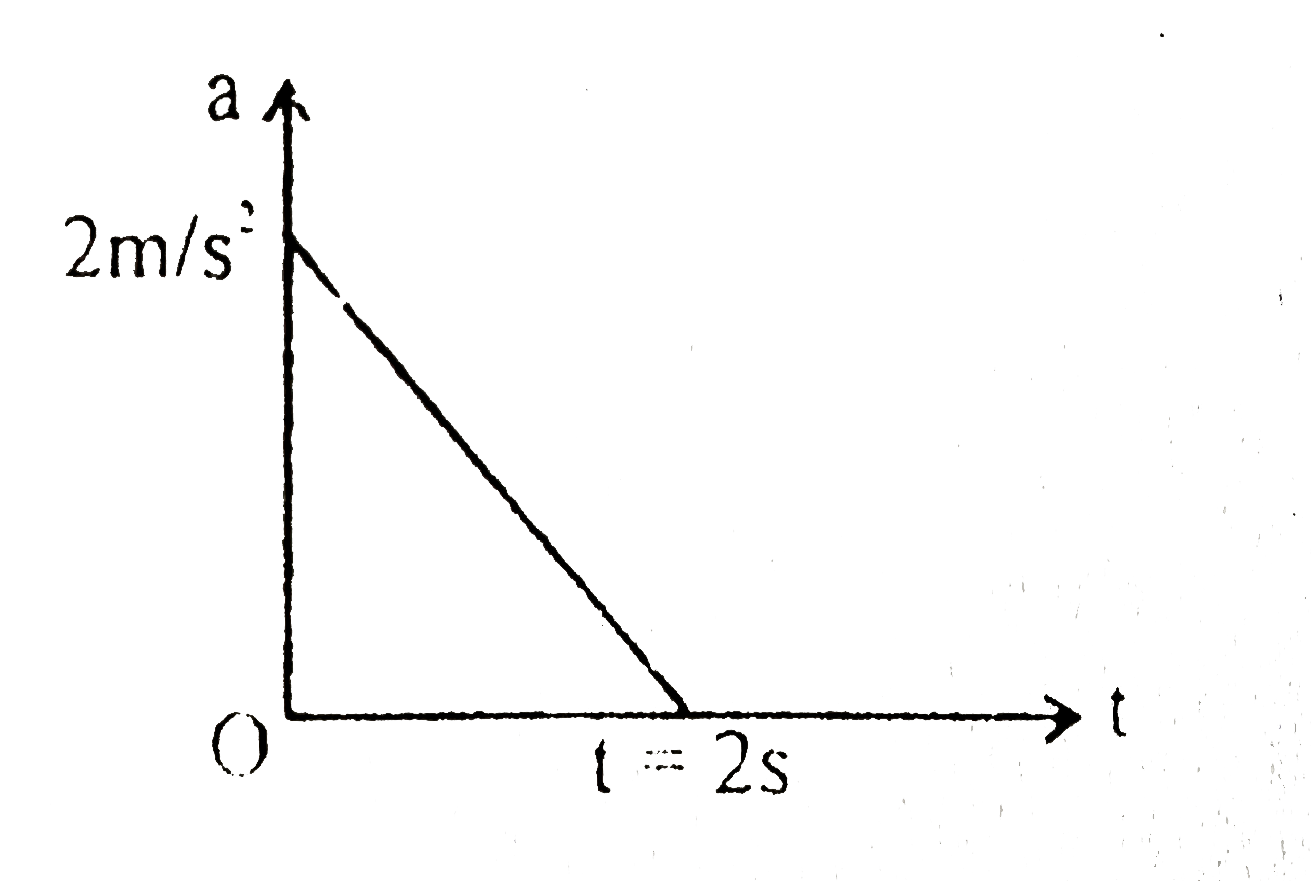
View SolutionAccleration vs time graph of a particle starting from rest is given. Find the displacement of particle in first 2 seconds.
View Solution
