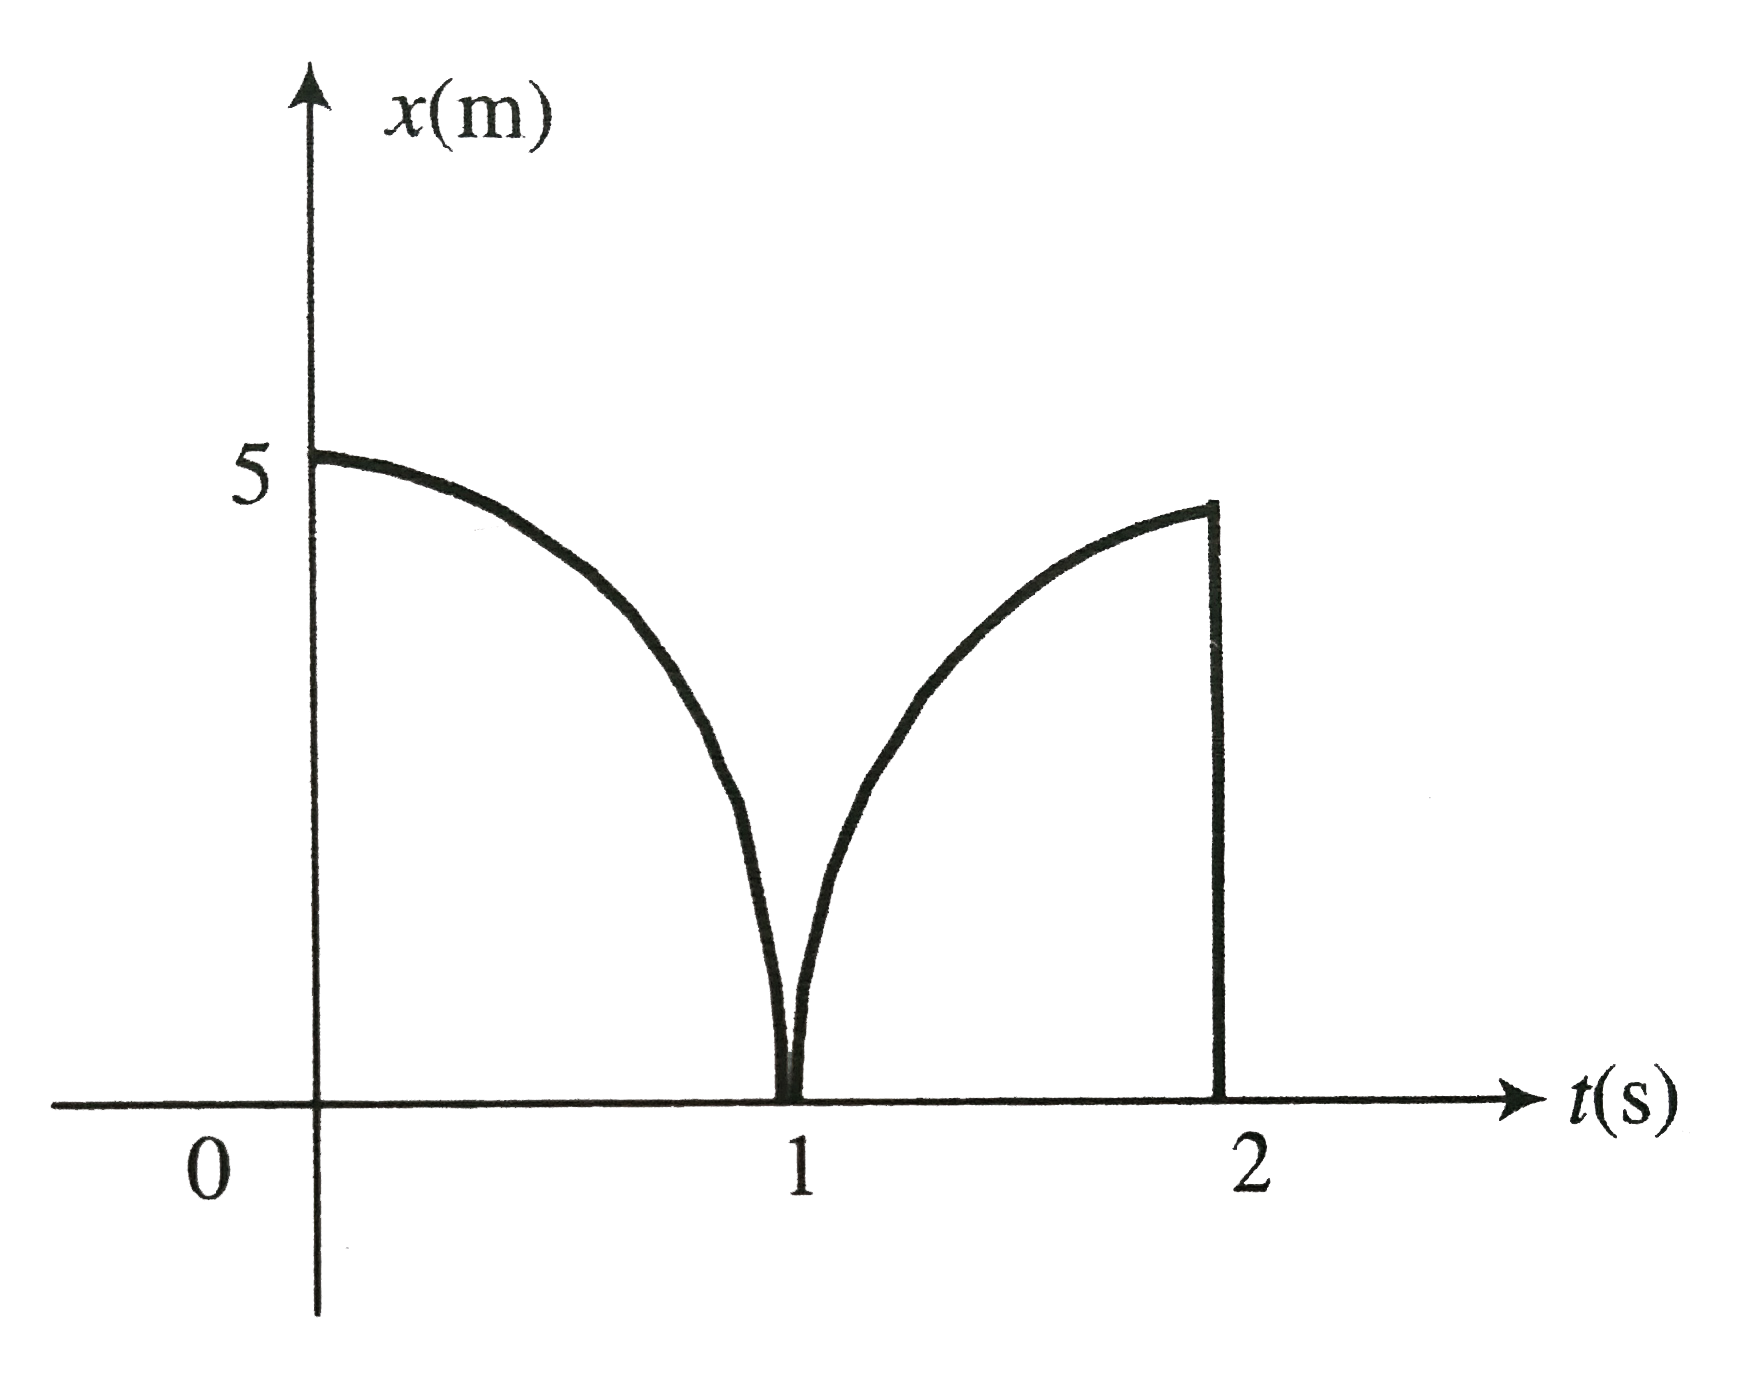
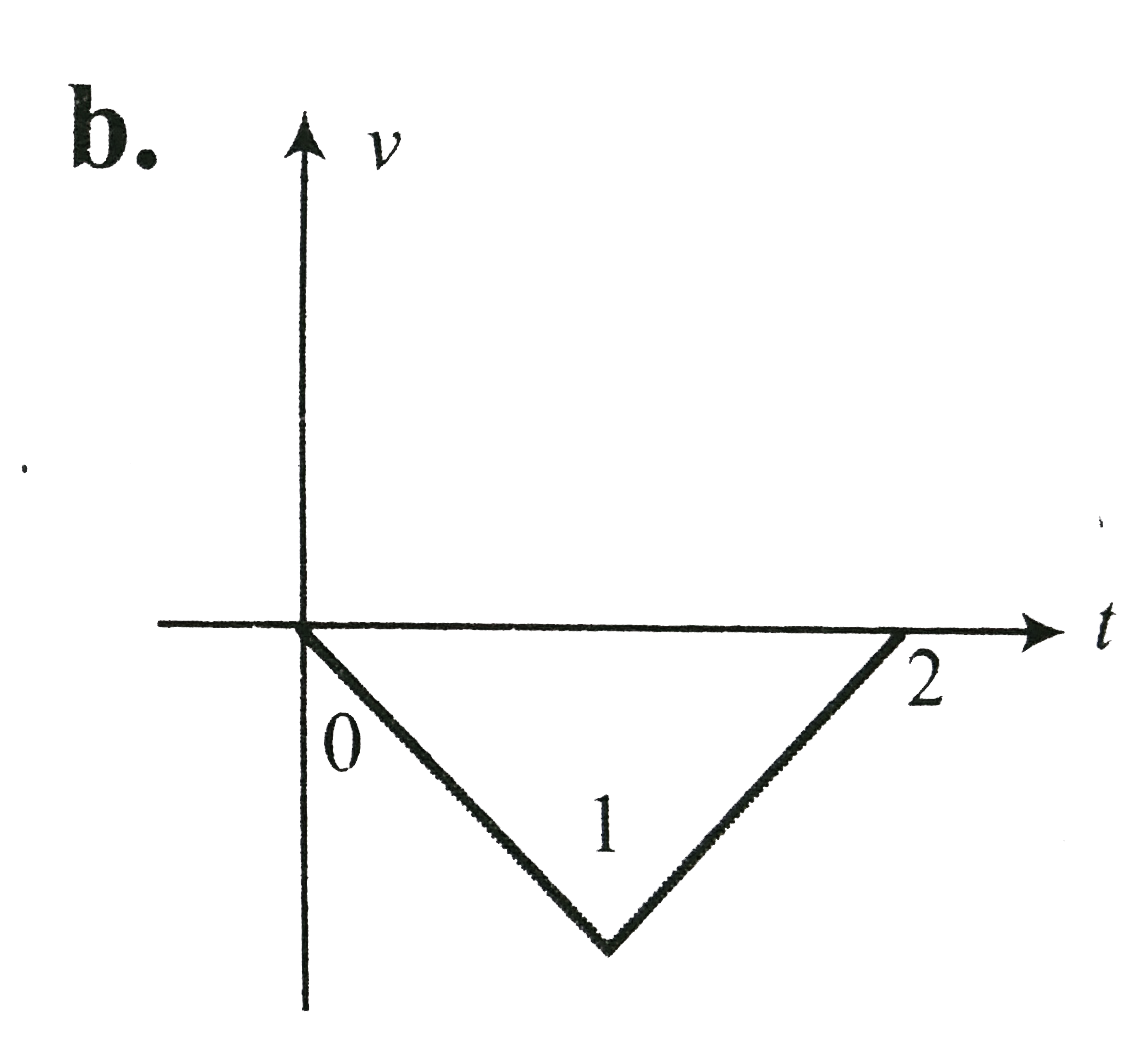
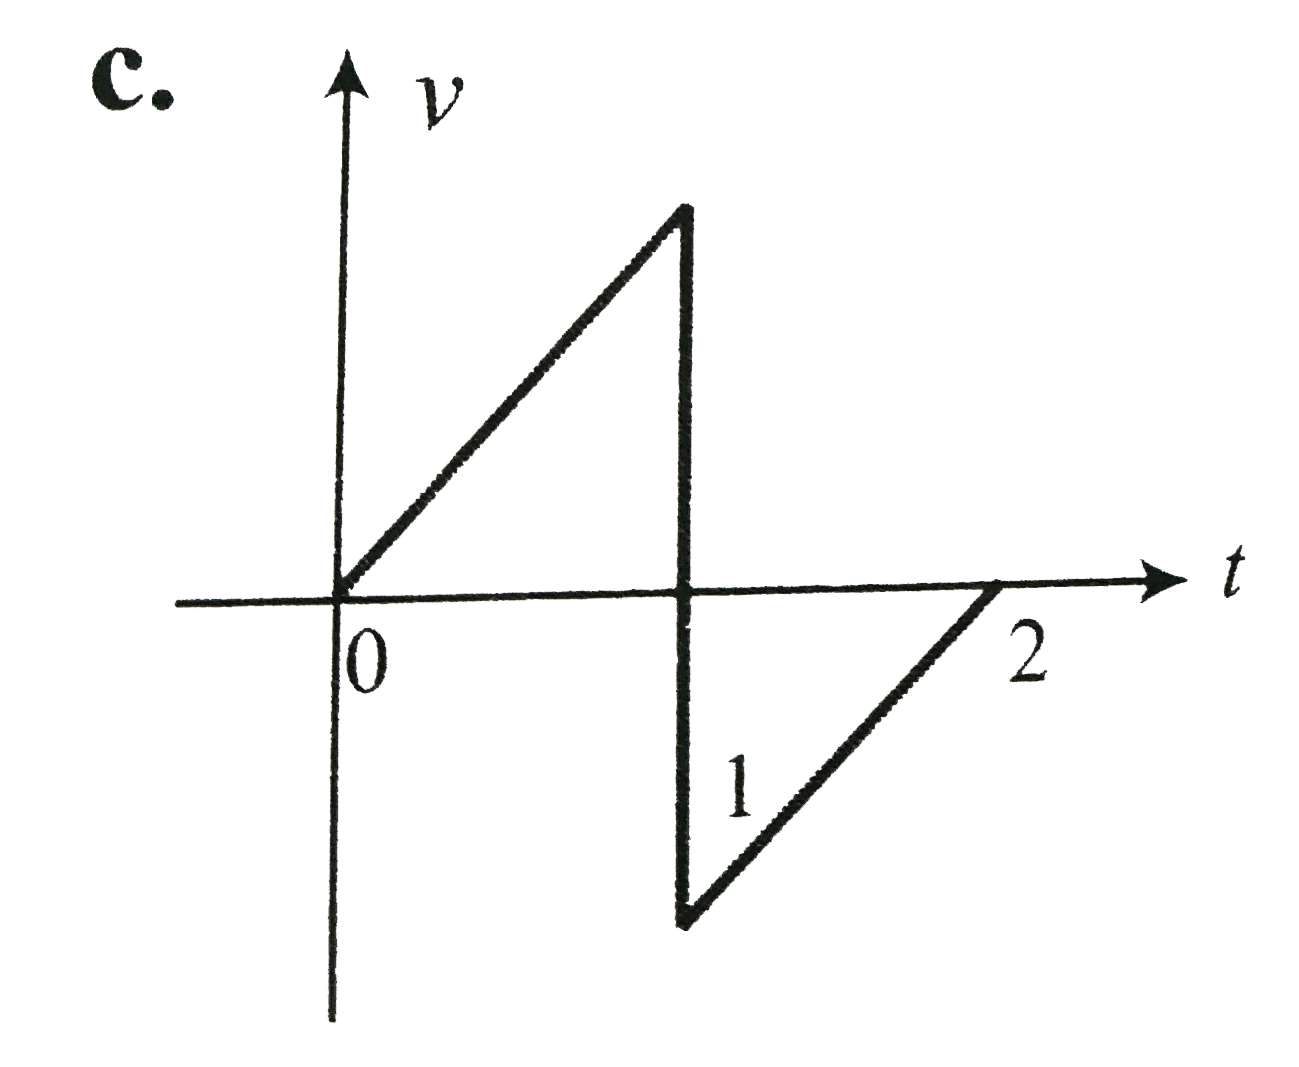
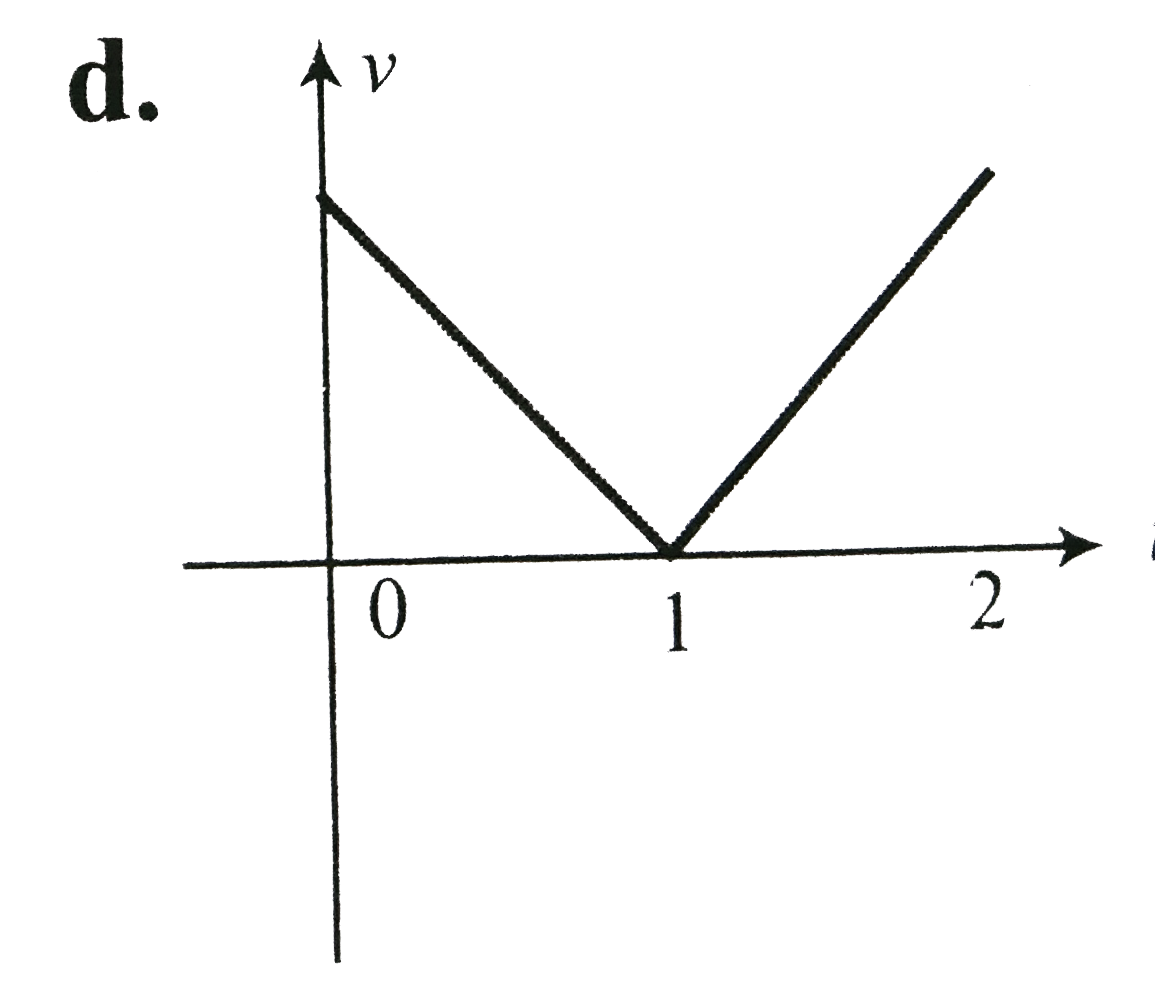
The displacement-time graph of a moving particle with constant acceleration is shown in. The velocity-time is given by
 .
.
A
 .
.
B
 .
.
C
 .
.
D
 .
.
Video Solution
Text Solution
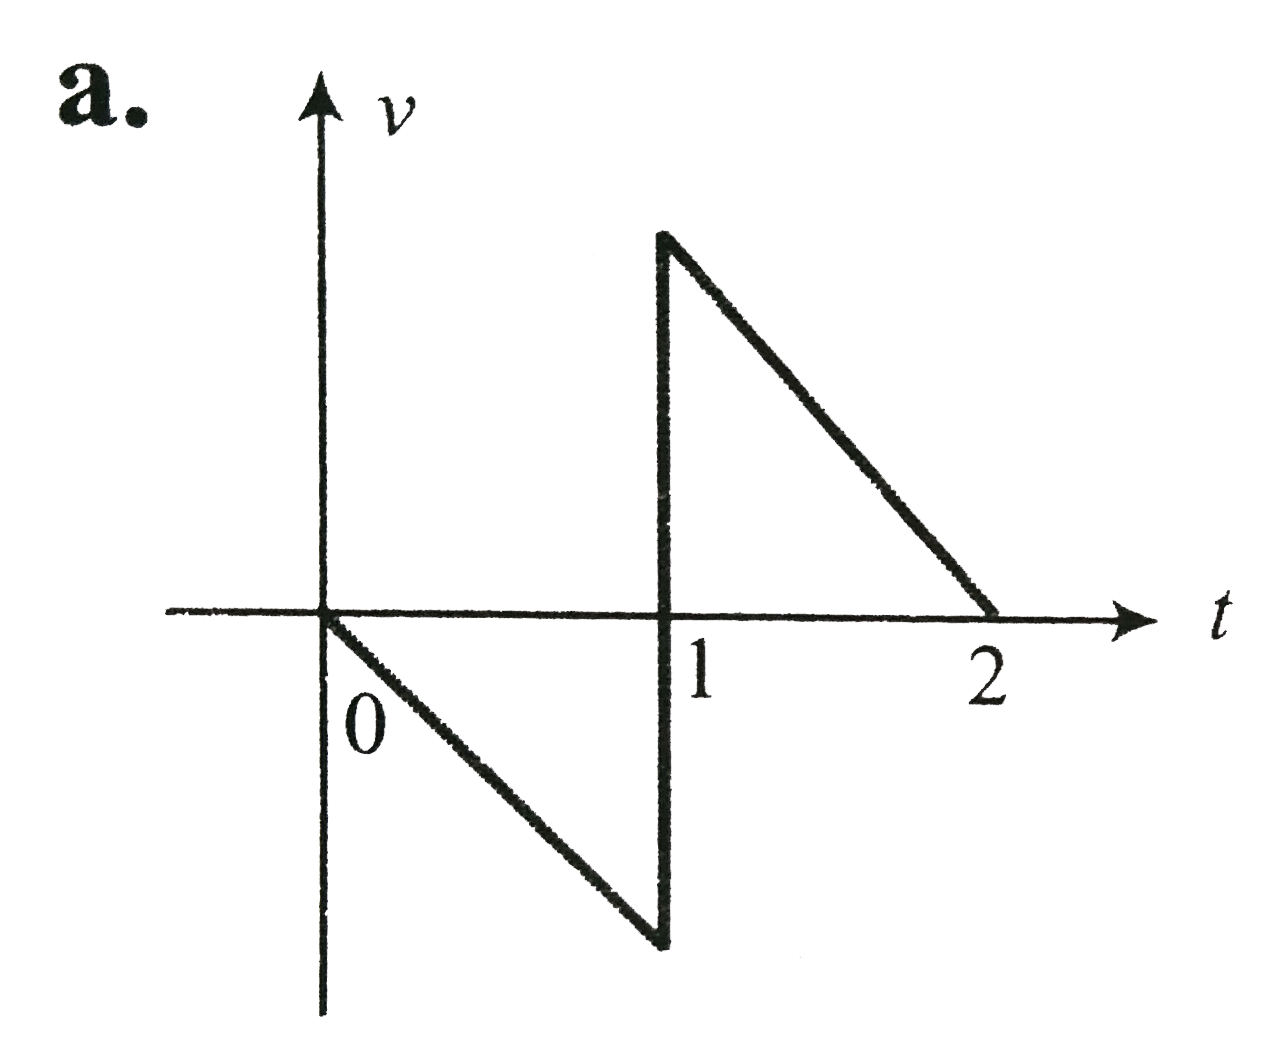
The correct Answer is:A
At t−0, slope of the x−t graph is zero, hence, velocity is zero at t−0. As time increases, slope increases in negative direction, hece, velocity increases in negative derction. At point 1, slope changes suddenly from negative to positive value, hence, velocity changes suddenly from negative to positive and then velocity starts decreasing and becomes zero at 2. Option a represents all these clearly.
|
Topper's Solved these Questions
- KINEMATICS-1BOOK - CENGAGE PHYSICSCHAPTER - KINEMATICS-1EXERCISE - Graphical cancept
1 Videos
- KINEMATICS-1BOOK - CENGAGE PHYSICSCHAPTER - KINEMATICS-1EXERCISE - Multiple Correct
16 Videos
- KINEMATICS-1BOOK - CENGAGE PHYSICSCHAPTER - KINEMATICS-1EXERCISE - Single Correct
52 Videos
- GRAVITATIONBOOK - CENGAGE PHYSICSCHAPTER - GRAVITATIONEXERCISE - INTEGER_TYPE
1 Videos
- KINEMATICS-2BOOK - CENGAGE PHYSICSCHAPTER - KINEMATICS-2EXERCISE - Exercise Integer
9 Videos
Similar Questions
Knowledge Check
The displacement-time graph of a moving particle with constant acceleration is shown in. The velocity-time is given by
 .A
.A .B
.B .C
.C .D
.D .
.Displacement time graph of a particle moving in a straight line is a shown in figure.
 Ain region A acceleration is positiveBin region B acceleration is negativeCin region C acceleration is positiveDin region D acceleration is negative
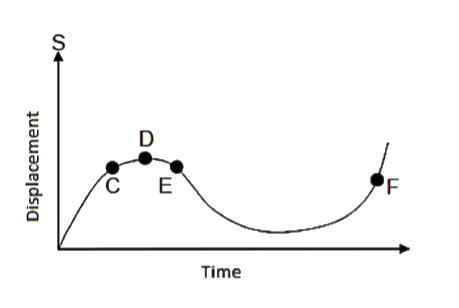
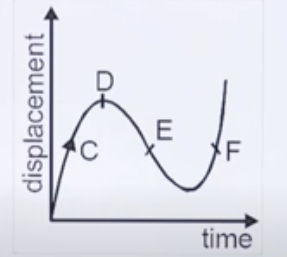
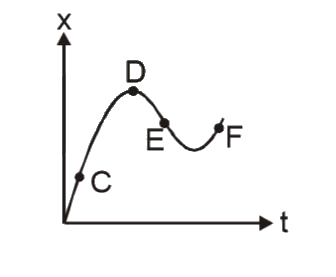
The displacement-time graph of a moving particle is shown below. The instantaneous velocity of the particle is negative at the point
ACBDCEDF
The displacement-time graph of a moving particle is shown below. The instantaneous velocity of the particle is negative at the point
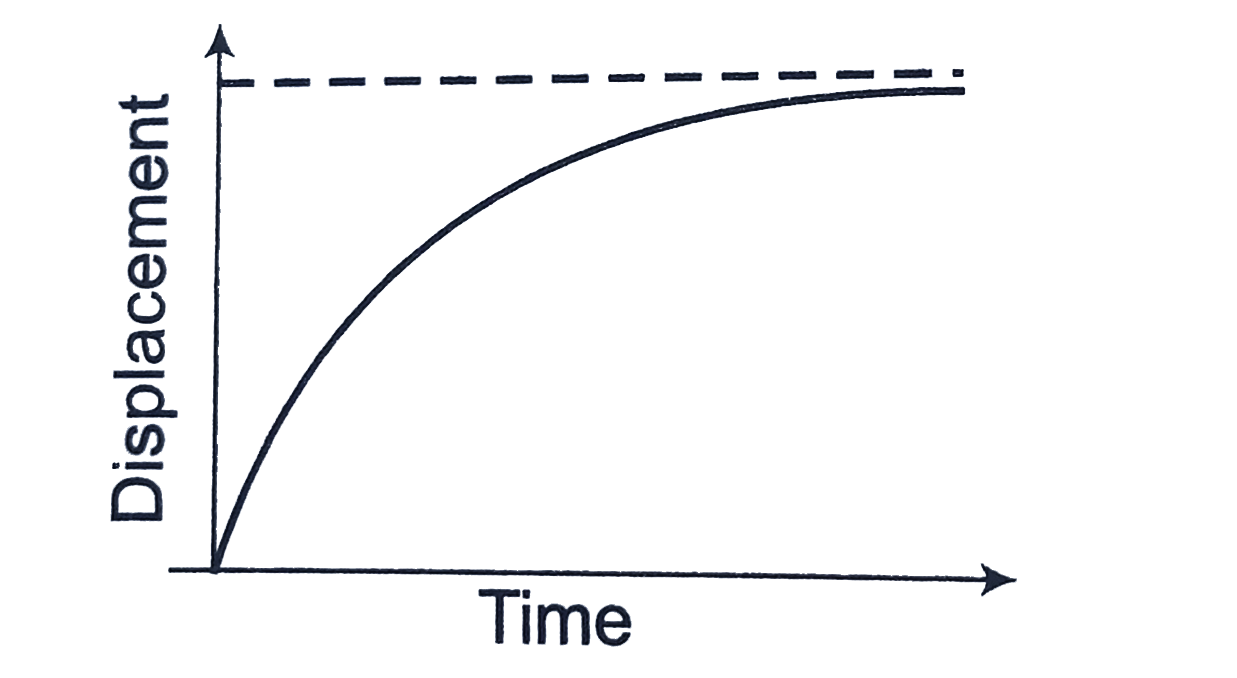
View SolutionThe displacement-time graph of a particle is as shown below. It indicates that
View SolutionThe displacement-time graph of moving particle is shown below
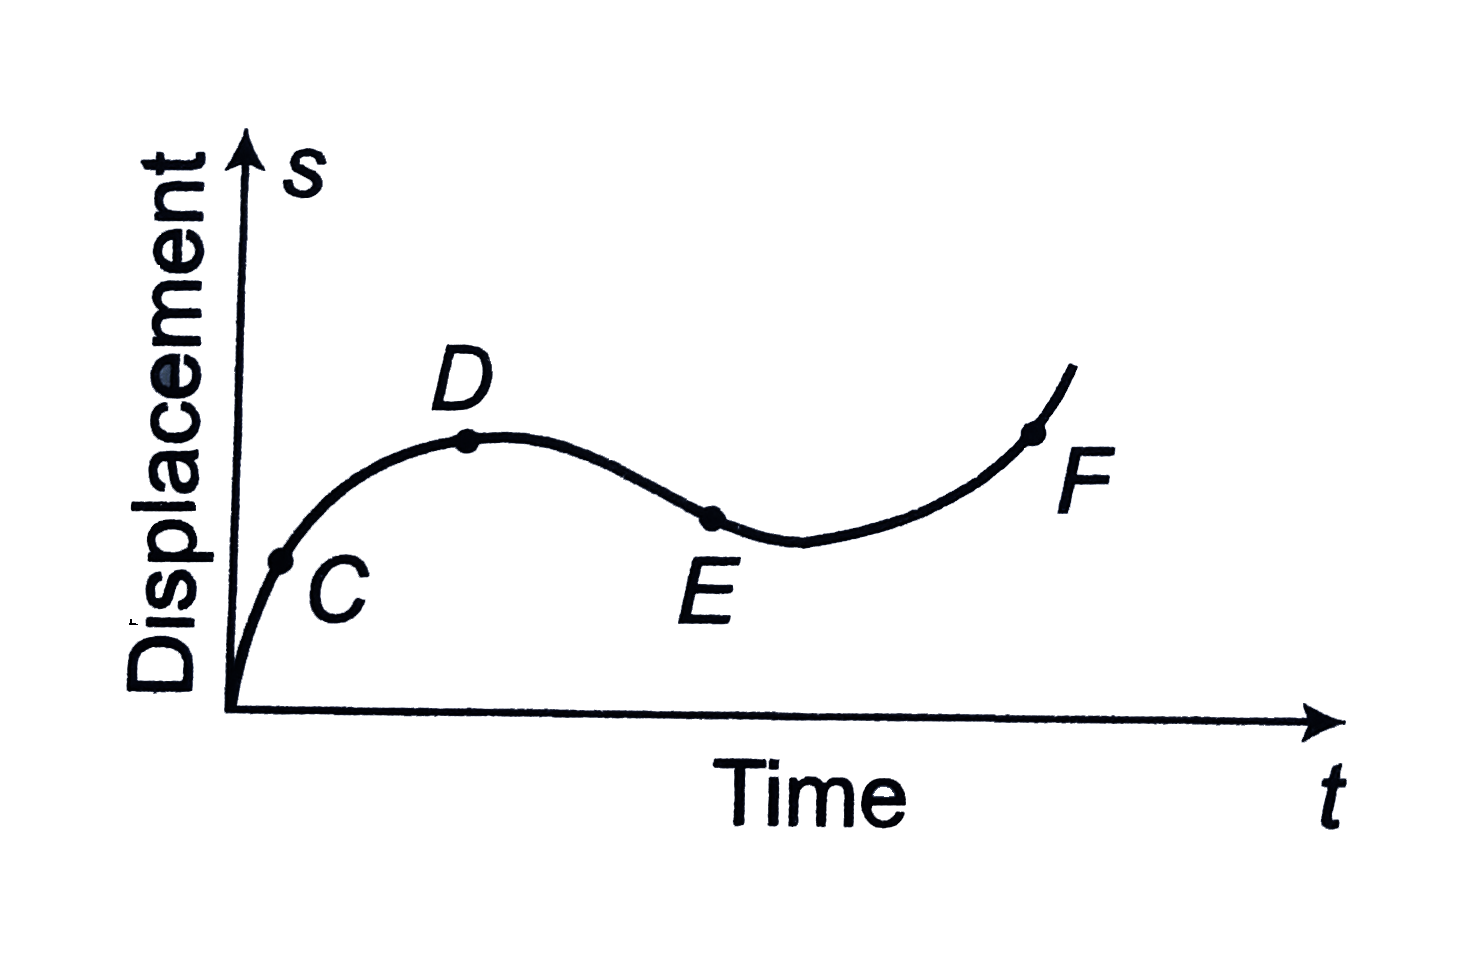
The instantaneous velocity of the particle in negative at the point
View SolutionThe acceleration versus time graph of a particle moving in a straight line is show in figure. The velocity-time graph of the particle would be
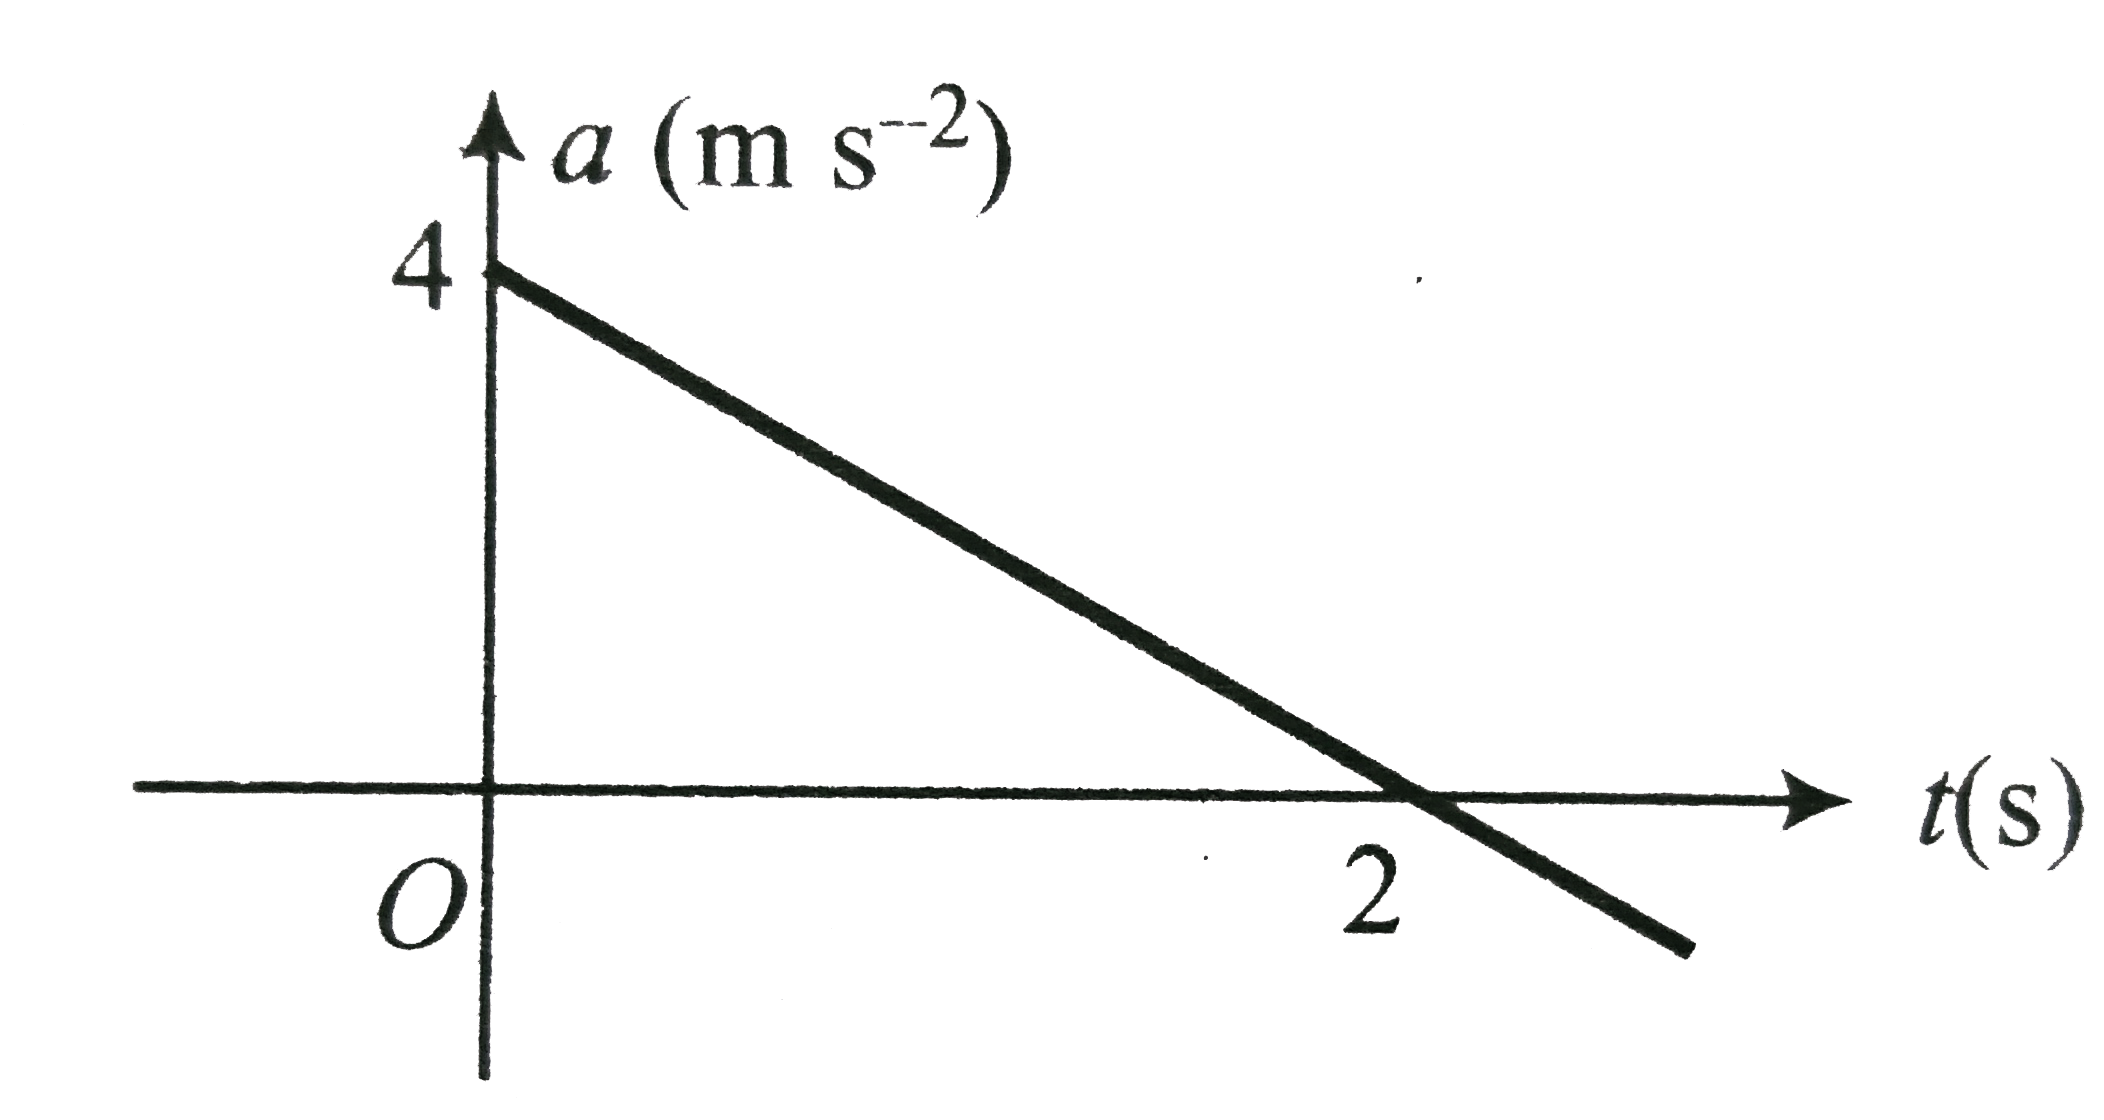 .
.
View SolutionVelocity displacement graph of a particle moving in a straight line is as shown in figure.

View Solution


