The distance-time graph Distance (m) of the motion of a cycle is shown here. Which of the following statements is/are correct regarding the given situation?
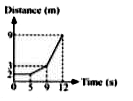
I. Cycle starts moving at 5 seconds. II. Speed of the cycle is maximum during time interval 9 seconds to 12 seconds. III. The average speed of cycle over a time period of 12 seconds is 2 m s−1
I and II only
II only
I and III only
I, II and III
The correct Answer is:A

From the given graph, it is clear that the cycle starts moving at 5 seconds. Total distance covered during time period 9 to 12 seconds is 9 m - 3 m = 6 m
so , speed =6m3s=2ms−1
Total distance covered during time period 5 to 9 seconds is 3 m - 2 m = 1 m
So, speed = 1m3s=0.3ms−1
So the speed of cycle is maximum during the time interval 9 seconds to 12 seconds.
Total distance The average speed of cycle = 9m12s=0.75ms−1
So, statements I and II are correct.
Topper's Solved these Questions
Similar Questions
Knowledge Check
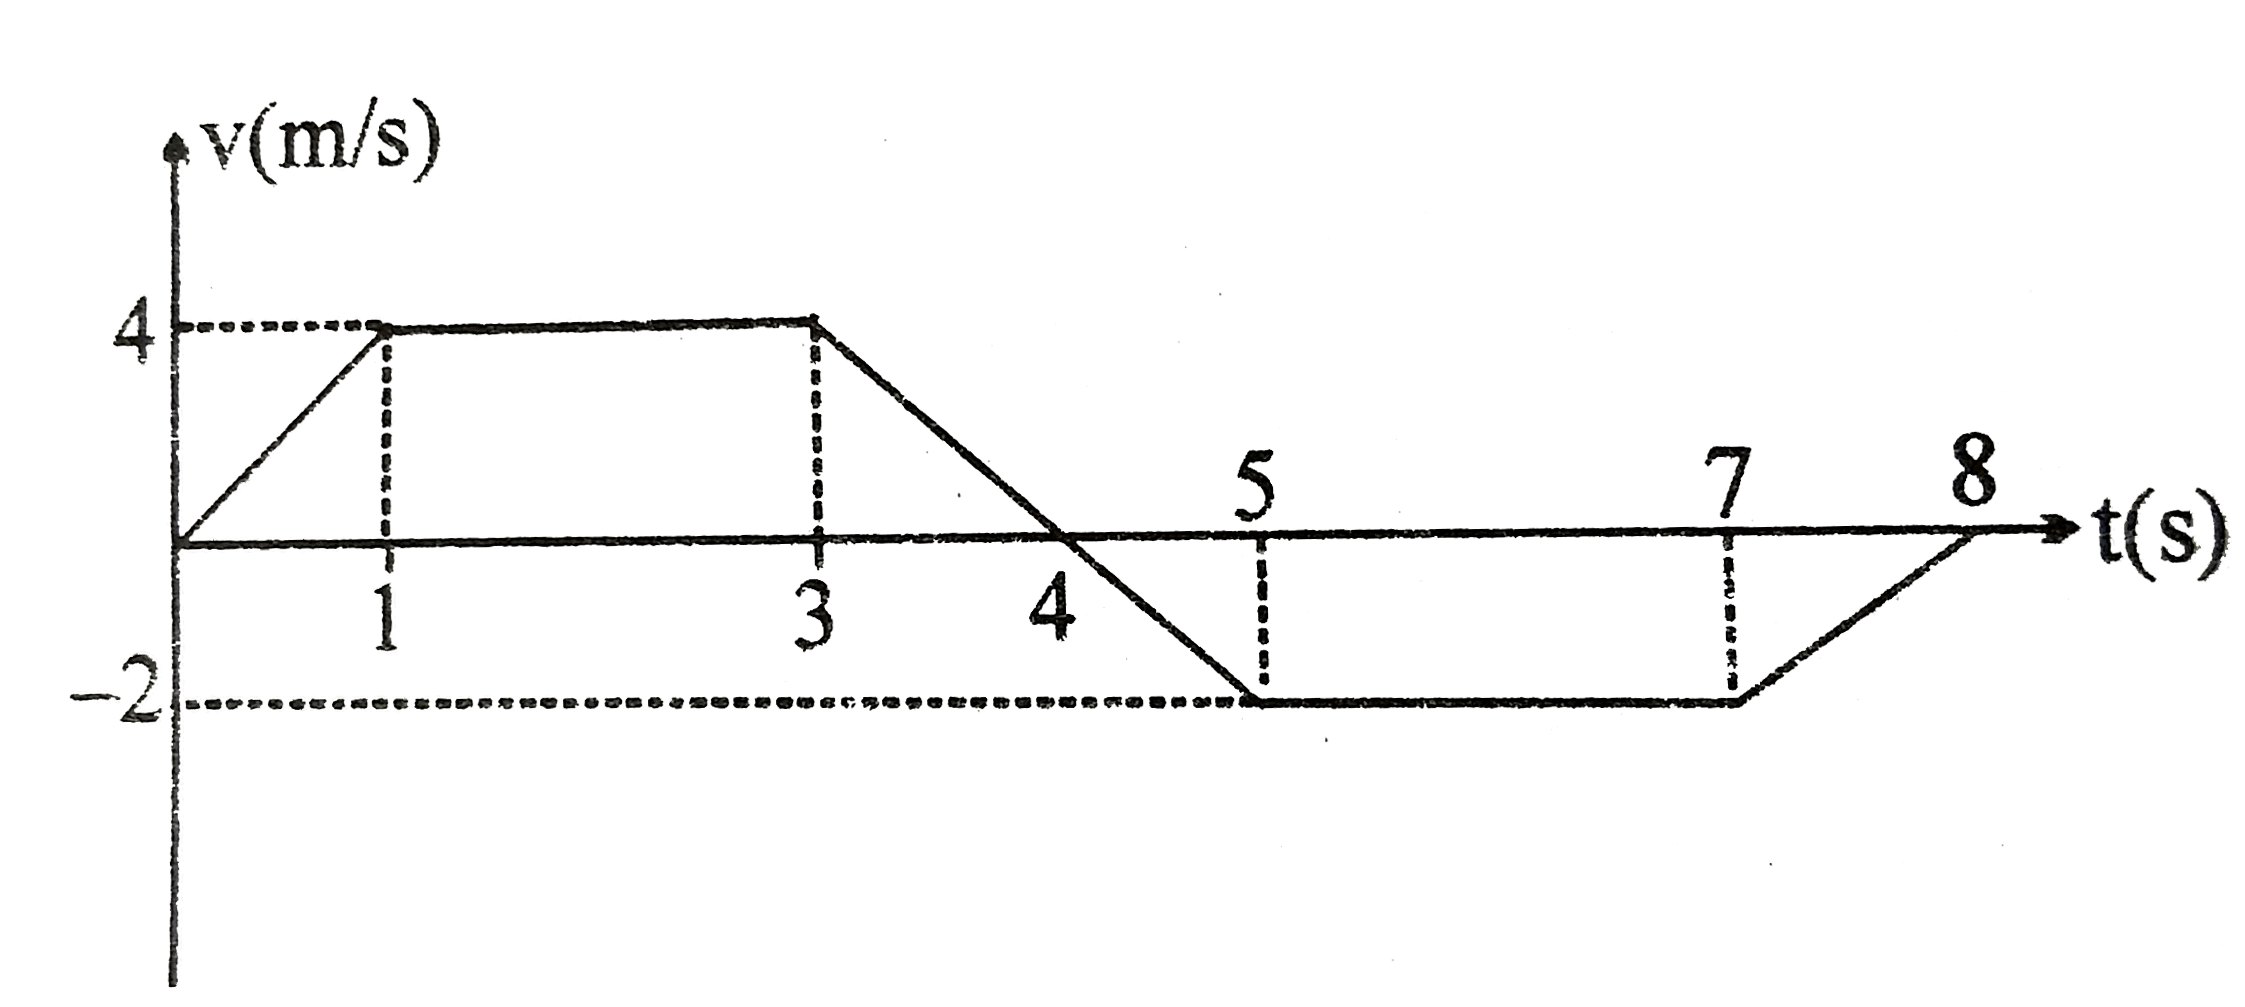
The velocity-time graph of a linear motion is shown below. The distance from the origin after 8 seconds is :
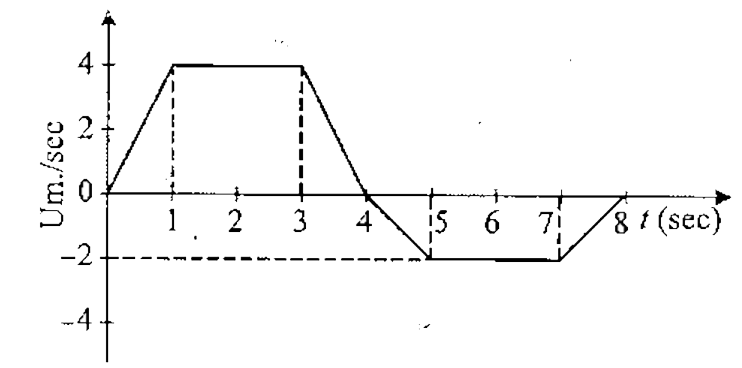 A18 mB16 mC8 mD6 m
The velocity time graph of a linear motion is shown in the figure. The distance from the starting point after 8 seconds will be
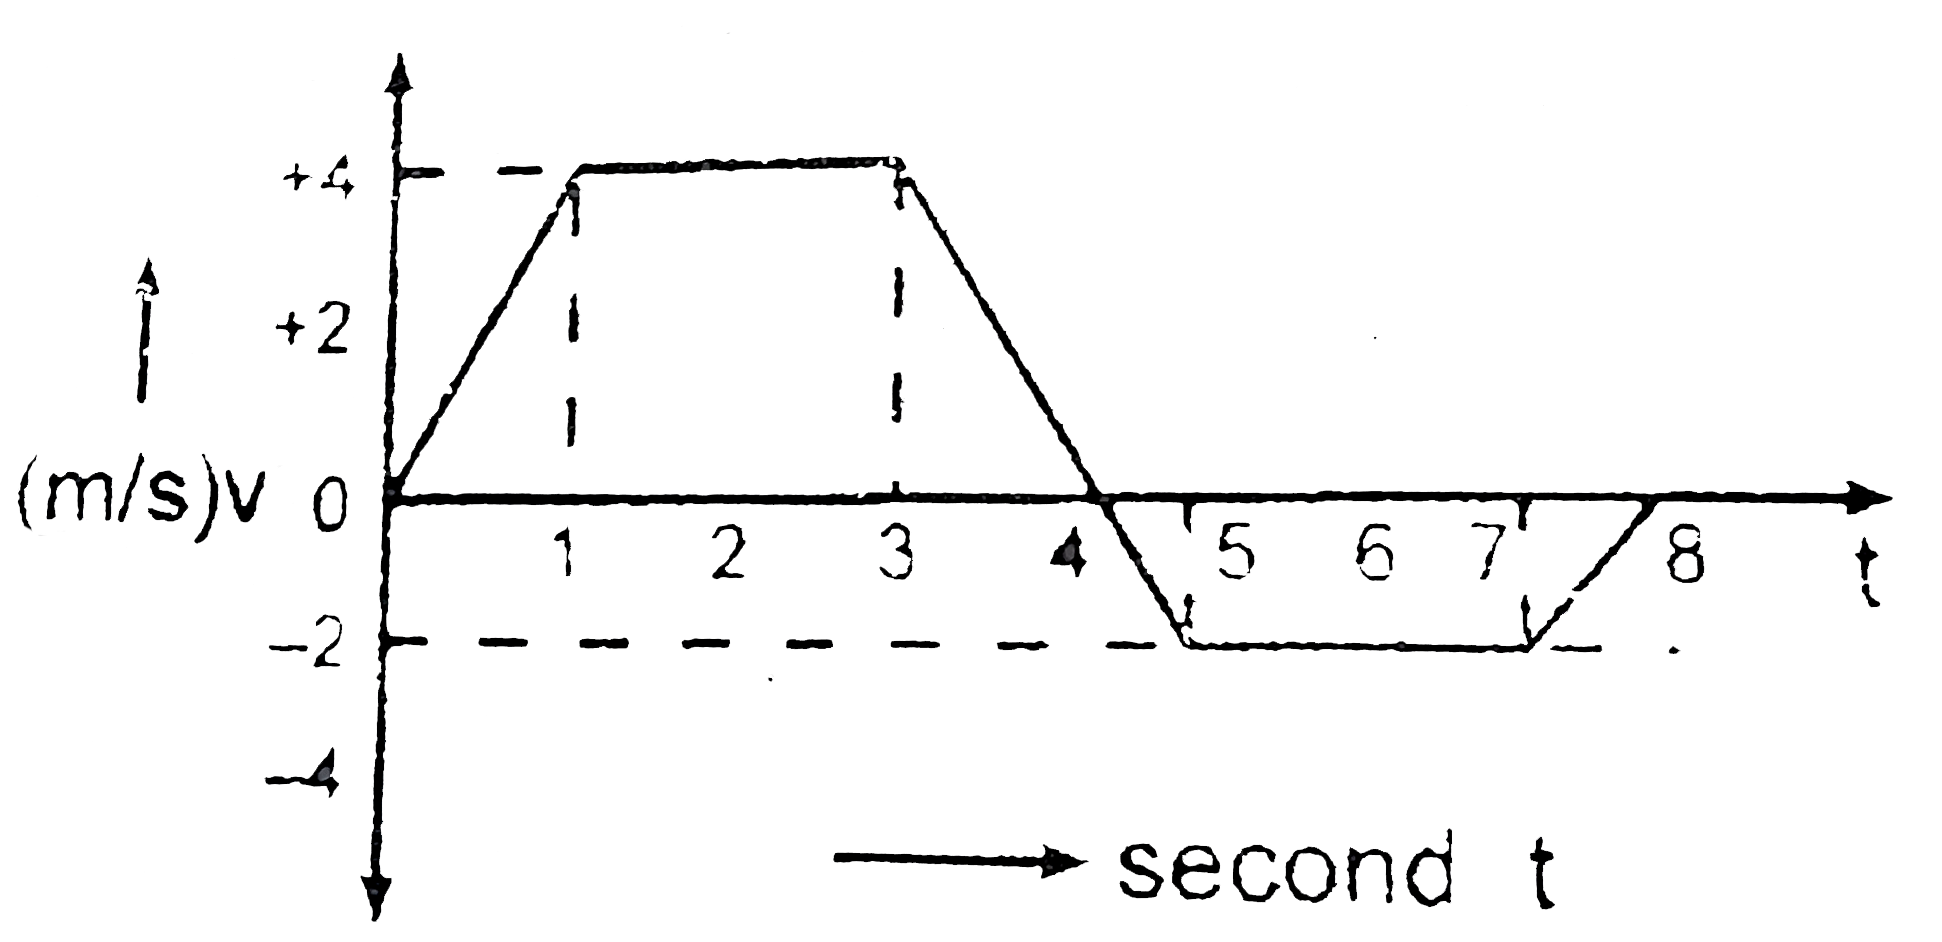 .A18 mB6 mC8 mDnone of these
For the displacement-time graph shown in figure, the ratio of the magnitudes of the speeds during the first two second and the next four second is
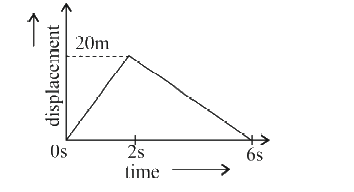 A1:1B2:1C1:2D3:2
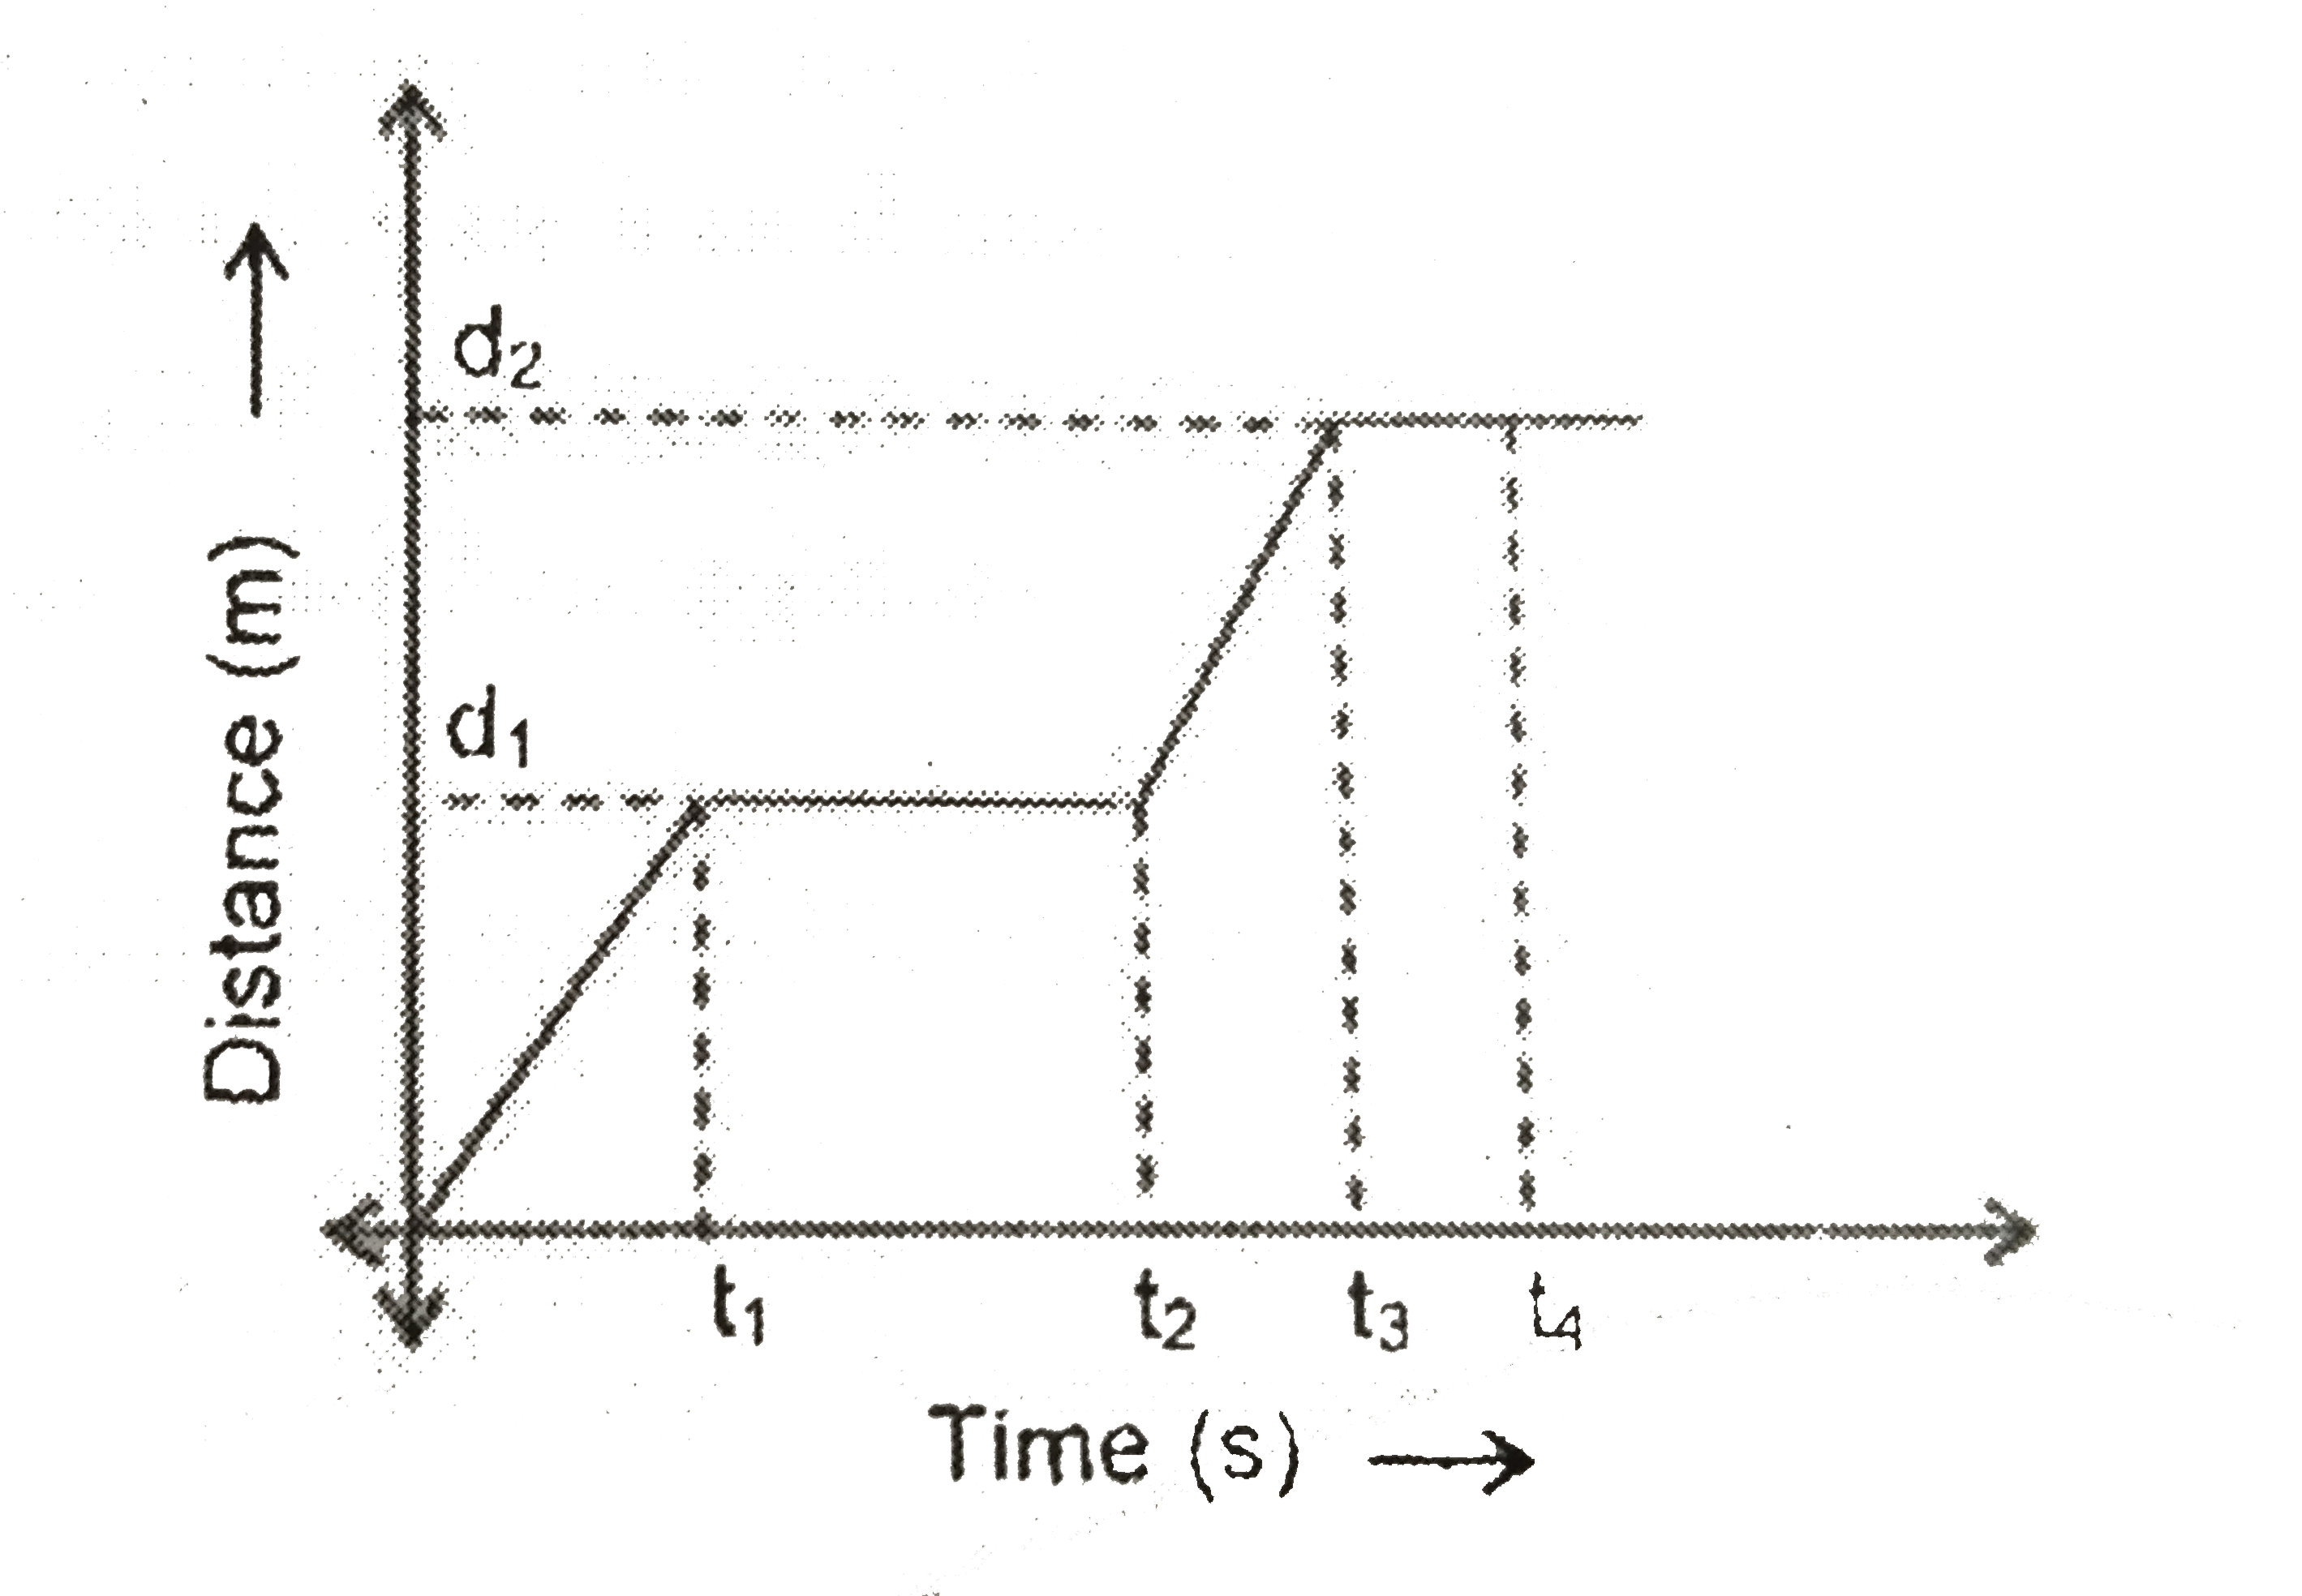
The distance -time graph of a body moving in a straight line is shown below. Draw the speed time graph of the motion of the body.
View SolutionThe velocity-time graph shows the motion of a cyclist. Find (i) its acceleration (ii) its velocity and (iii) the distance covered by the cyclist in 15 seconds.
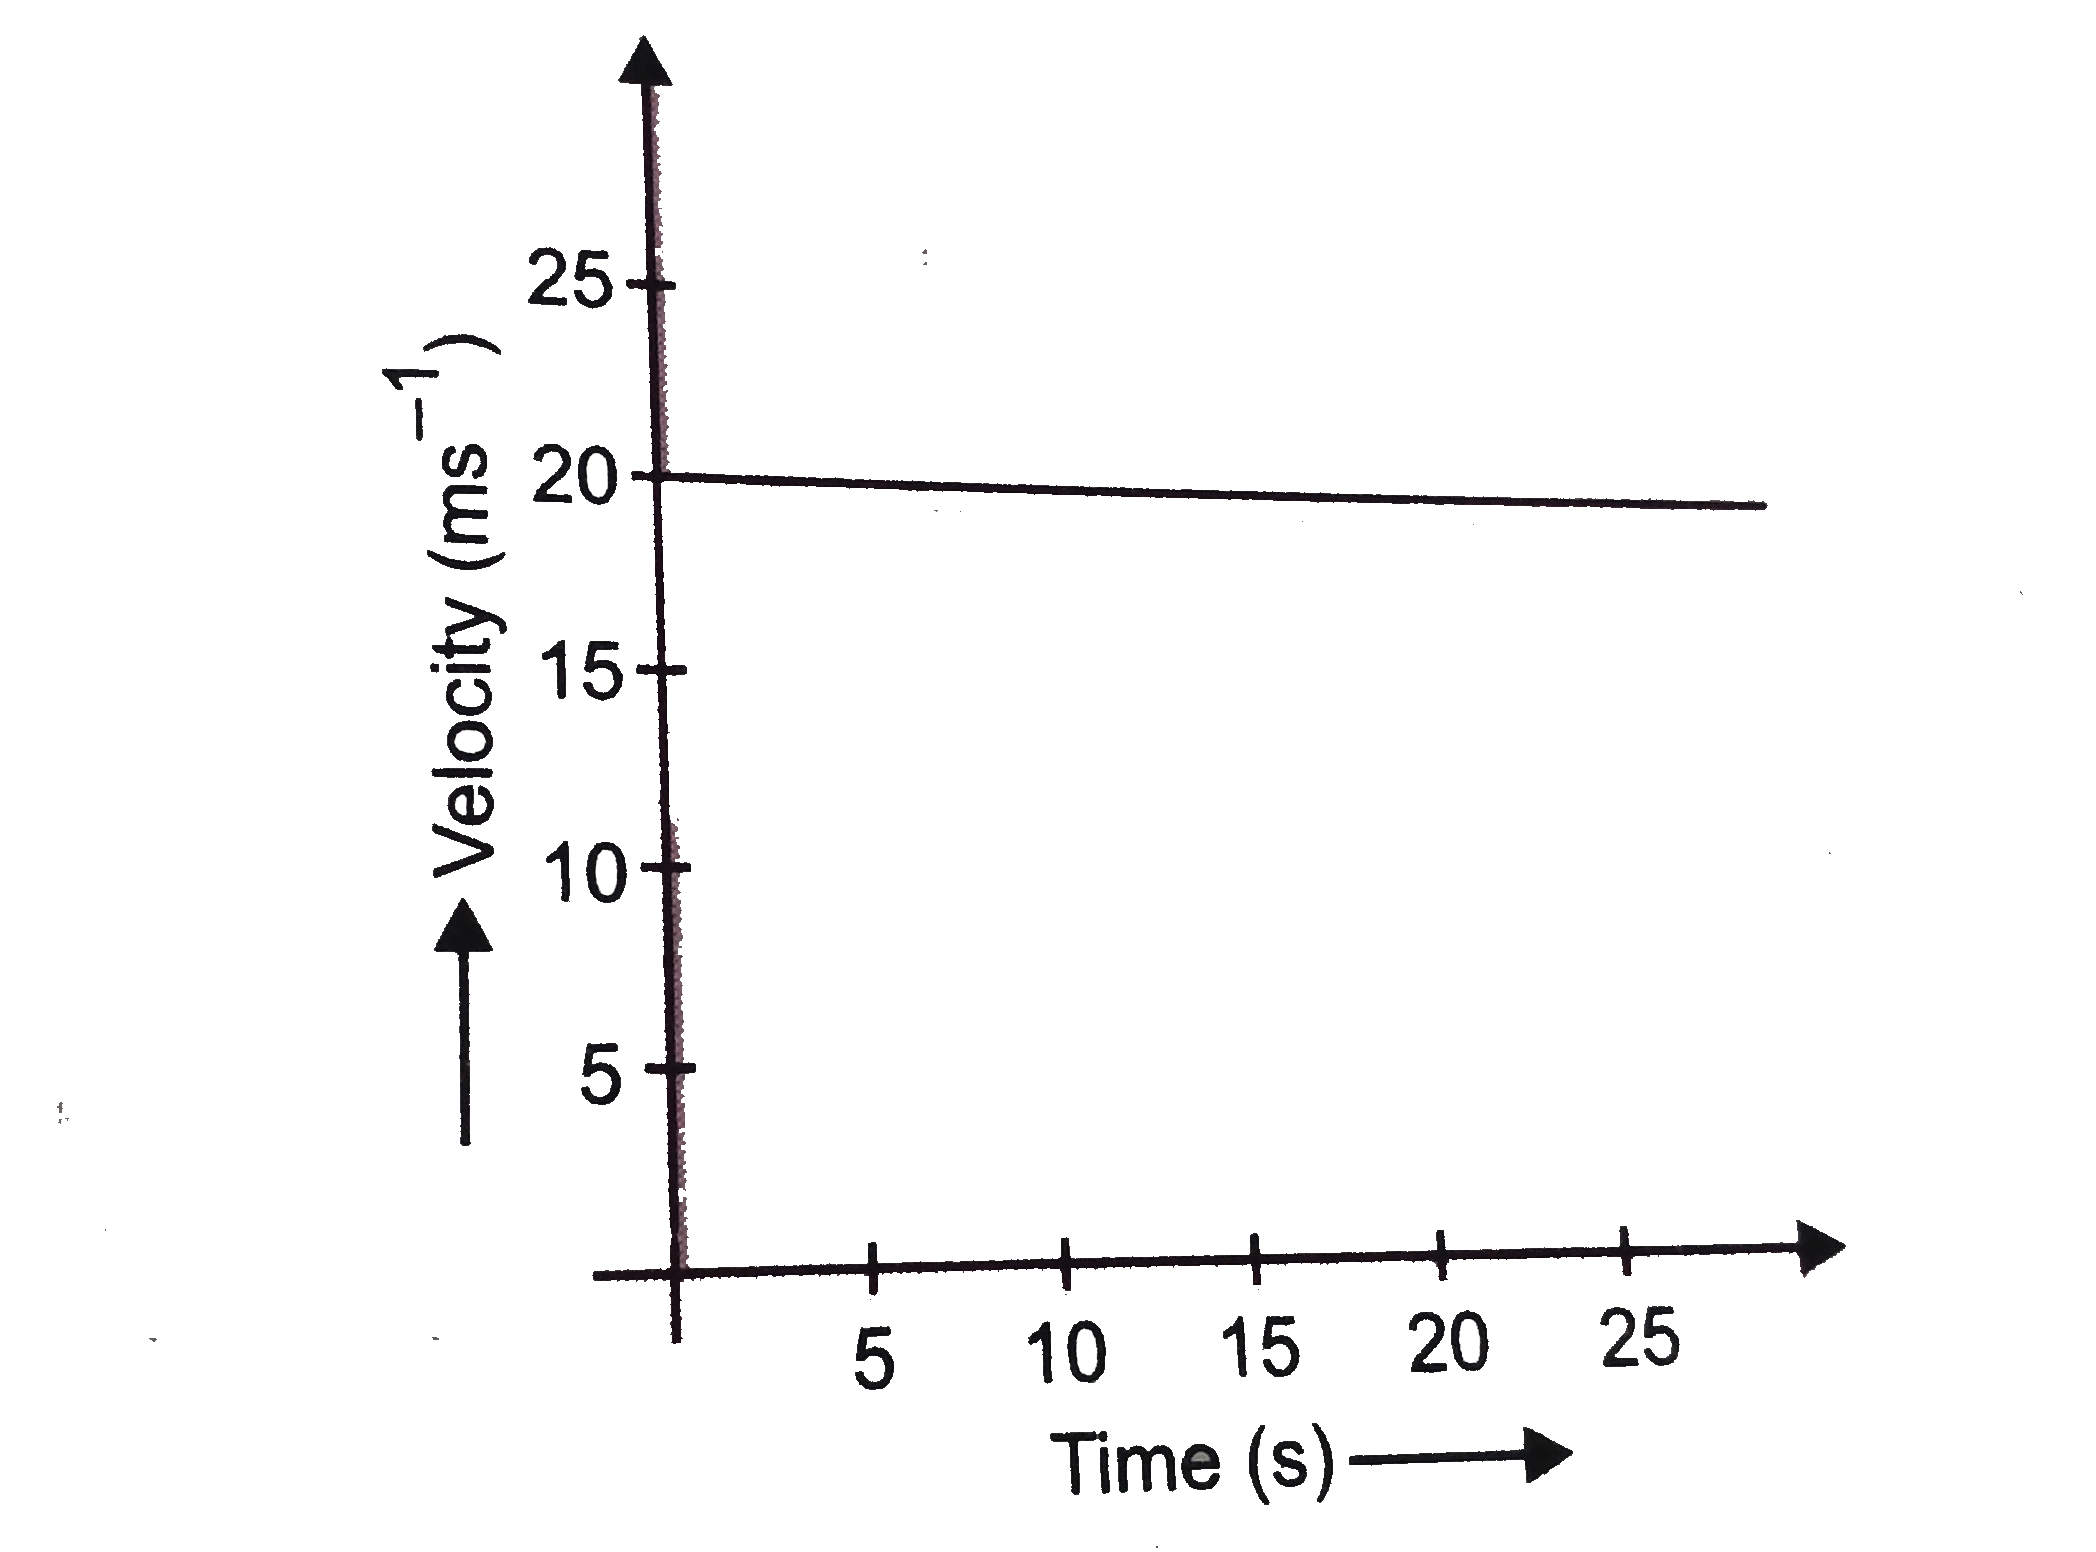
View SolutionThe velocity-time graph shows the motion of a cyclist. Find (i) its acceleration (ii) its velocity and (iii) the distance covered by the cyclist in 15 seconds.

View SolutionThe velocity-time graph of a linear motion is shown below. Find the (a) displacement and distance from the origin after 8s. (b) acceleration in the first second. (c) deceleration during the 5th second. (d) maximum speed during the motion.
View SolutionFor the displacement-time graph shown in figure, the ratio of the magnitudes of the speeds during the first two second and the next four second is

View Solution
