A speed-time (v-t) graph of an object is shown in the figure
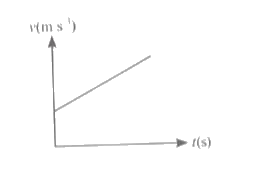
which of the following best describes the graph?
the object drops through vacuum
the object drops through air.
the object is being thrown downwards through vacuum.
the object is being thrown downwards through air.
The correct Answer is:C
The initial velocity of the object is non-zero. After that its velocity increases along a straight line due to gravity acting on it i.e., it has been thrown downwards through vacuum.
Topper's Solved these Questions
- NSO QUESTION PAPER 2018- 19 SET - BBook:SCIENCE OLYMPIAD FOUNDATION Chapter:NSO QUESTION PAPER 2018- 19 SET - BExercise:ACHIEVERS SECTION
Explore 1 Video
- NSO QUESTION PAPER 2019- 20 SET - BBook:SCIENCE OLYMPIAD FOUNDATION Chapter:NSO QUESTION PAPER 2019- 20 SET - BExercise:ACHIEVERS SECTION
Explore 2 Videos
Similar Questions
Knowledge Check
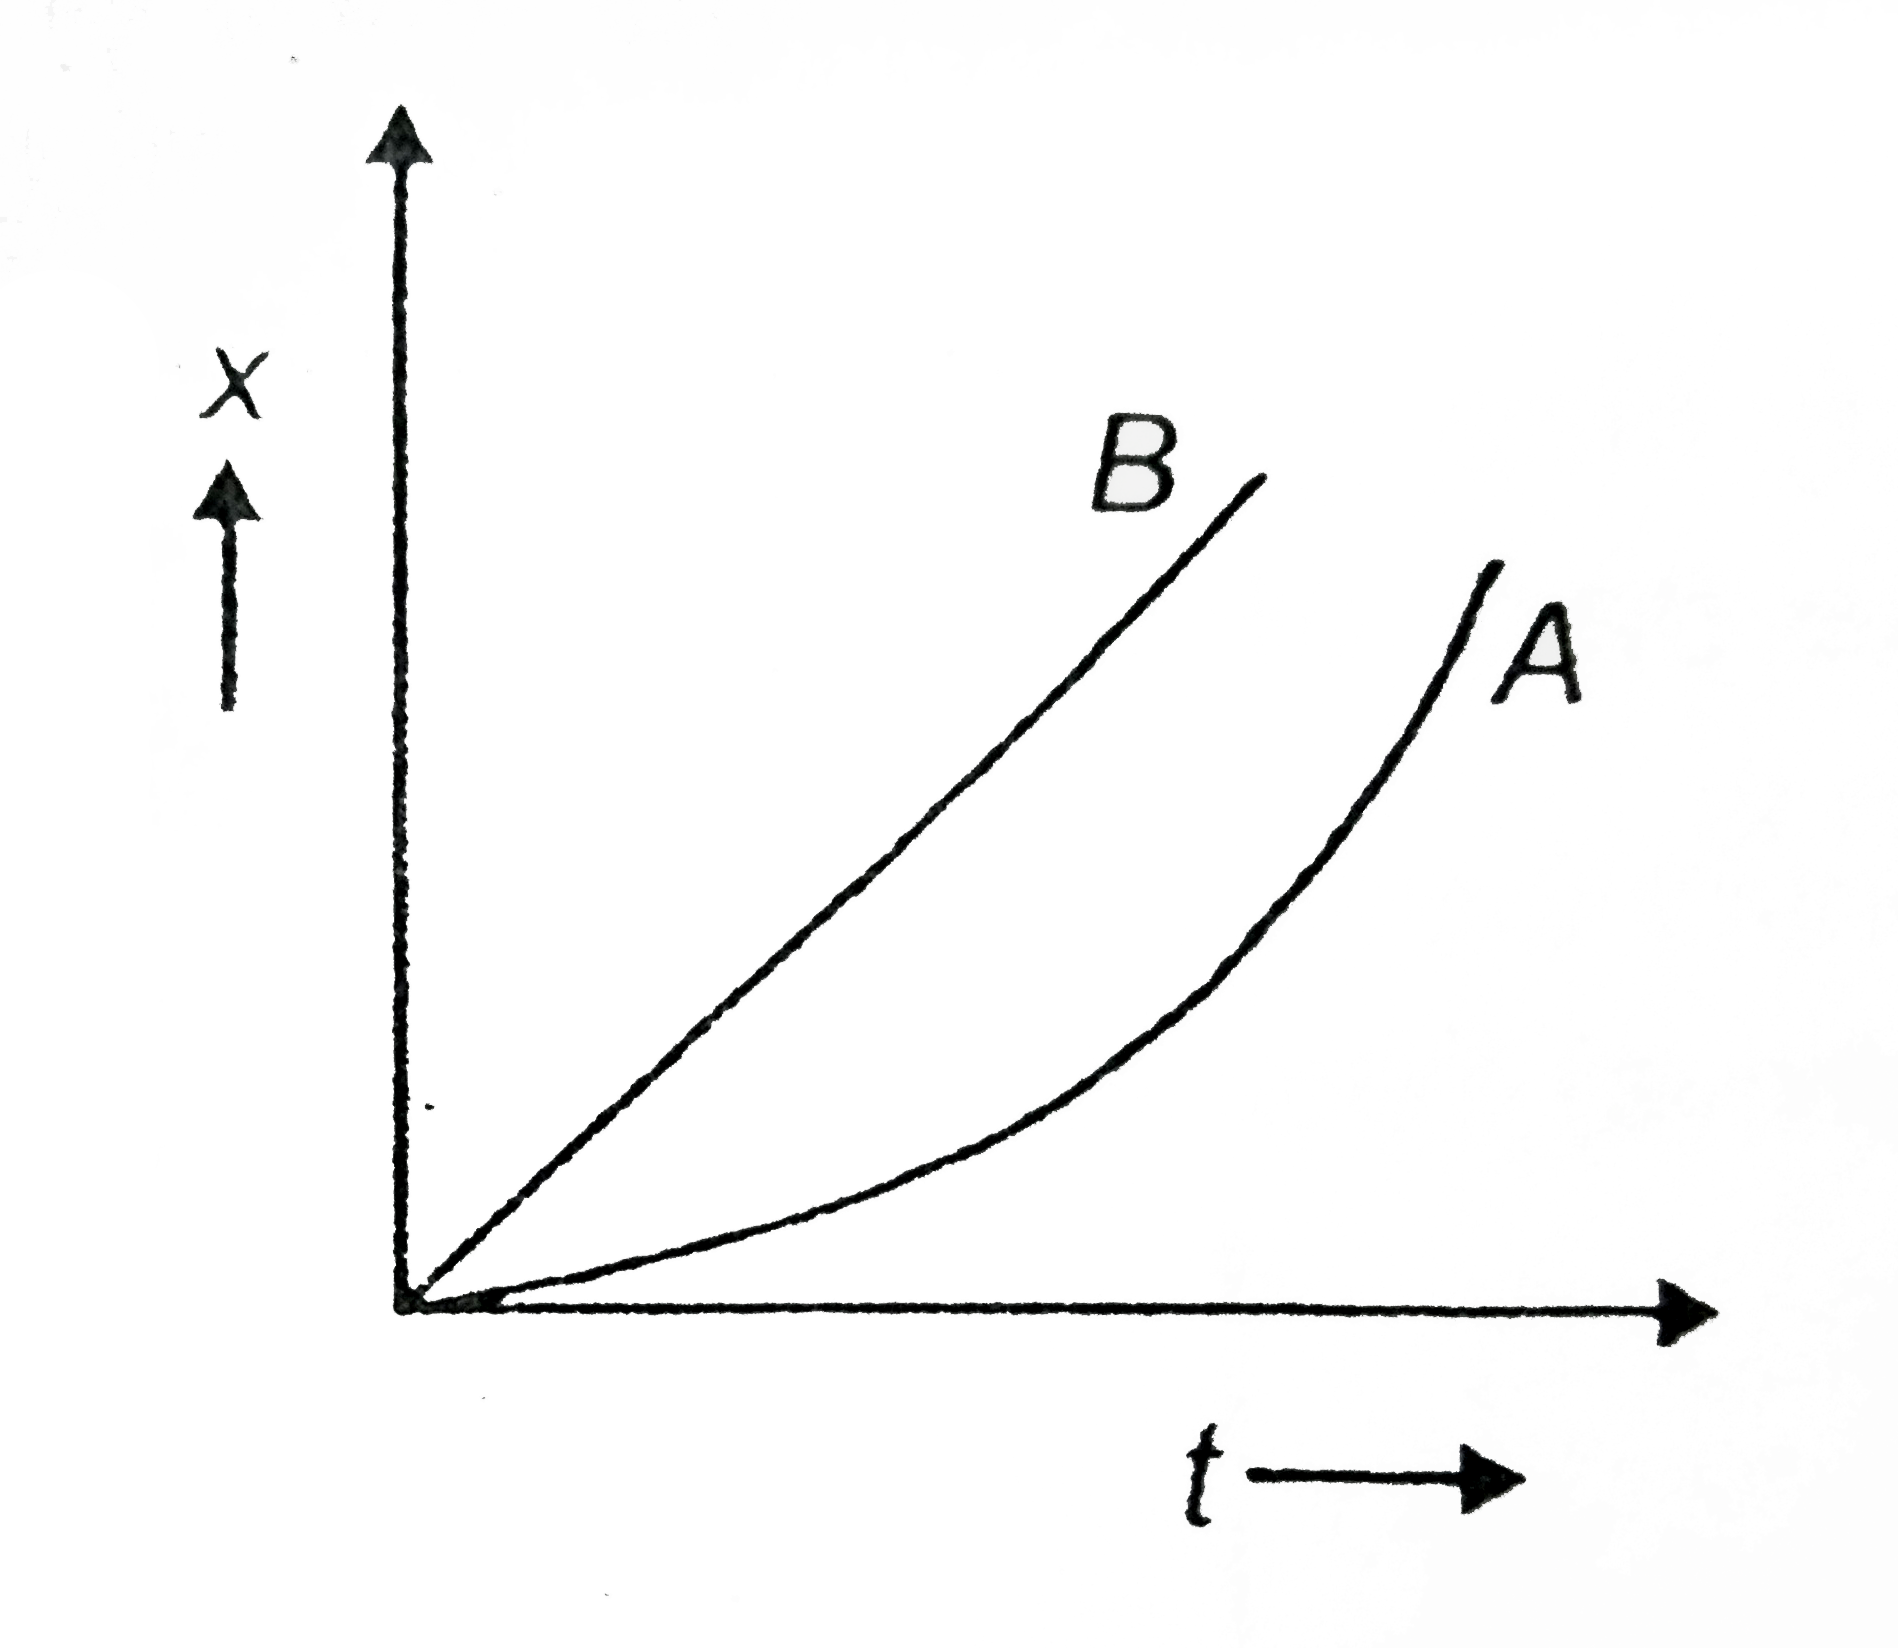
The displacement (x)-time (t) graph of a particle is shown in figure. Which of the following is correct ?
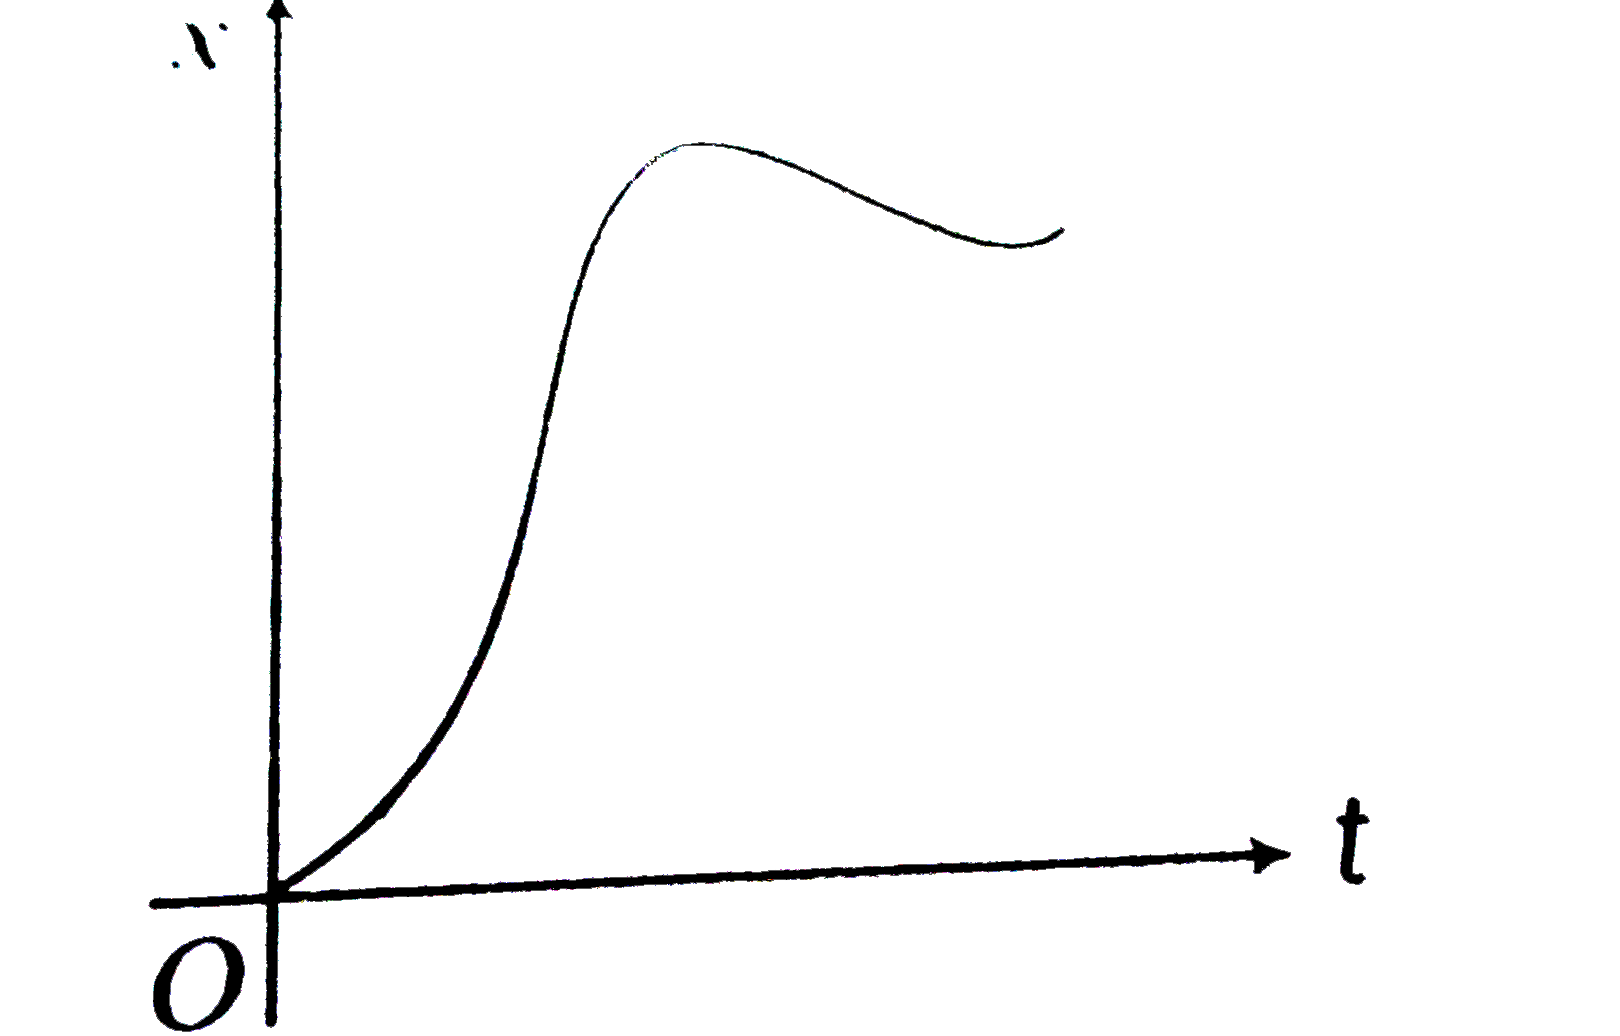 AParticle starts with zero velocity and variable accelerationBParticle starts with non-zero velocity and variable accelerationCParticle starts with zero velocity and uniform accelerationDParticle starts with non-zero velocity and uniform acceleration
The displacement (x) - time (t) graph of a particle is shown in figure. Which of the following is correct?
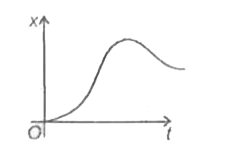 AParticle starts with zero velocity and variable accelerationBParticle starts with non - zero velocity and variable accelerationCParticle starts with zero velocity and uniform accelerationDParticle starts with non - zero velocity and uniform acceleration
The distance-time graph of an object shown in figure 2.E2.
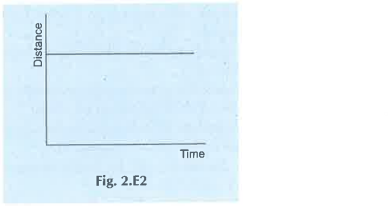
The objectAis at restBmoves with a constant speedCmoves with a constant velocityDmoves with a constant acceleration
The displacement-time graph of a particle executing simple harmonic motion is shown in the figure
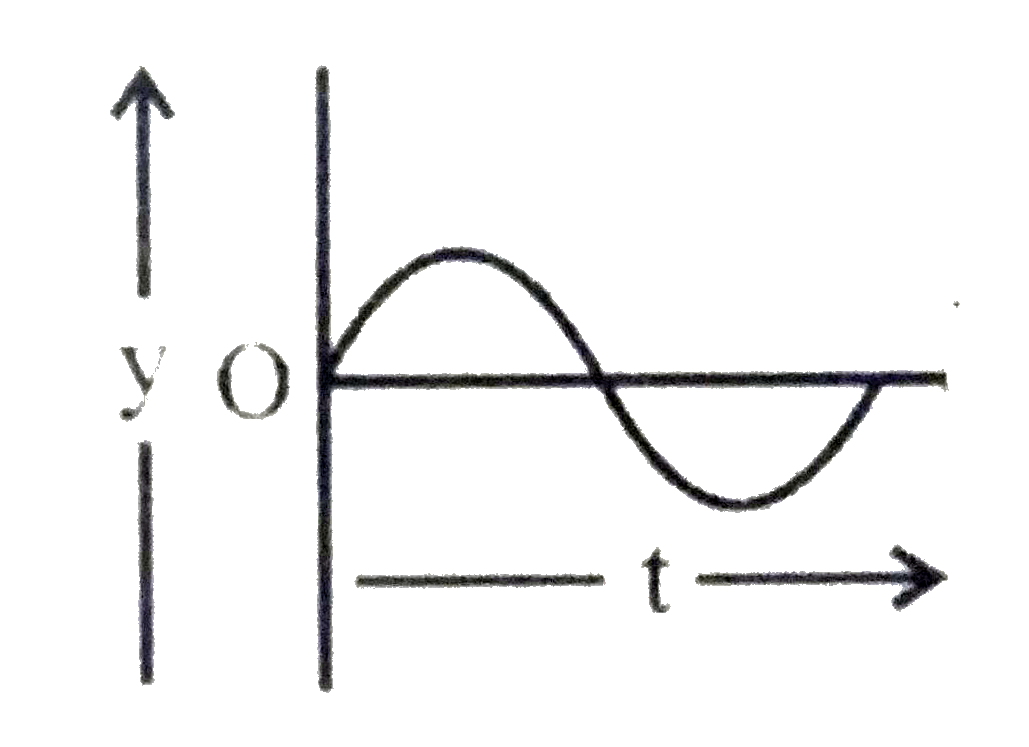
Which one of the following graphs is the correct forcetime graph for the motion of the particle ?
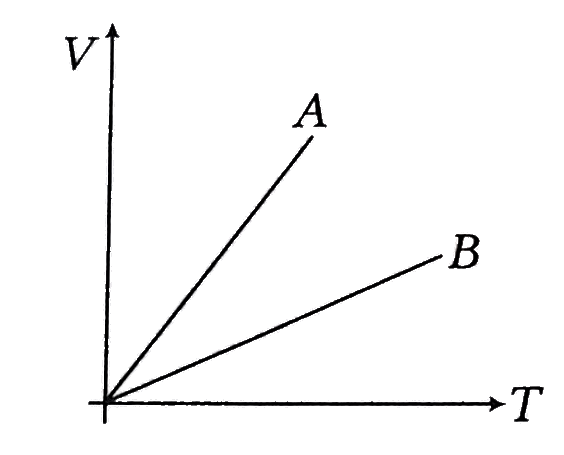
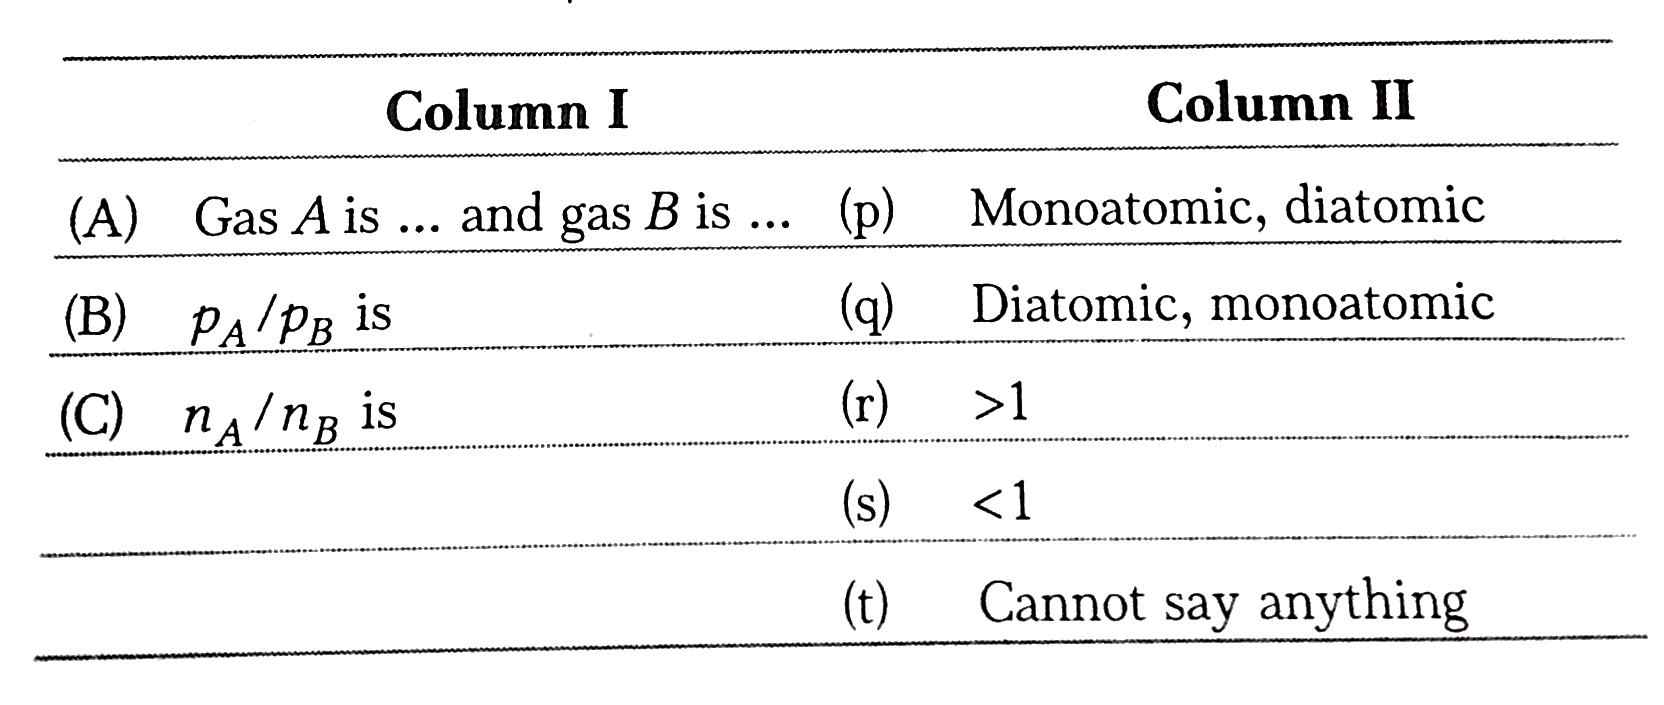
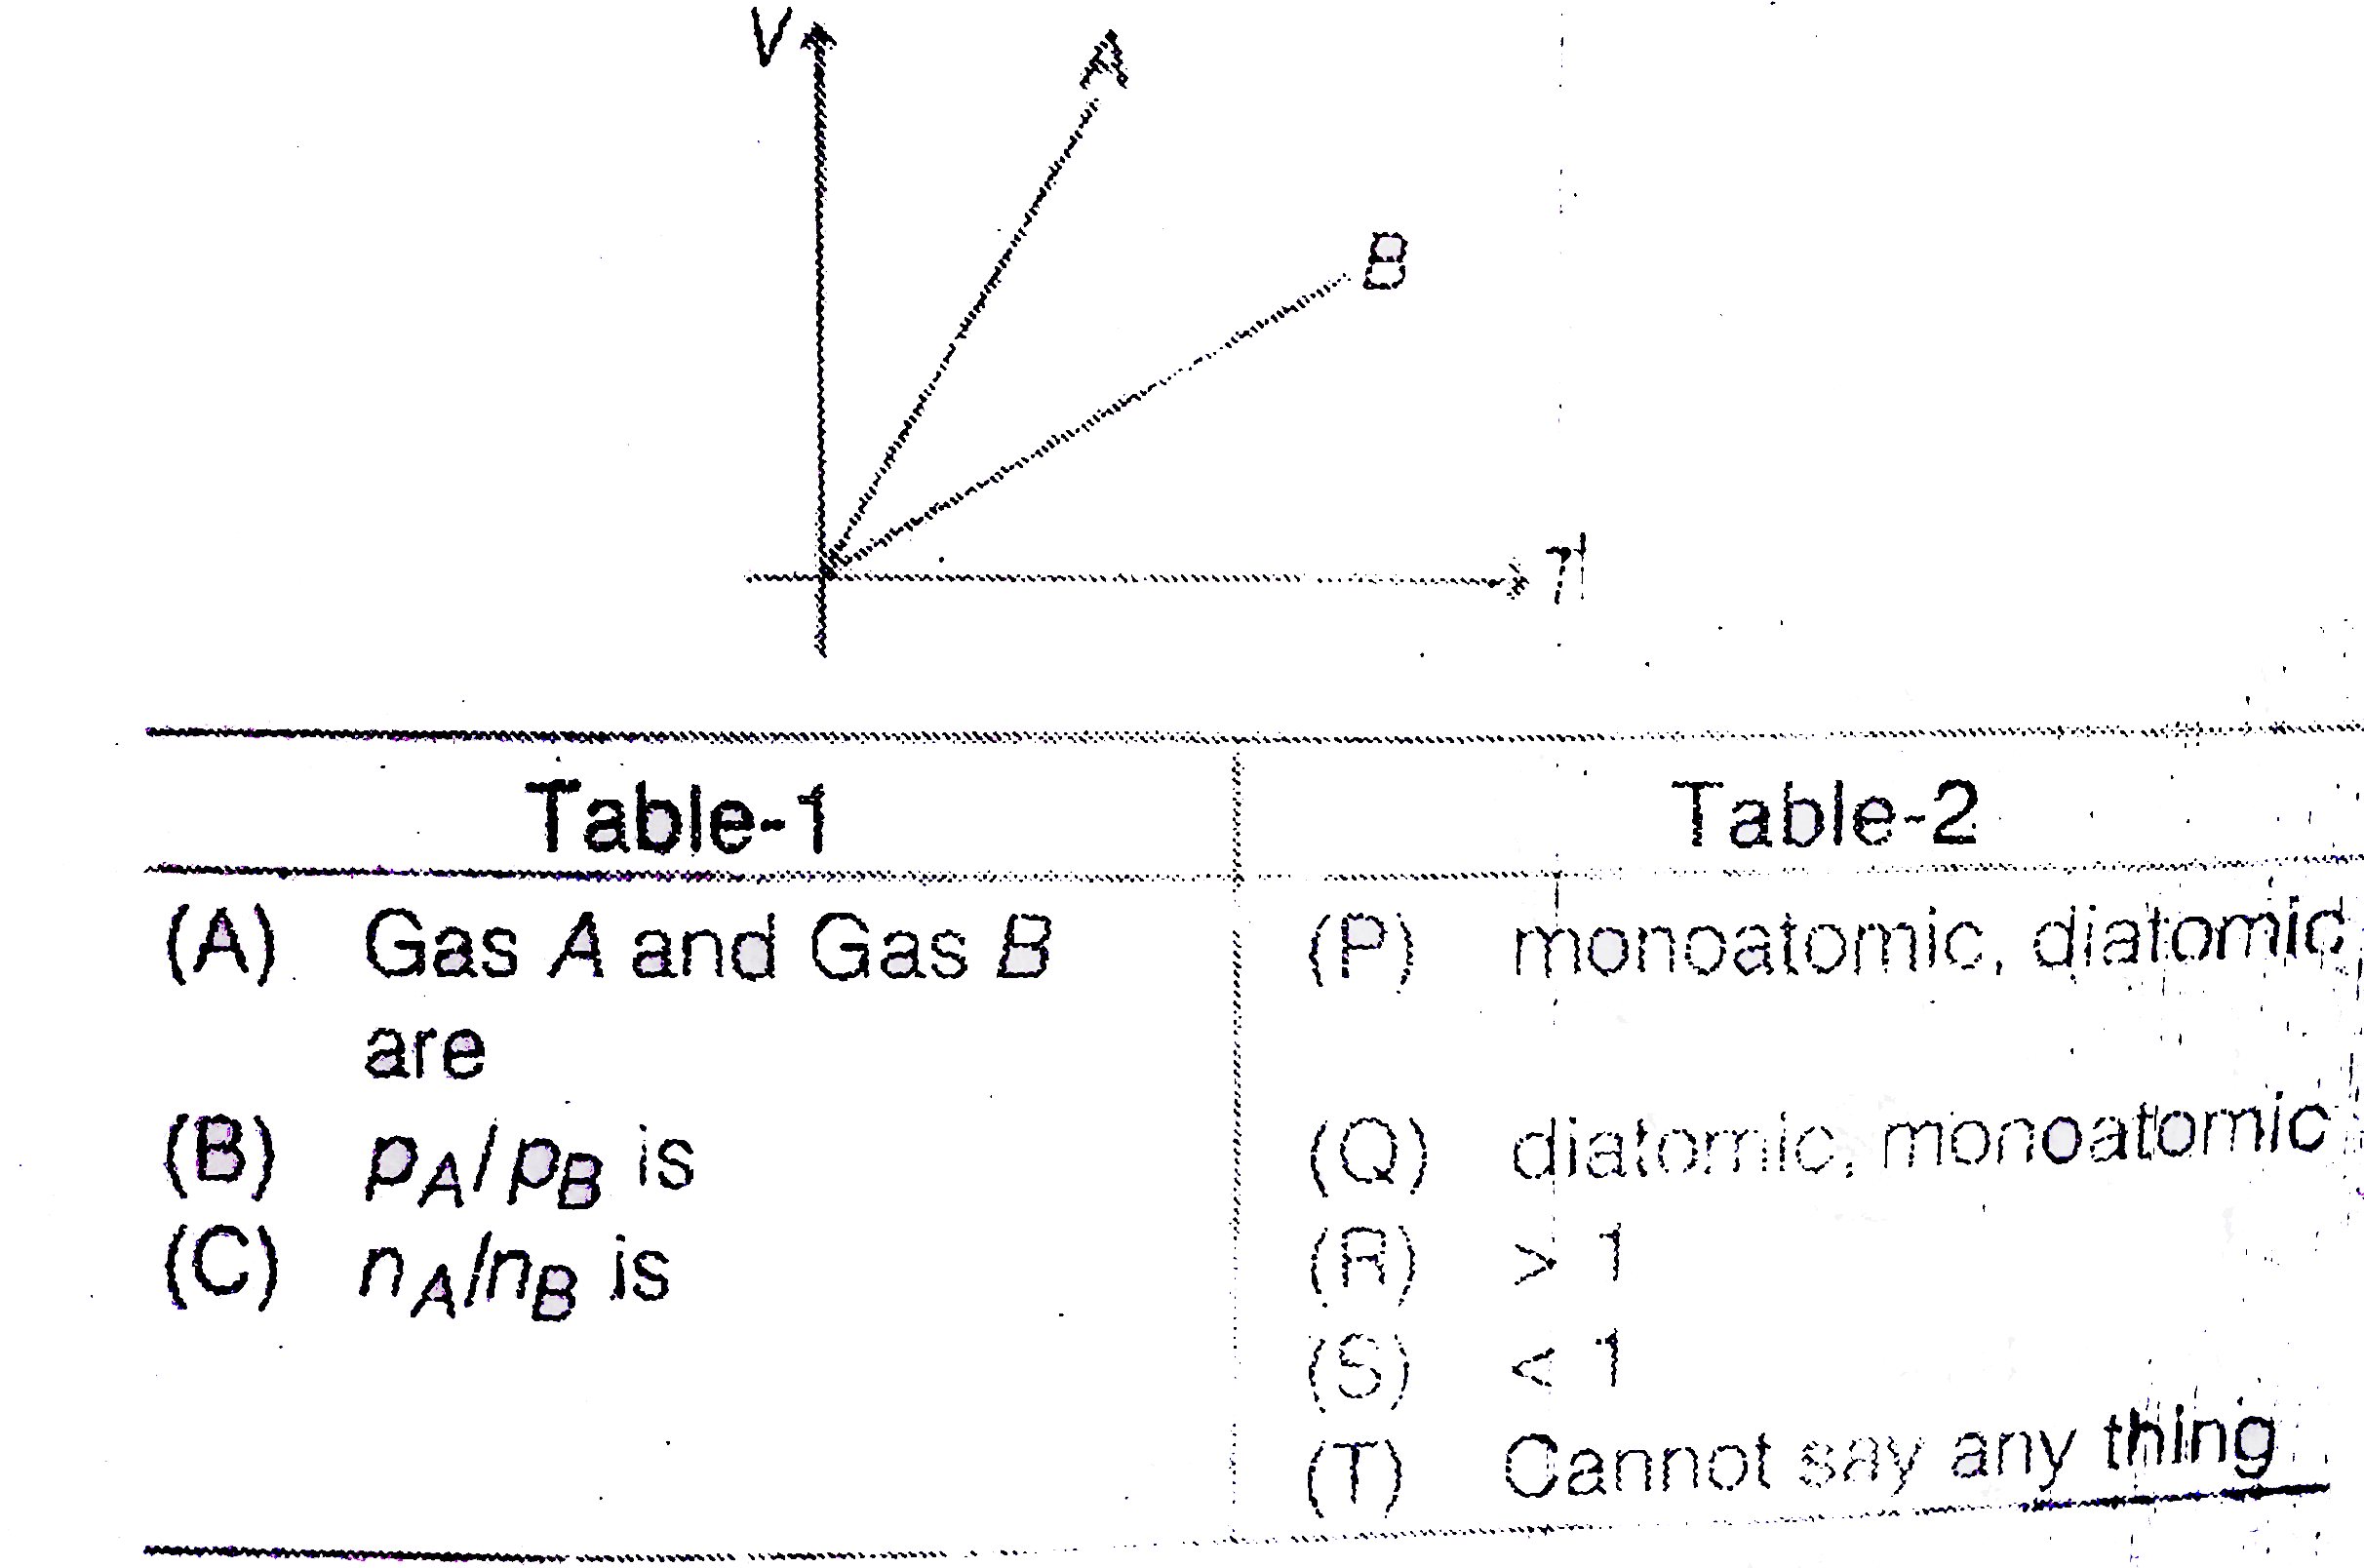
View SolutionIn the V-T graph shown in figure match the following.
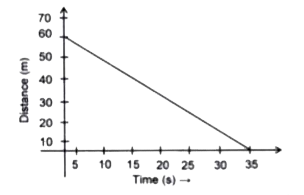
View SolutionThe distance-time graph of a moving vehicle is as shown in the figure.
View SolutionWhich of the following graphs relates V and T?
View Solution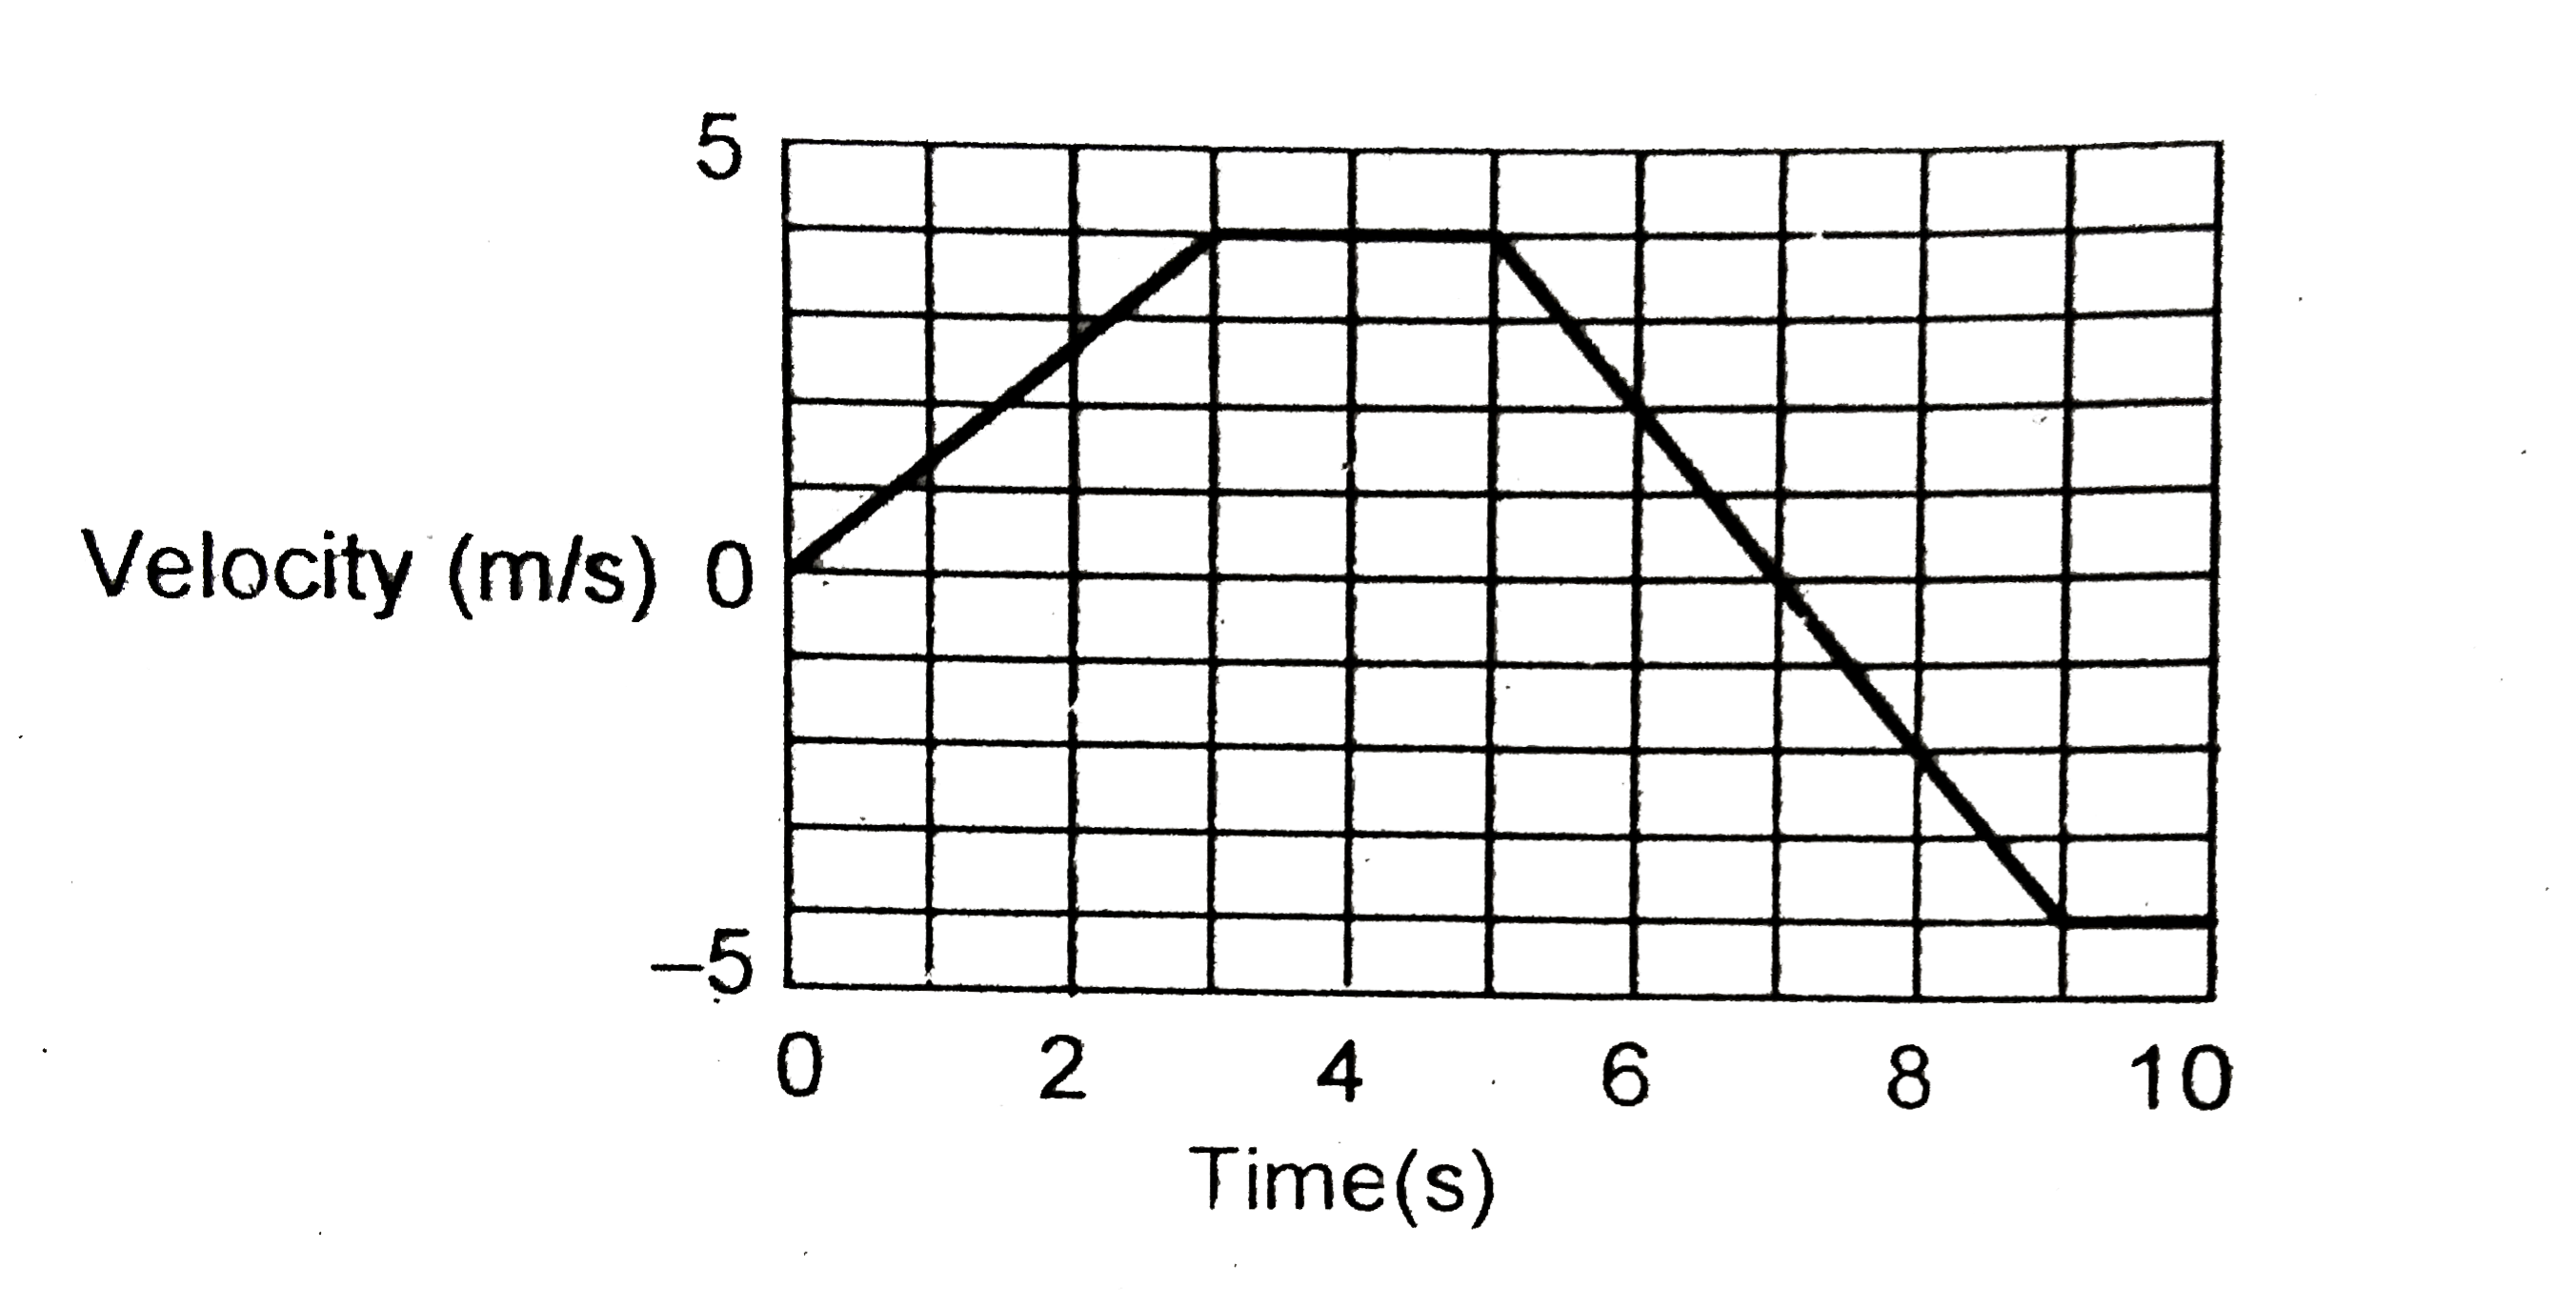
An object starts at the origin in a straight line. Its velocity versus time graph is shown in the figure. Which one of the following choices best gives the proper intervals (s) of time for which the object is moving away from the origin?
View Solution

