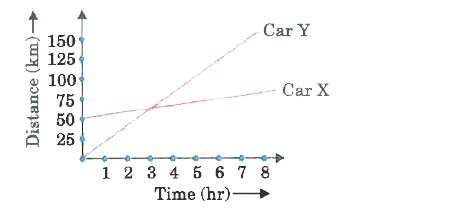
The figure given below shows the distance-time graph of the two cars, which began their journey together, in the same direction, from different points of start.
(i) find the speed of car X and Car Y.
(ii) When and where will car Y catch car X?
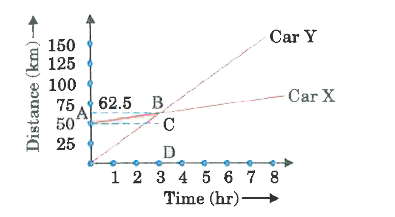
(i) Speed of X=BCAC=62.5−503−0=12.53=4.17 km/hr
Speed of Y=BDCD=62.5−03−0=20.83 km/hr
(ii) The two graphs intersect at point B, so car Y will catch car X after 3 hours and at a distancr of 62.5 km from the origin.
Topper's Solved these Questions
- BOOK - MODERN PUBLICATIONCHAPTER - MOTION IN A STRAIGHT LINE EXERCISE - PRACTICE PROBLEMS28videos
MOTION IN A STRAIGHT LINE
- BOOK - MODERN PUBLICATIONCHAPTER - MOTION IN A STRAIGHT LINE EXERCISE - CONCEPTUAL QUESTIONS14videos
MOTION IN A STRAIGHT LINE
- BOOK - MODERN PUBLICATIONCHAPTER - MOTION IN A PLANE EXERCISE - Chapter Practice Test15videos
MOTION IN A PLANE
- BOOK - MODERN PUBLICATIONCHAPTER - OSCILLATIONS EXERCISE - Practice Test (For Board Examination)12videos
OSCILLATIONS
Similar Questions
Knowledge Check
- Question 1 - Select One
Figure given shows the distance - time graph of the motion of a car. It follows from the graph that the car is
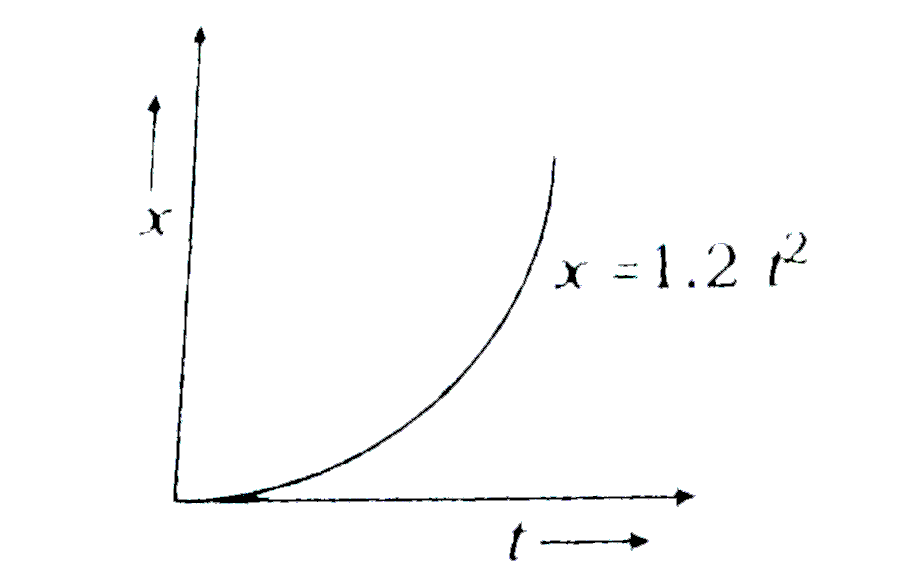 Aat restBin uniform motionCin non-uniform accelerationDuniformly accelerated
 - Question 2 - Select One
Figure shows position-time graph of two cars A and B.
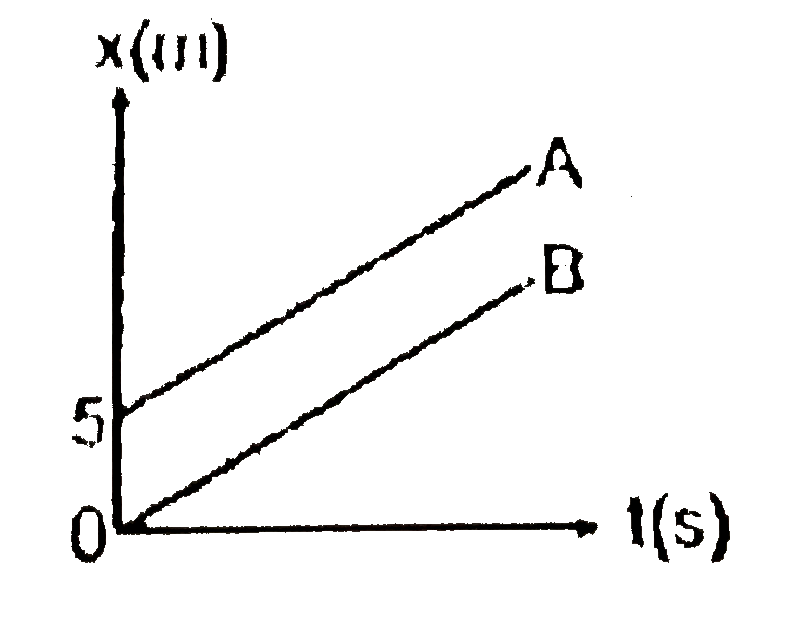 ACar A is faster than car B.BCar B is faster than car A.CBoth cars are moving with same velocity.DBoth cars have positive acceleration.
 - Question 3 - Select One
Given figure shows the distance-time graph of the motion of a car. It follows from the,| graph that the car is
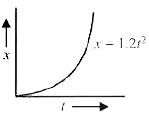 Aat restBin uniform motionCin non-uniform accclerationDunifommly accelerated.
Two cars are moving in same direction with speed of 40kmh−1 Find the relative velocity of first car with another.
View SolutionA car is travelling from city P to city Q which are 350 km apart. The line graph given below describes the distances of the car from the city P at different times .
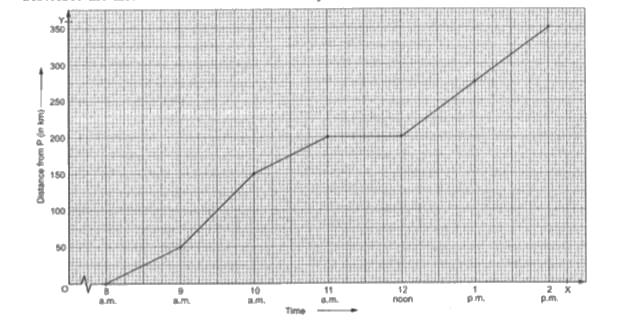
Study the above graph and answer the questions given below.
(i) What information is given on the two axes ?
(ii) From where and when did the car begin its journey ?
(iii) How far did the car go in the first hour ?
(iv) How far did the car go during (a) the 2nd hour and (b) the 3rd hour?
(v) Was the speed same during first three hours? How do you know it ?
(vi) Did the car stop for some duration at any place ? Justify your answer.
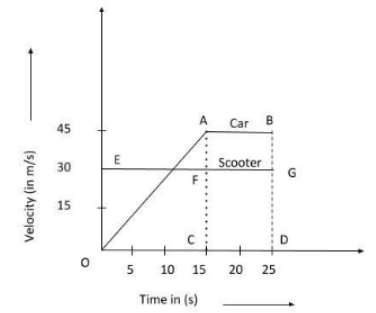
(vii) When did the car reach city Q ?View SolutionThe velocity-time graphsof a car and a scooter are shown in the figure. (i) The difference between the distance travelled by the car and the scooter in 15 and (ii) the time at which the car will catch up with the scooter are, respectively.
 View Solution
A car is traveling at a speed of 40 kmph and at the same time, another car is also traveling in the same direction at a speed of 50 kmph. Find the distance between both car after 3 hours.
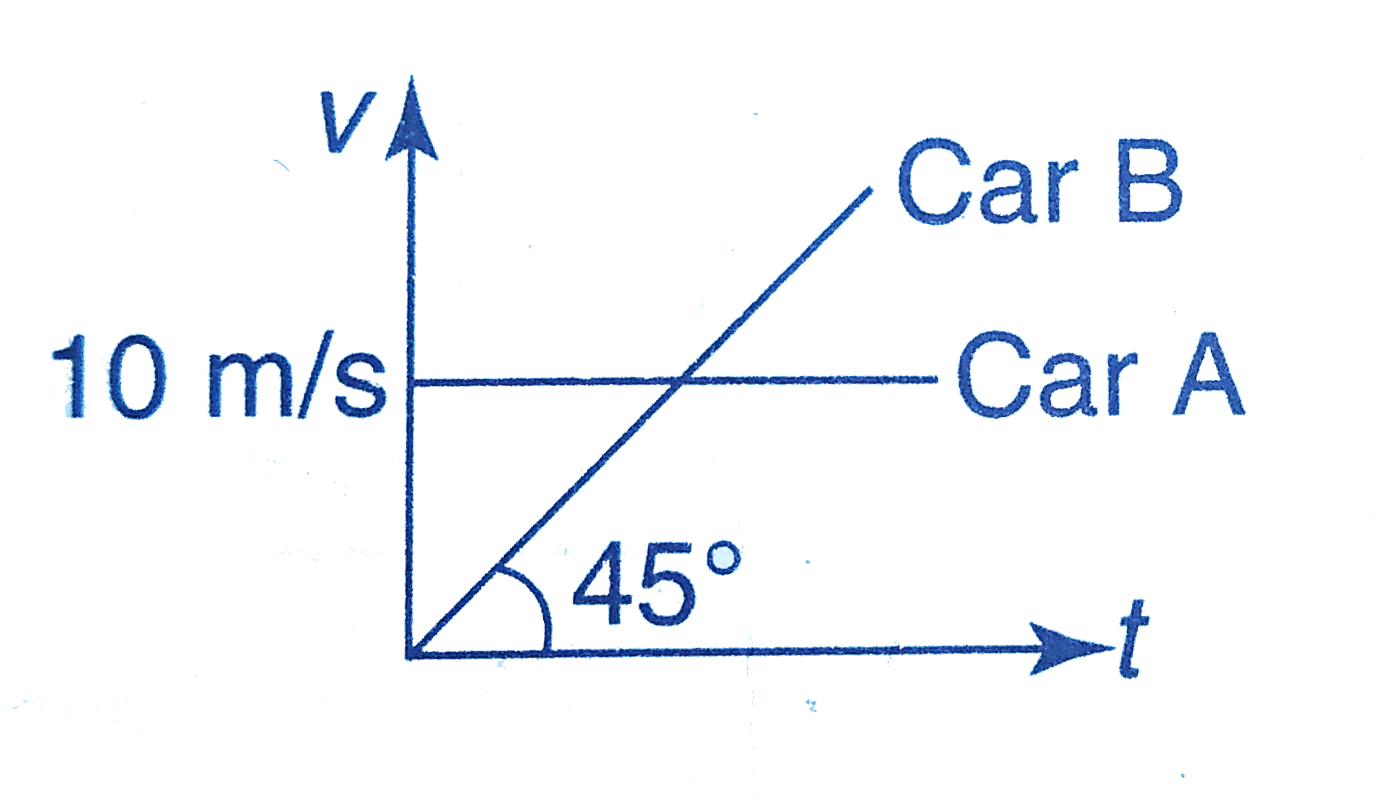
View SolutionInitially car A is 10.5m ahead of car B. Both start moving at time t=0 in the same direction along a straight line. The velocity-time graph of two cars is shown in figure. The time when the car B will catch the car A, will be.
 View Solution


