The figure shows an experimental plot for discharging of a capacitor in an R-C circuit. The time constant τ of this circuit lies between :
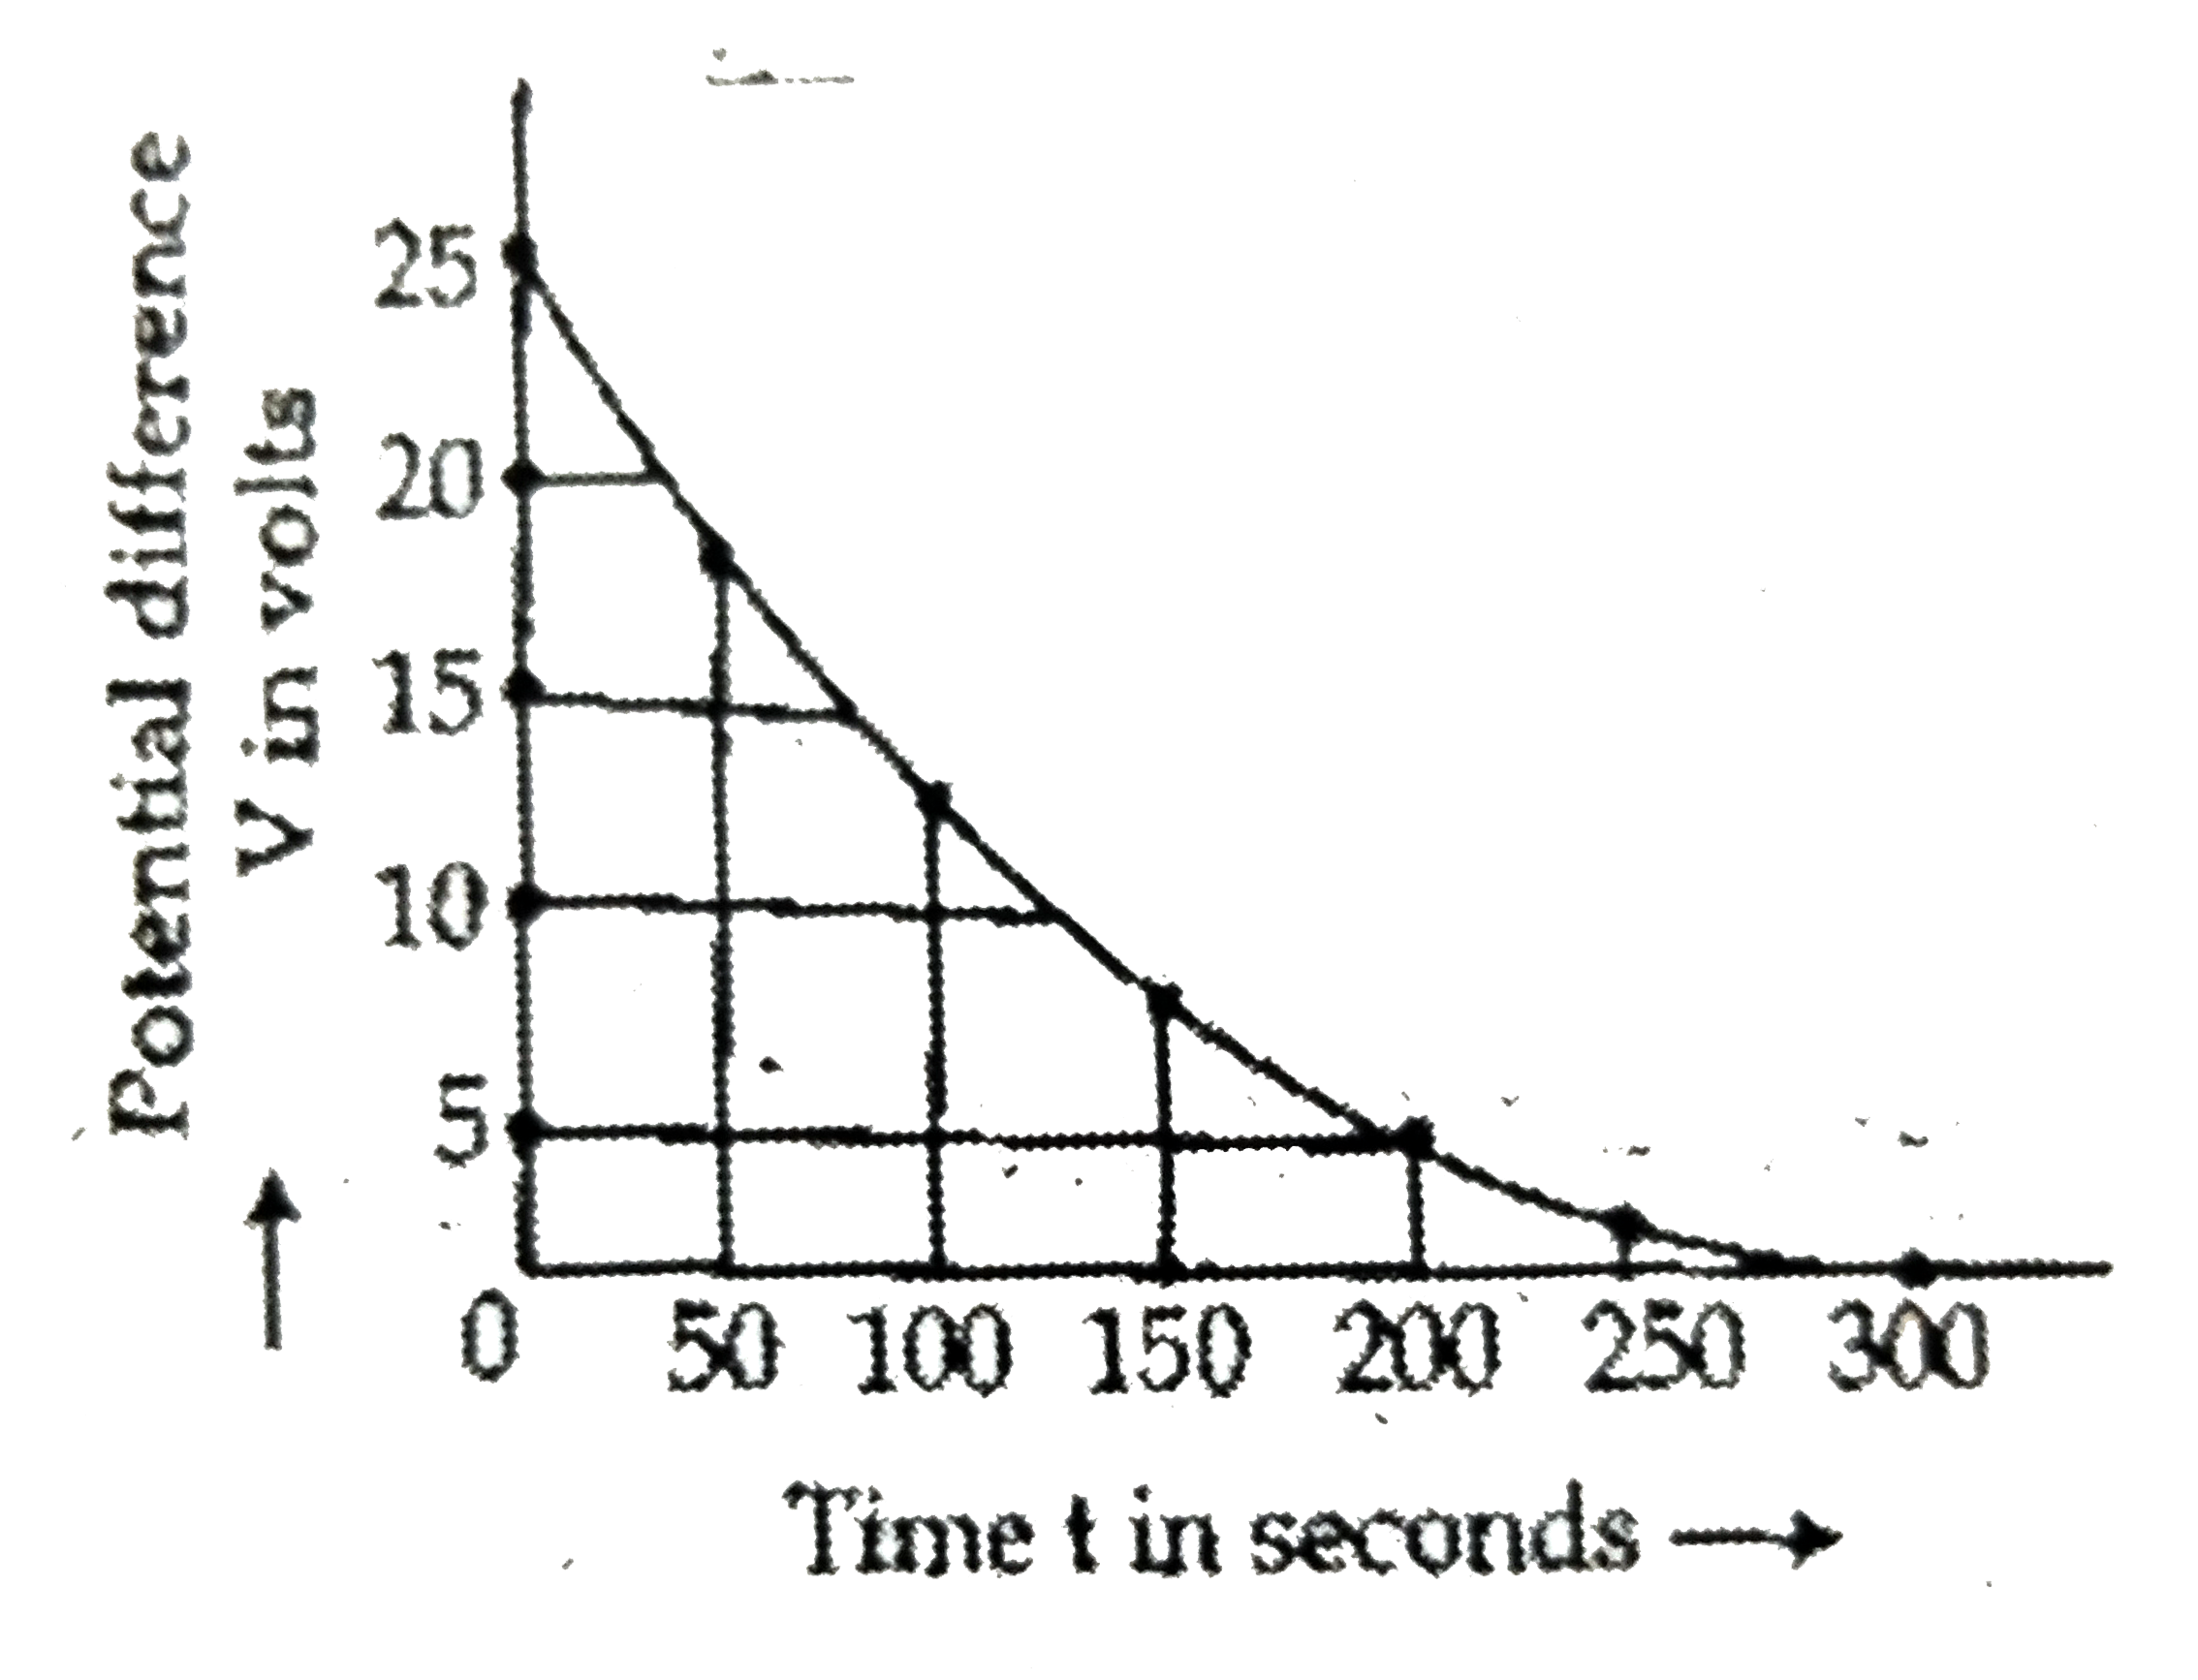
150 sec and 200 sec
0 and 50 sec
50 sec and 100 sec
100 sec and 150 sec
The correct Answer is:D
Step by step video & image solution for The figure shows an experimental plot for discharging of a capacitor in an R-C circuit. The time constant tau of this circuit lies between : by Physics experts to help you in doubts & scoring excellent marks in Class 12 exams.
Topper's Solved these Questions
- BOOK - RESONANCE ENGLISHCHAPTER - CAPACITANCEEXERCISE - High Level Problems16videos
CAPACITANCE
- BOOK - RESONANCE ENGLISHCHAPTER - CAPACITANCEEXERCISE - Exercise - 274videos
CAPACITANCE
- BOOK - RESONANCE ENGLISHCHAPTER - ATOMIC PHYSICSEXERCISE - Advanved level problems17videos
ATOMIC PHYSICS
- BOOK - RESONANCE ENGLISHCHAPTER - COMMUNICATION SYSTEMSEXERCISE - Exercise 313videos
COMMUNICATION SYSTEMS
Similar Questions
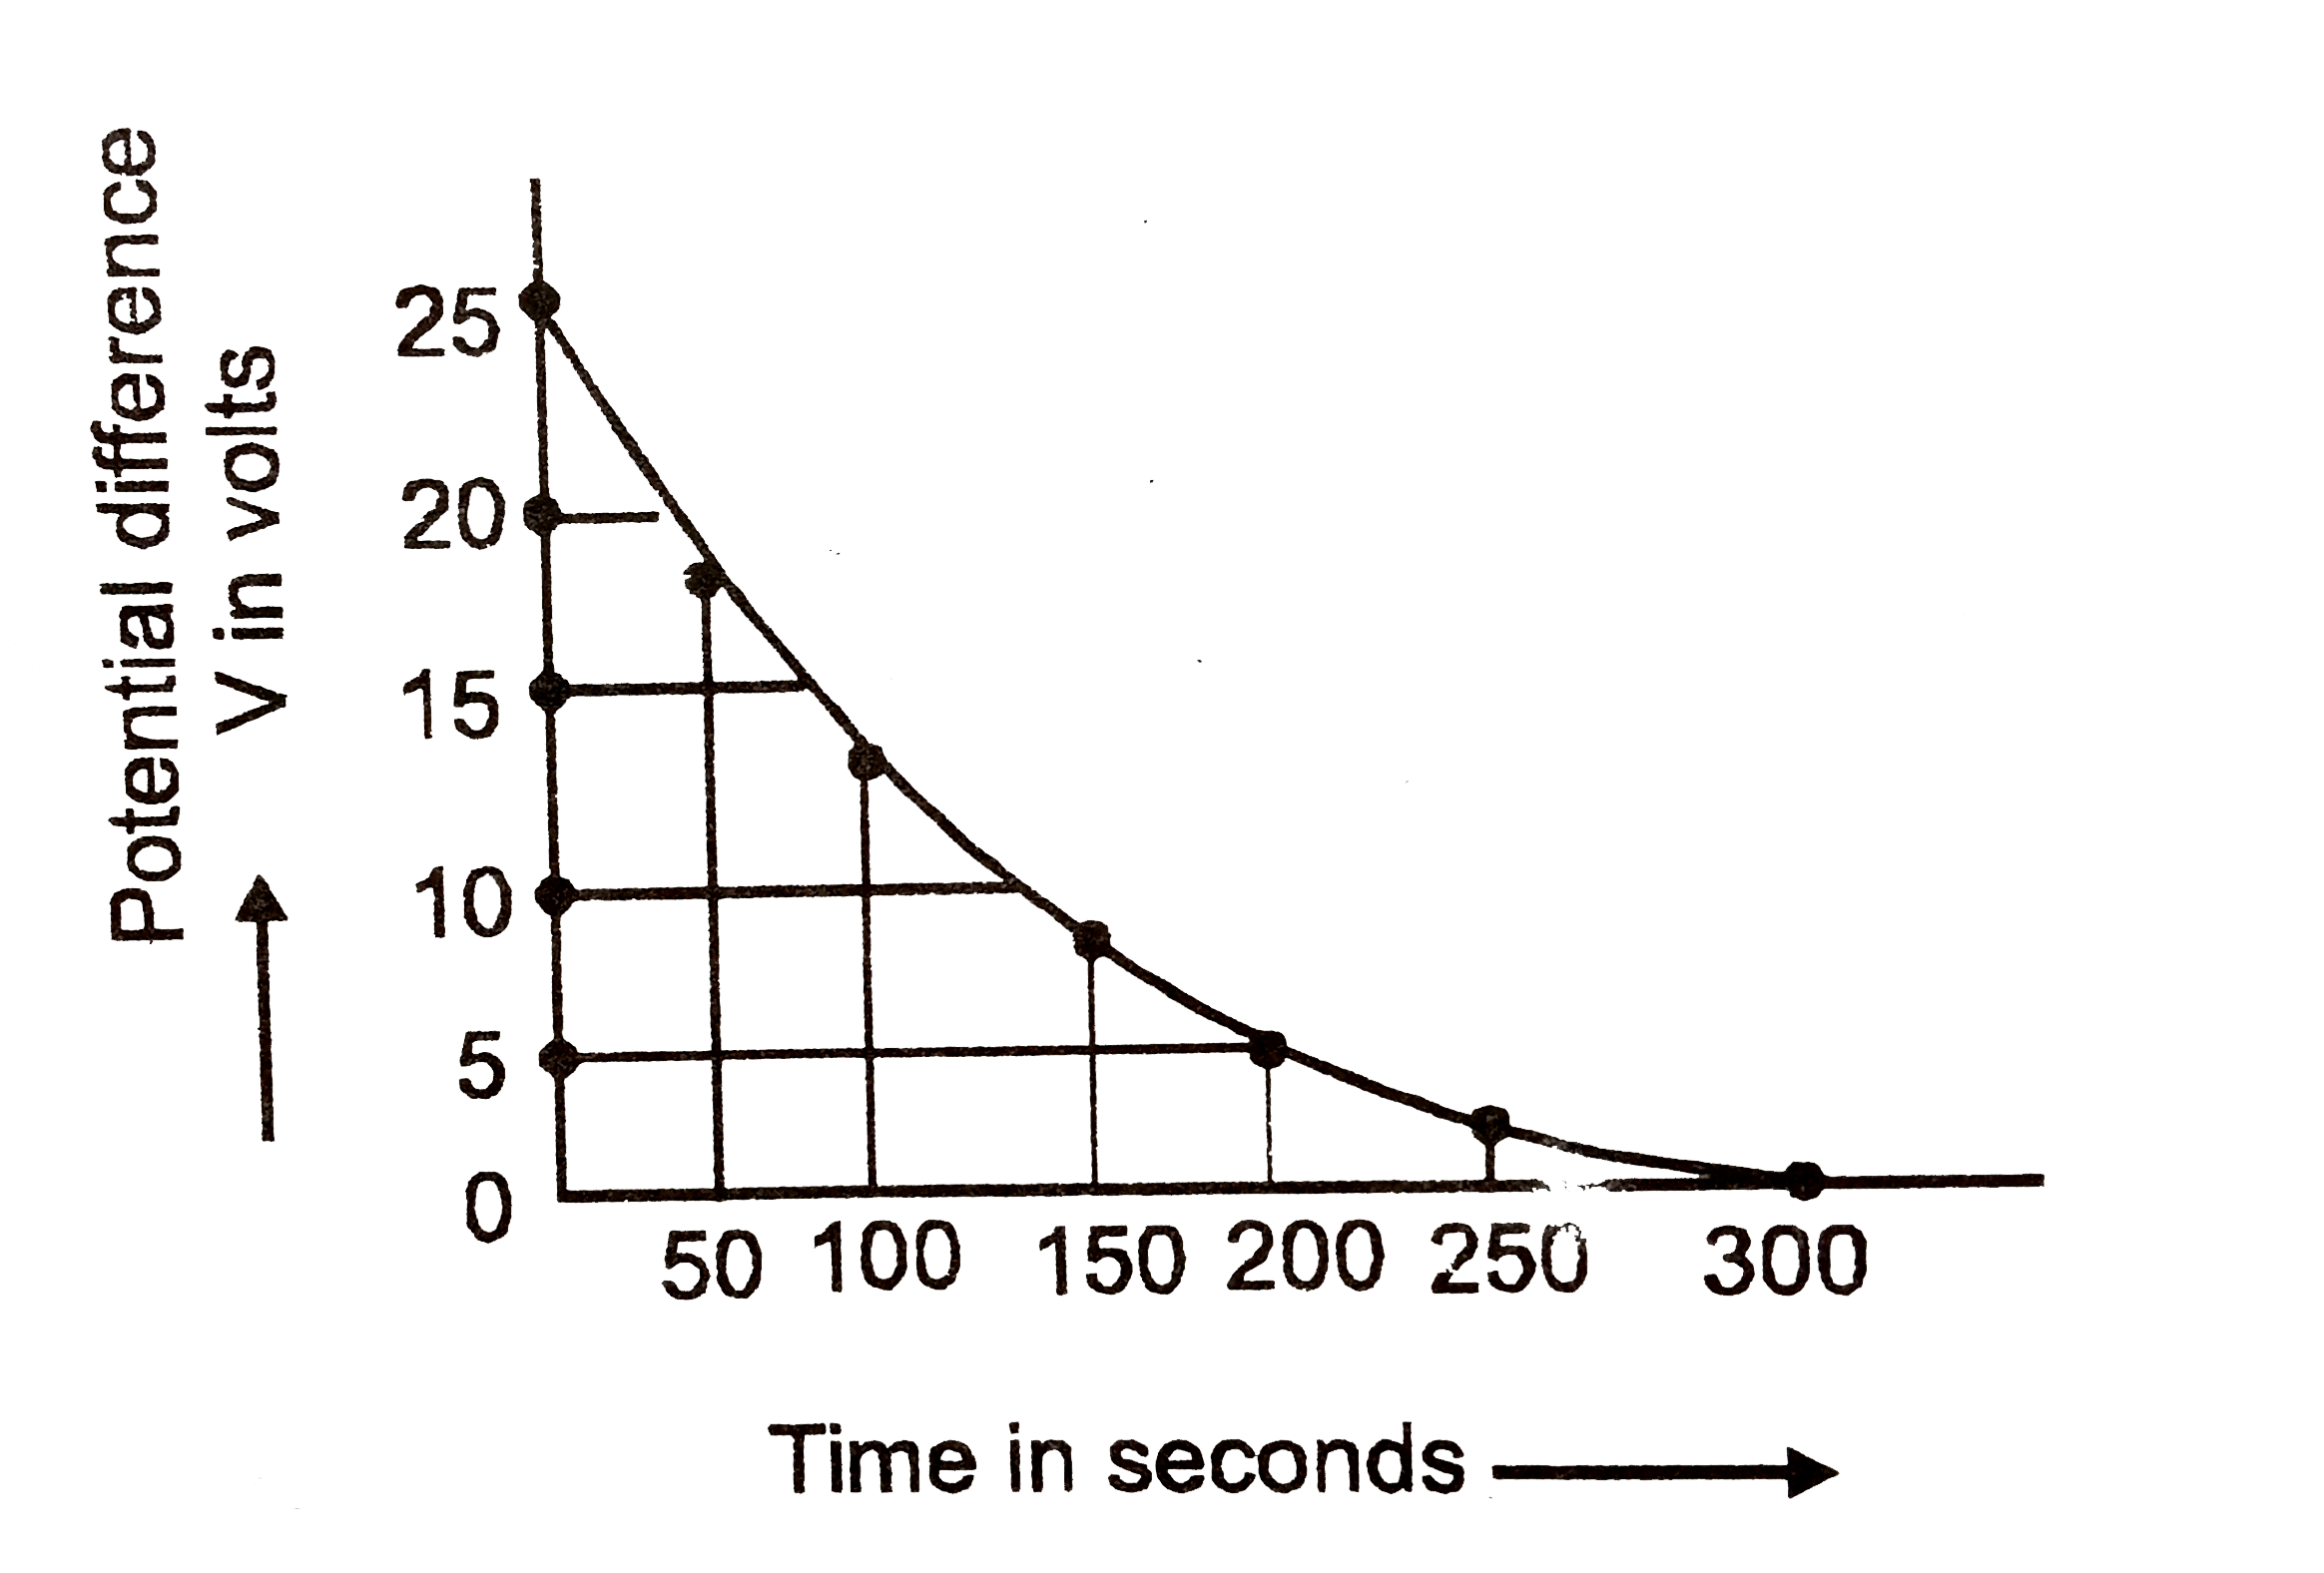
The figure shows an experimental plot discharging of a capacitor in an RC circuit. The time constant of this circuit lies between:
 View Solution
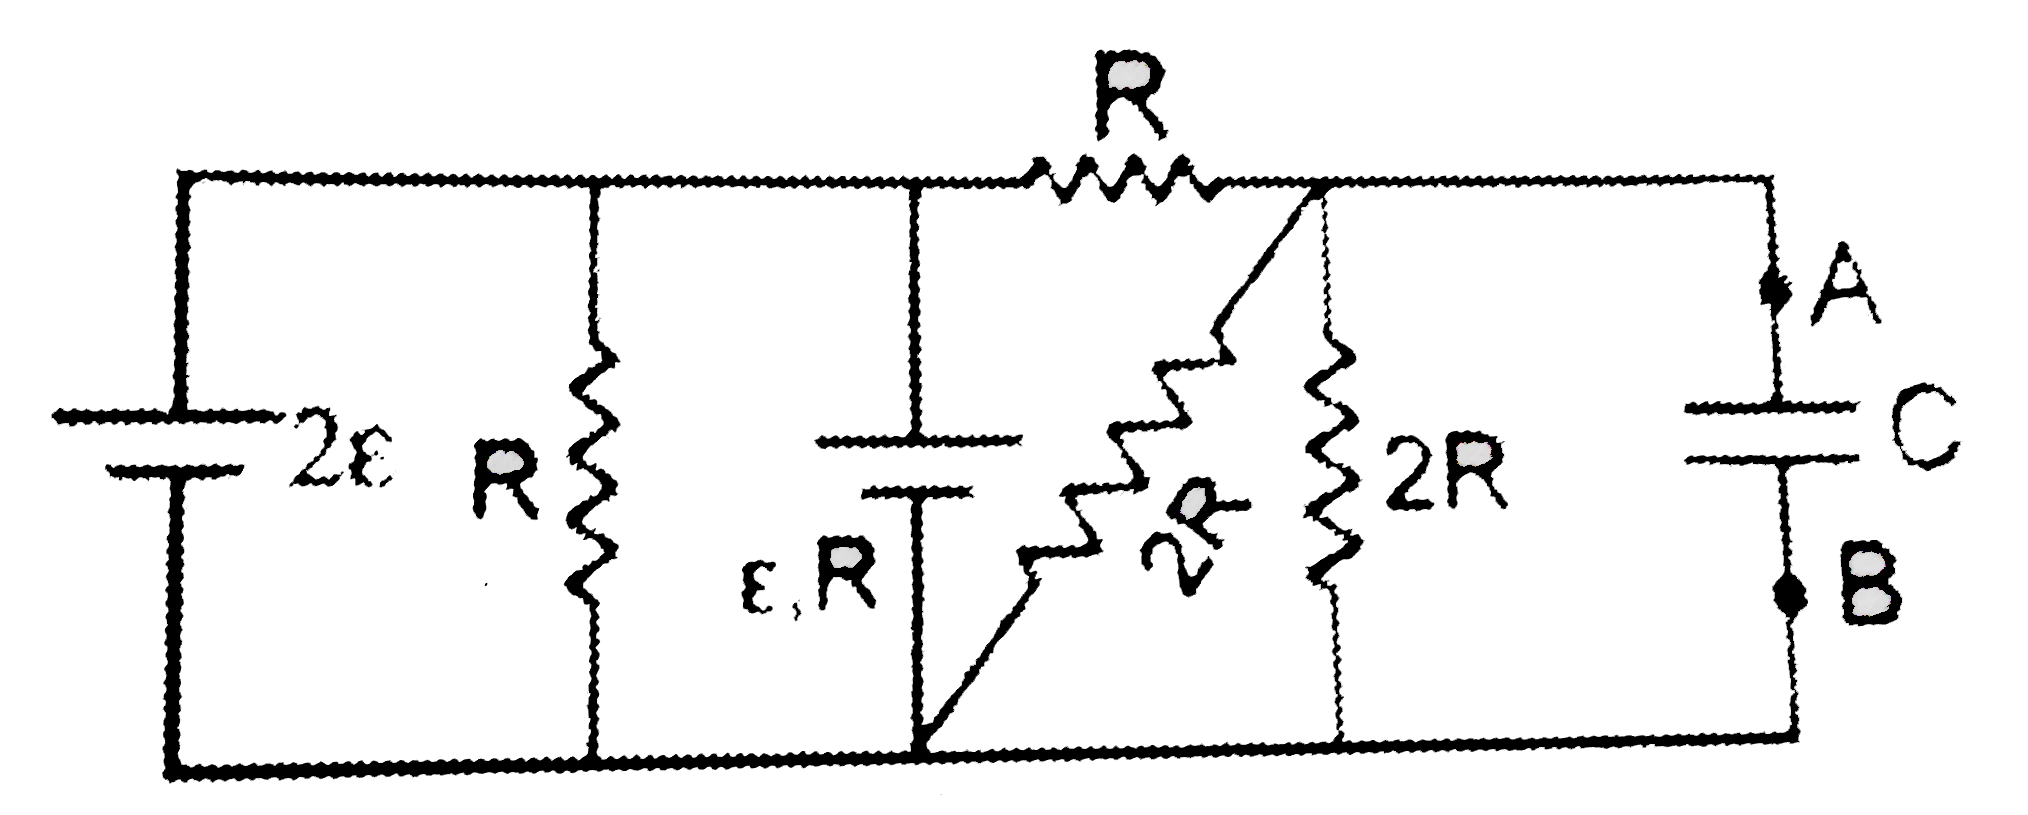
The time constant of the circuit shown is :
 View Solution
The time constant of L-R circuit is doubled if
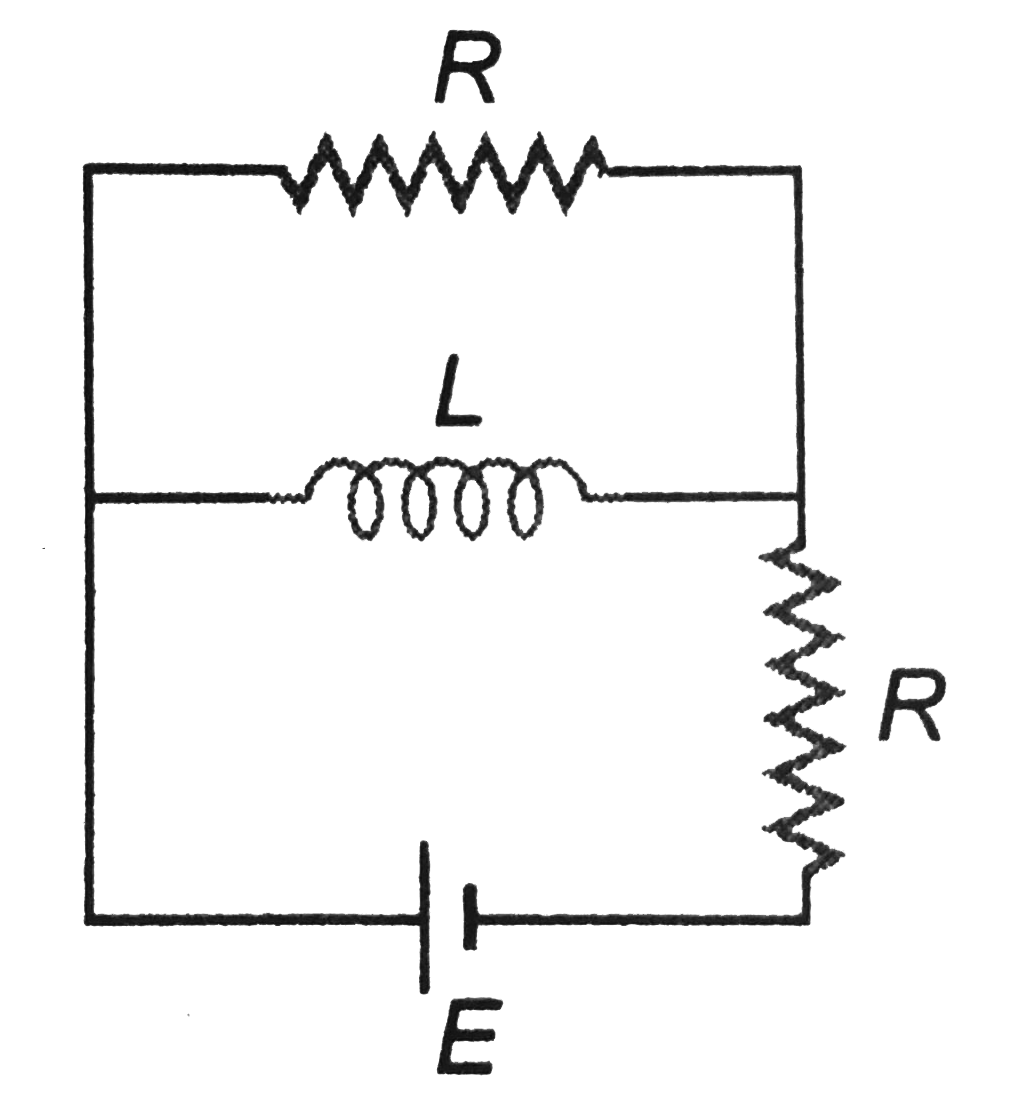
View SolutionThe figure shows an L−R circuit the time constant for the circuit is
 View Solution
The time constant of C-R circuit is
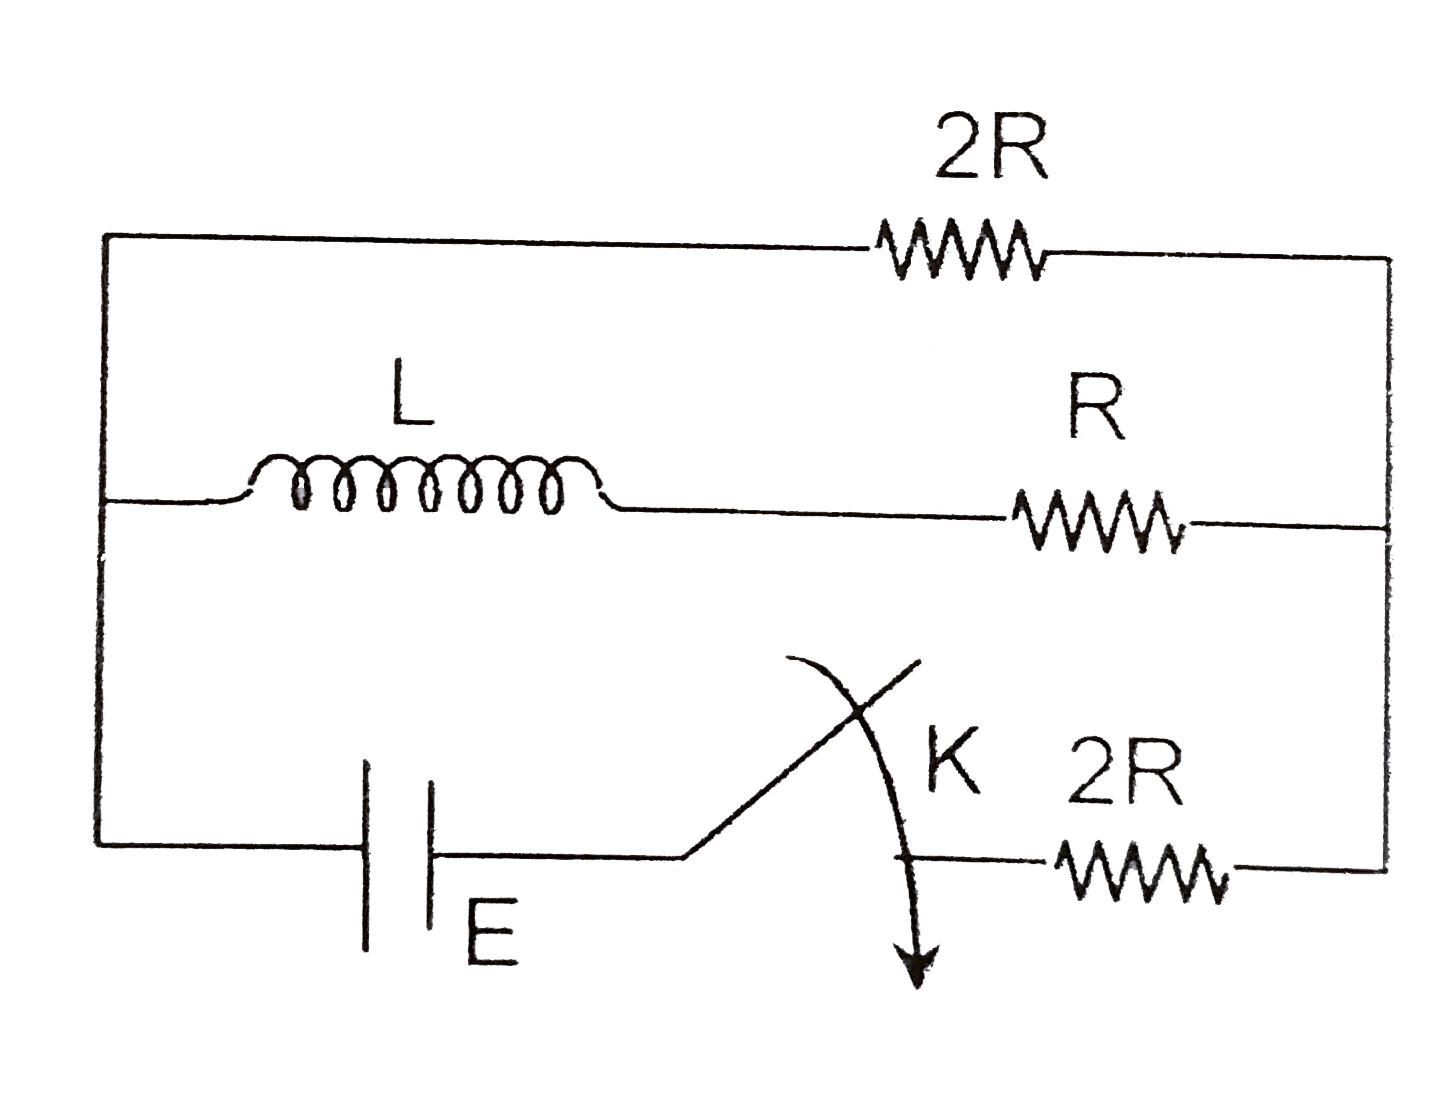
View SolutionTime constant of LR circuit will be
 View Solution
In the transient circuit shown, the time constant of the circuit is :
 View Solution
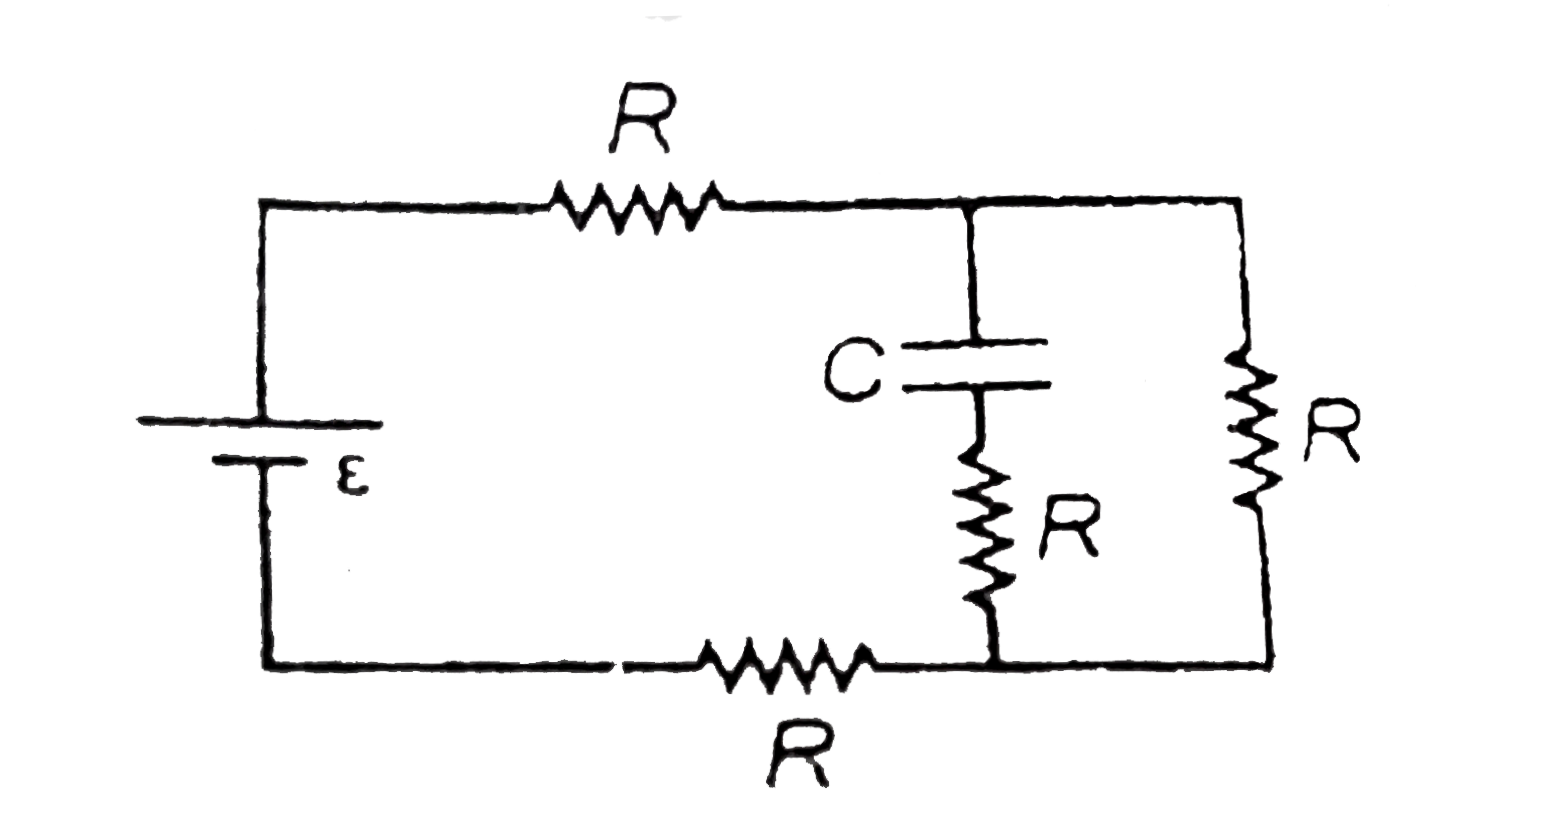
The time constant of the circuit shown in the figure is
 View Solution
For L-R circuit, the time constant is equal to
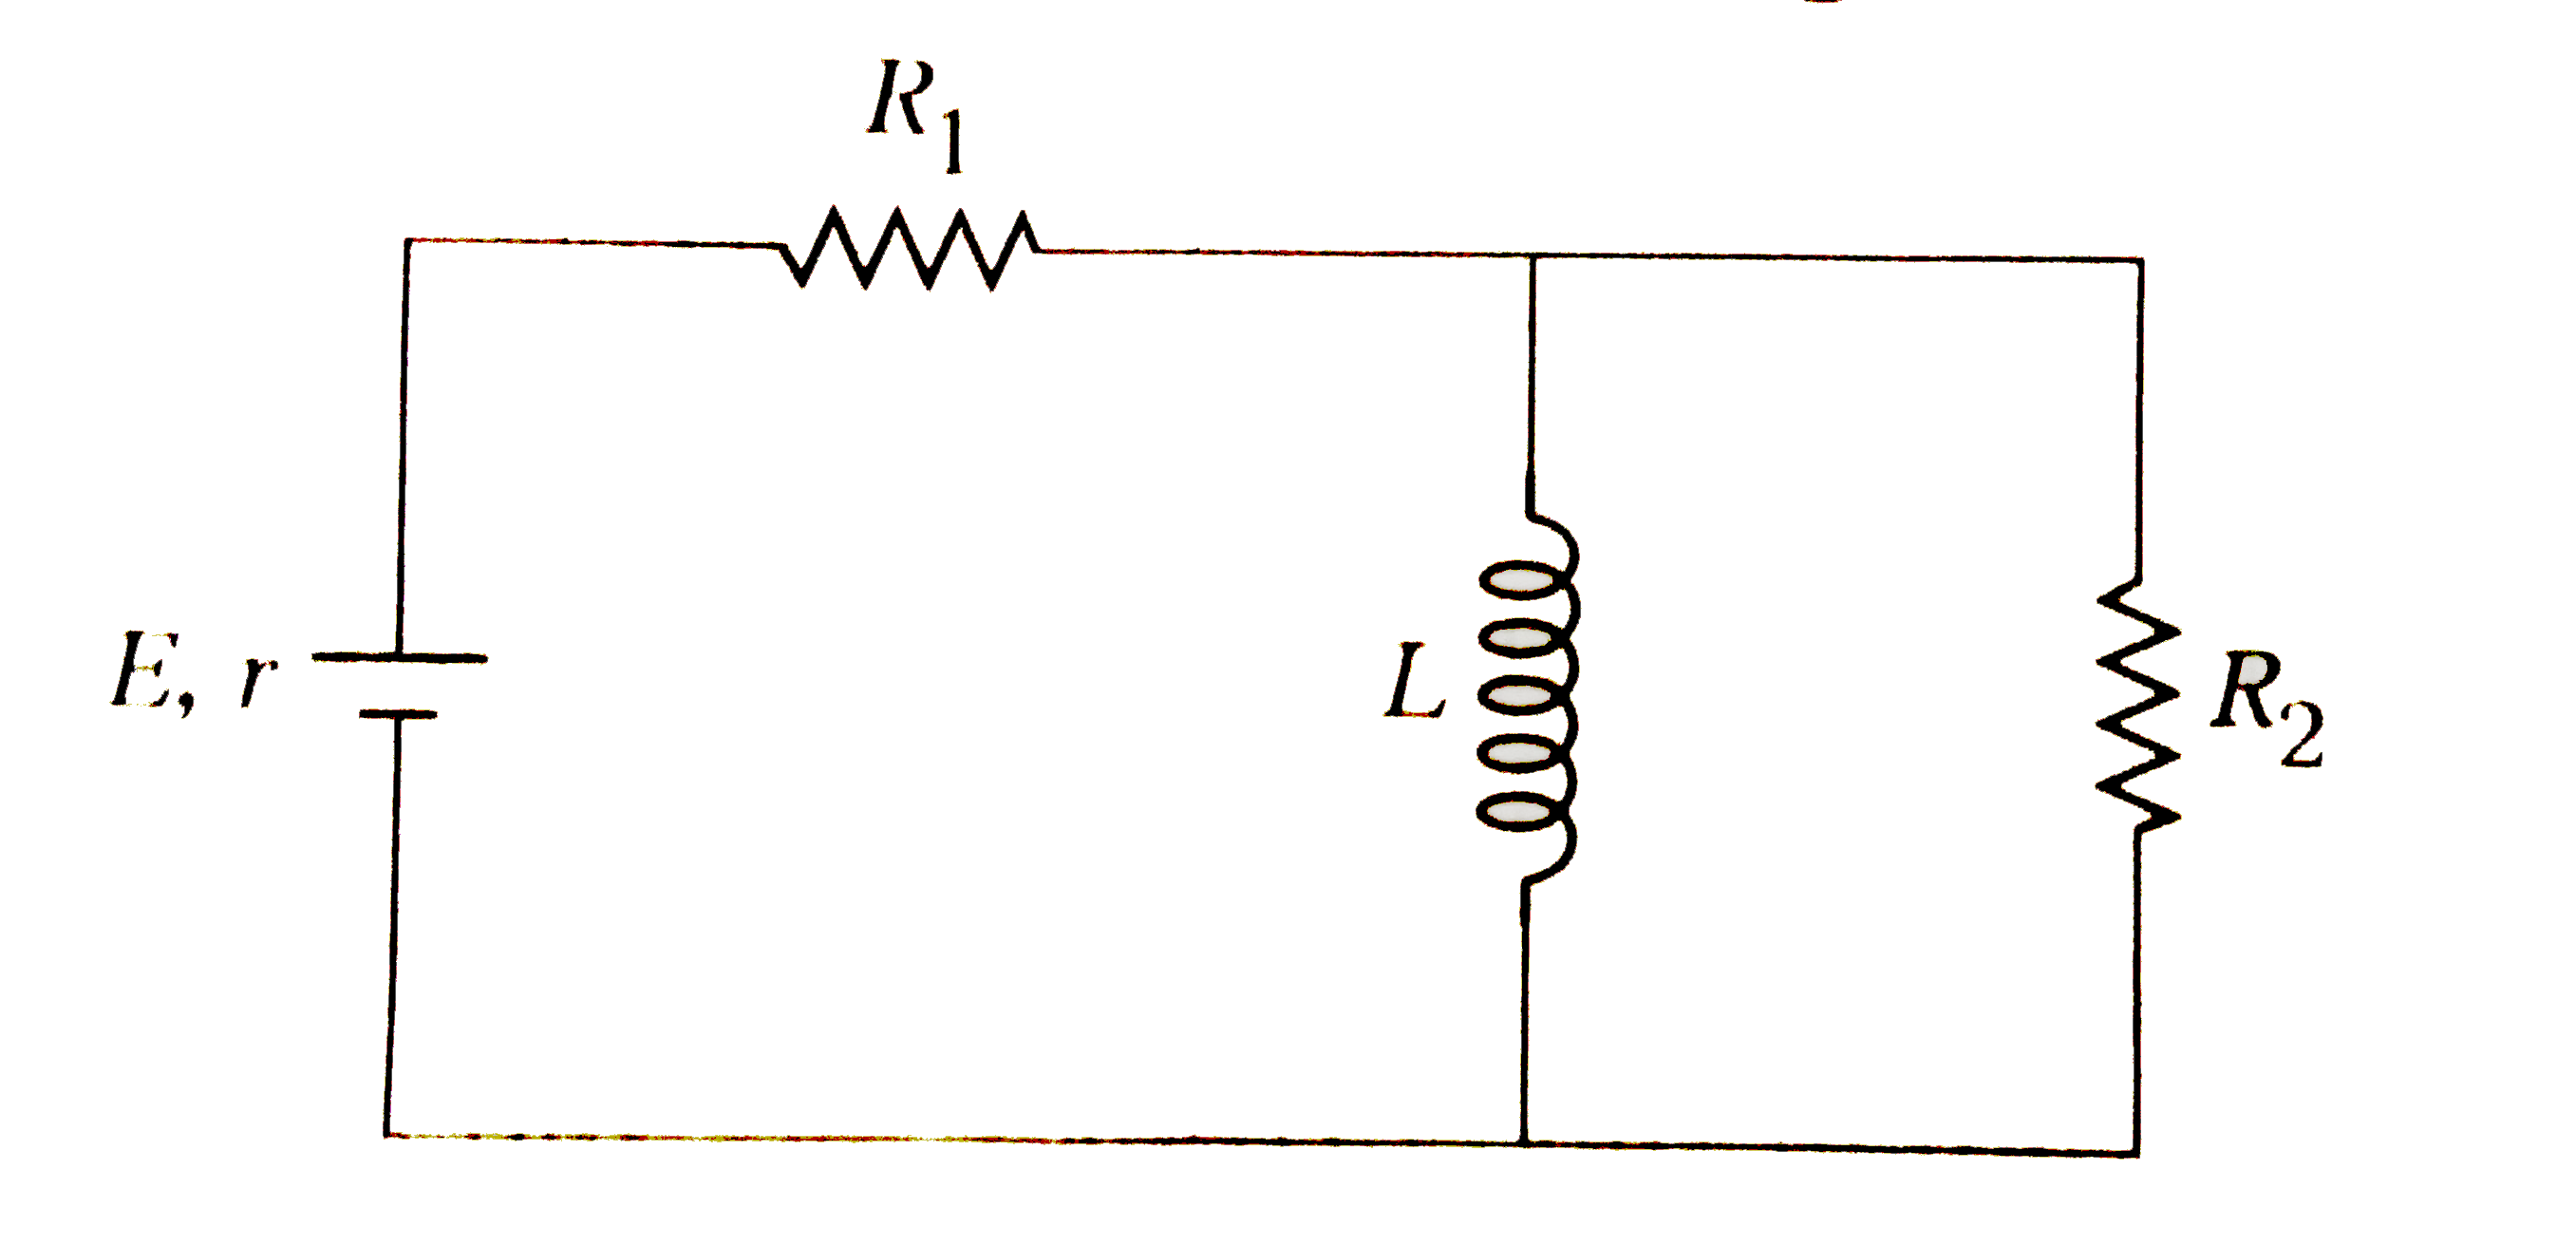
View SolutionThe value of time constant for the given circuit is
 View Solution

