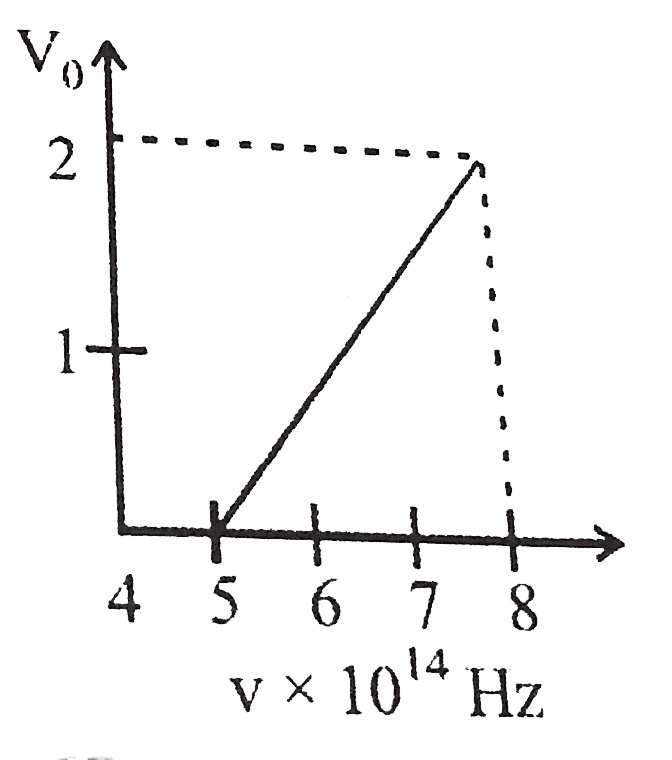
The figure shows different graphs between stopping potential (V0) and frequency (v) for photosensitive surface of cesium , potassium , sodium and lithium. The plots are parallel. Correct ranking of the targets according to their work function greatest first will be

(i)>(ii)>(iii)>(iv)
(i)>(iii)>(ii)>(iv)
(iv)>(iii)>(ii)=(iv)
(i)=(iii)>(ii)=(iv)
The correct Answer is:C
The graph between V0 and v cut the v - axis at v0.
For the given graphs (v0)iv>(v0)iii>(v0)ii>(v0)i
∴(W0)iv>(W0)iii>(W0)ii>(W0)i.
Topper's Solved these Questions
- BOOK - A2ZCHAPTER - DUAL NATURE OF RADIATION AND MATTEREXERCISE - Assertion Reason14videos
DUAL NATURE OF RADIATION AND MATTER
- BOOK - A2ZCHAPTER - CURRENT ELECTRICITYEXERCISE - Section D - Chapter End Test29videos
CURRENT ELECTRICITY
- BOOK - A2ZCHAPTER - ELECTRIC CHARGE, FIELD & FLUXEXERCISE - Section D - Chapter End Test29videos
ELECTRIC CHARGE, FIELD & FLUX
Similar Questions
Knowledge Check
- Question 1 - Select One
Graph between stopping potential and frequency of photon is given in figure
_2019_CBT7_E01_021_Q01.png)
Find out work function of metal:A0.82B0.92C0.72D0.62 - Question 2 - Select One
The figure showing the correct relationship between the stopping potential V and the frequency v of the light for potassium and tungsten is
A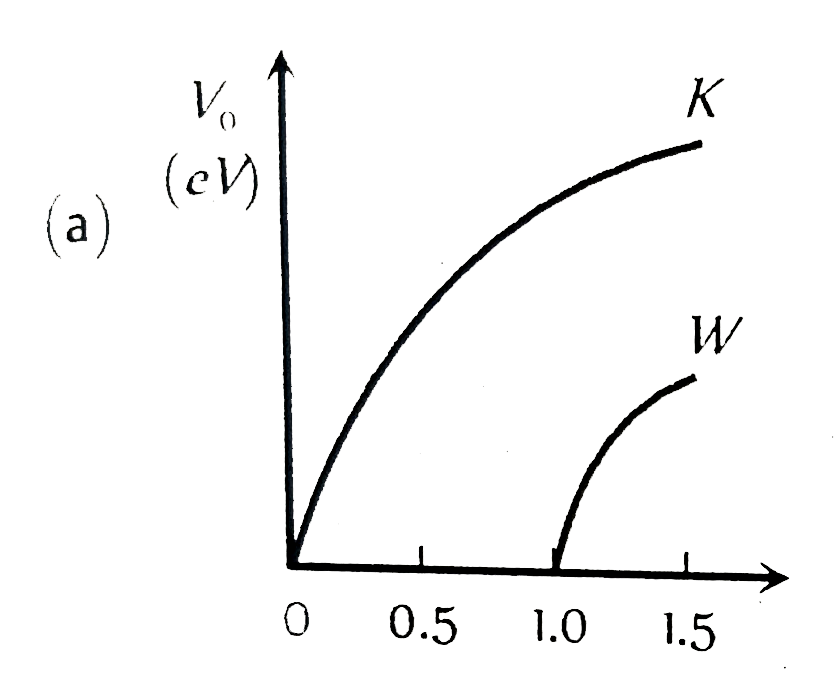 B
B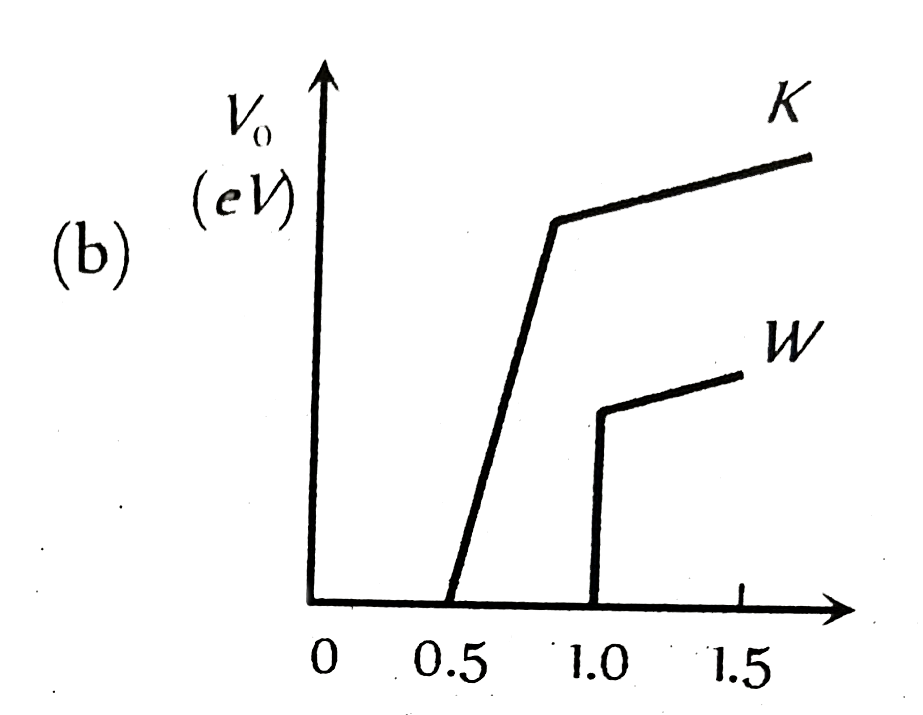 C
C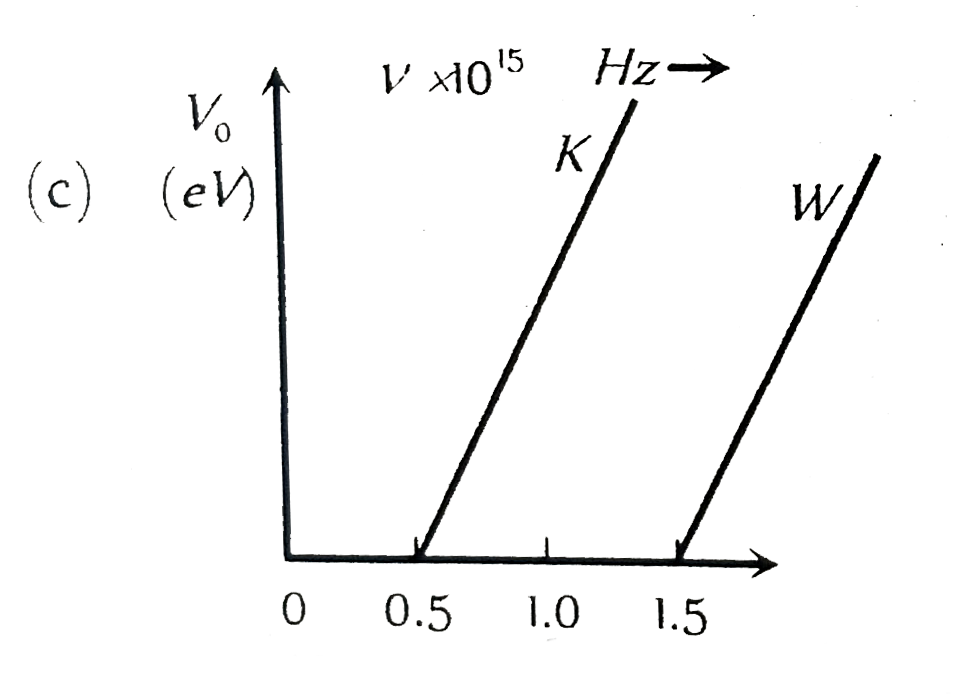 D
D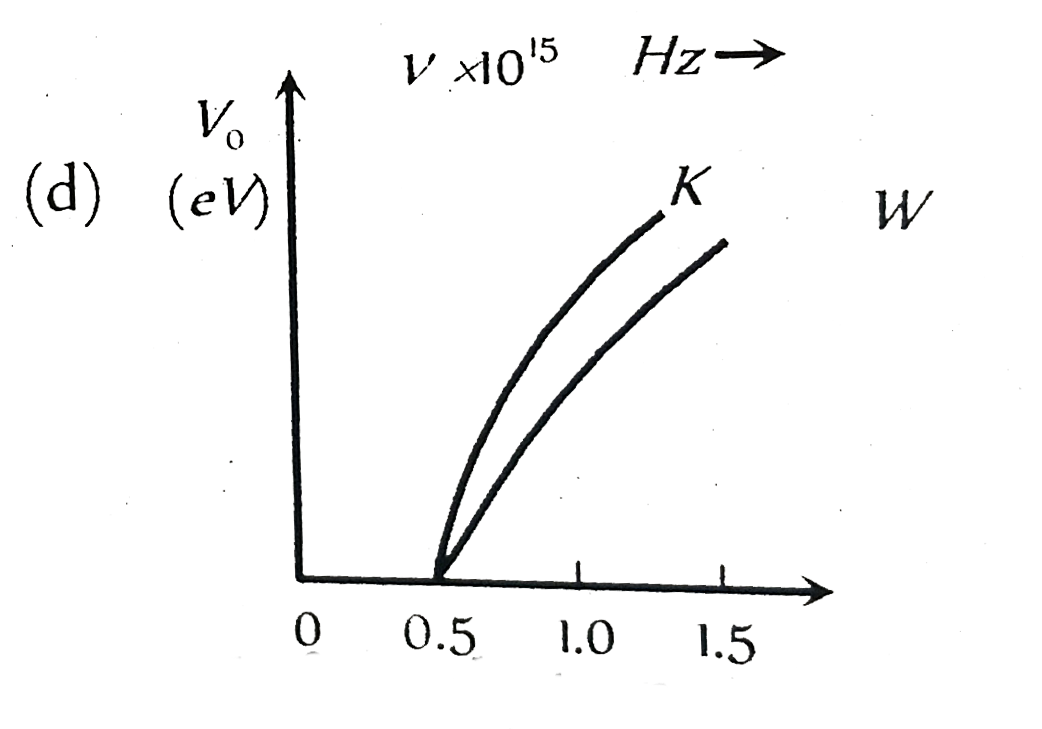
- Question 3 - Select One
Choose the graph showing the correct relationship between the stopping potential V0 and the frequency v of light for potassium and tungsten.
A B
B C
C D
D
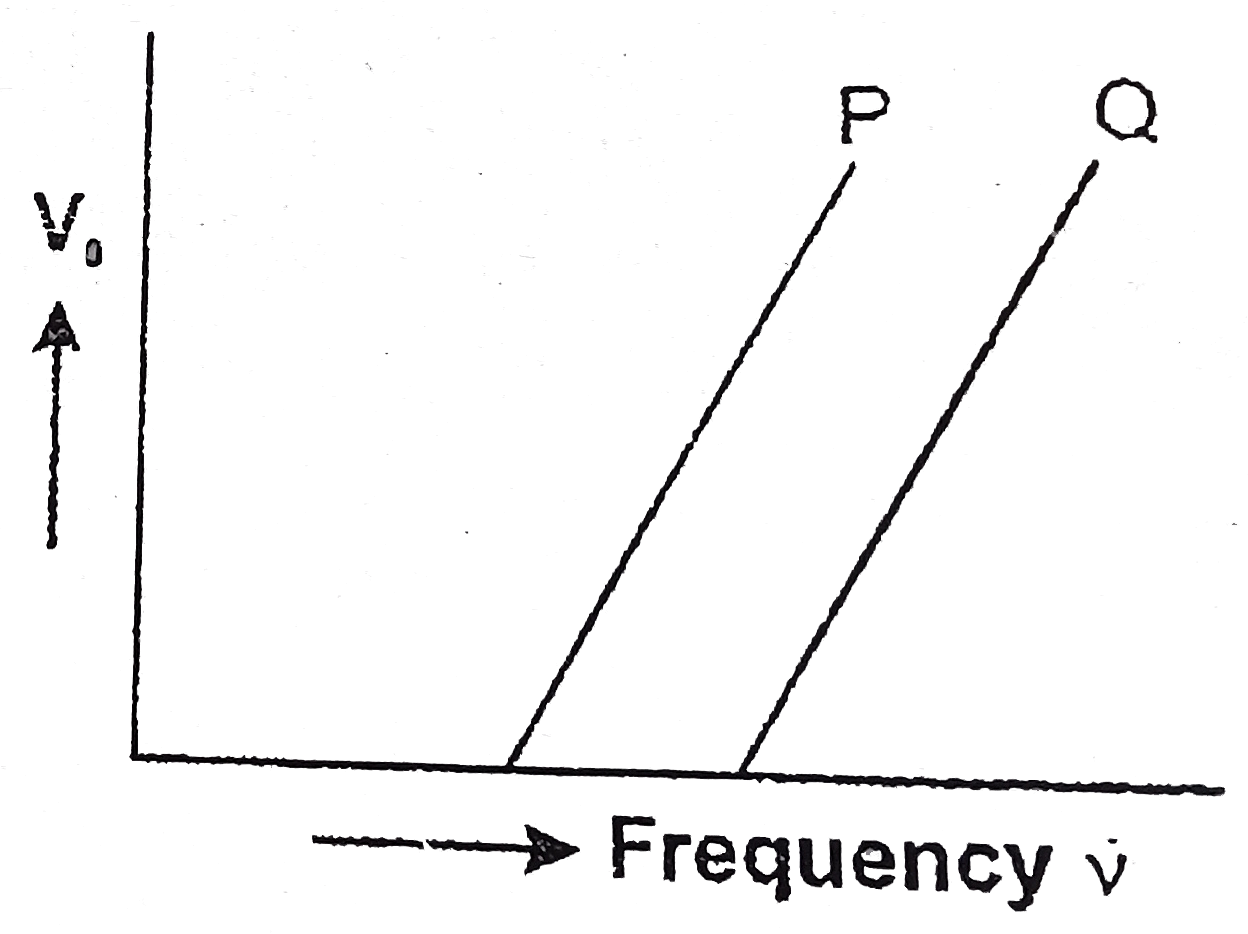
The graph between the stopping potential V0 and frequency v for two different metal plates P and Q are shown in the figure. Which of the metals has greater threshold wavelength and work function.
 View Solution
Draw a graph between stopping potential and the frequency of two metals A and B having threshold frequencies v0and2v0 .
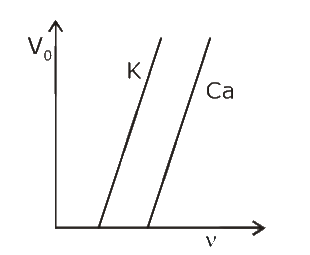
View SolutionIn the diagram, graph are drawn between stopping potential V0 and frequency v for the elements K and Ca. According this to diagram
 View Solution
Figure shows the graph of stopping potential verus that frequency of a photosensitive metal. The plank's constant and work funcation of the metal are
_S01_035_Q01.png) View Solution
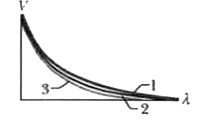
View SolutionIn the following figure gives the stopping voltage V versus the wavelength λ of light for three different materials. Rank the materials according to their work function, greatest first.
 View Solution


