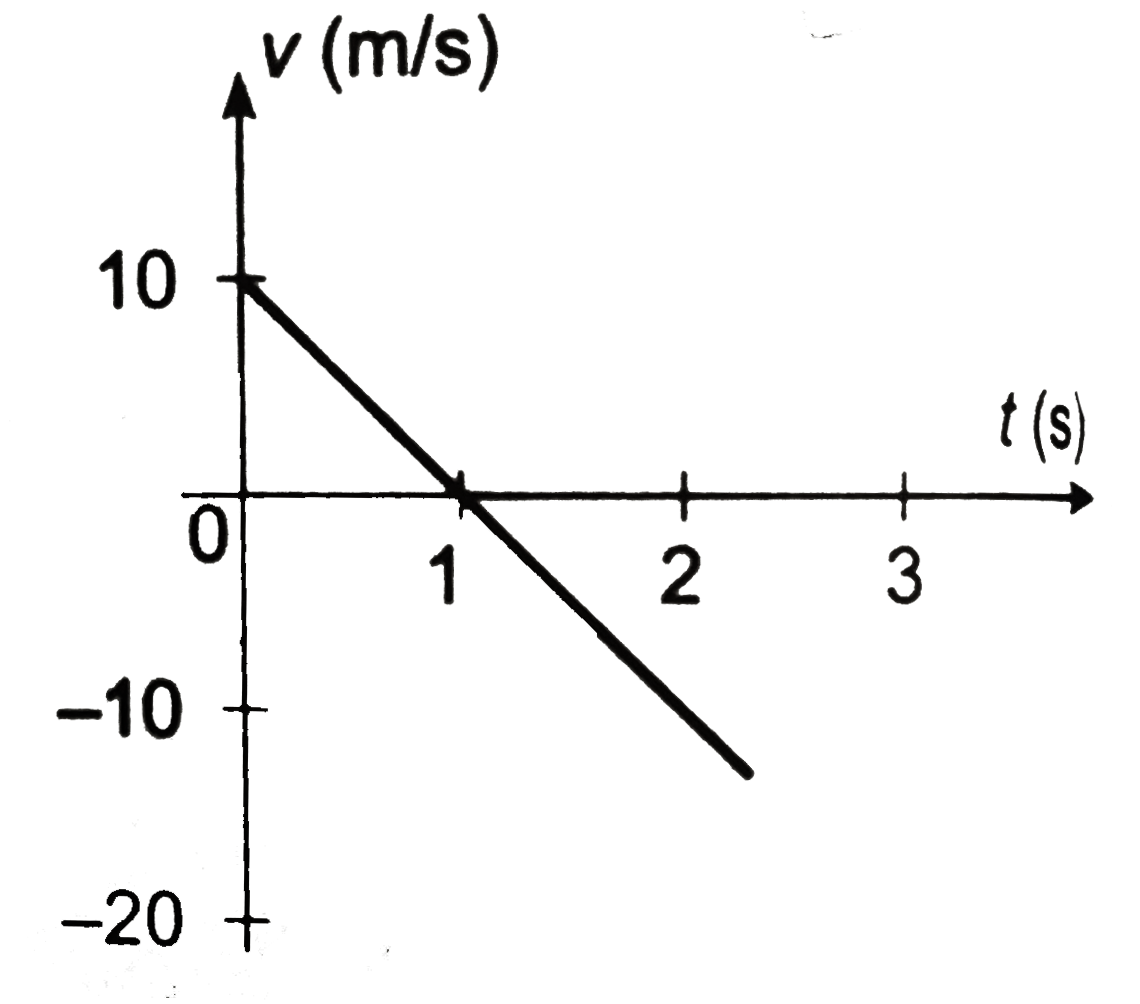
The figure shows the velocity (v) of a particle plotted against time (t). 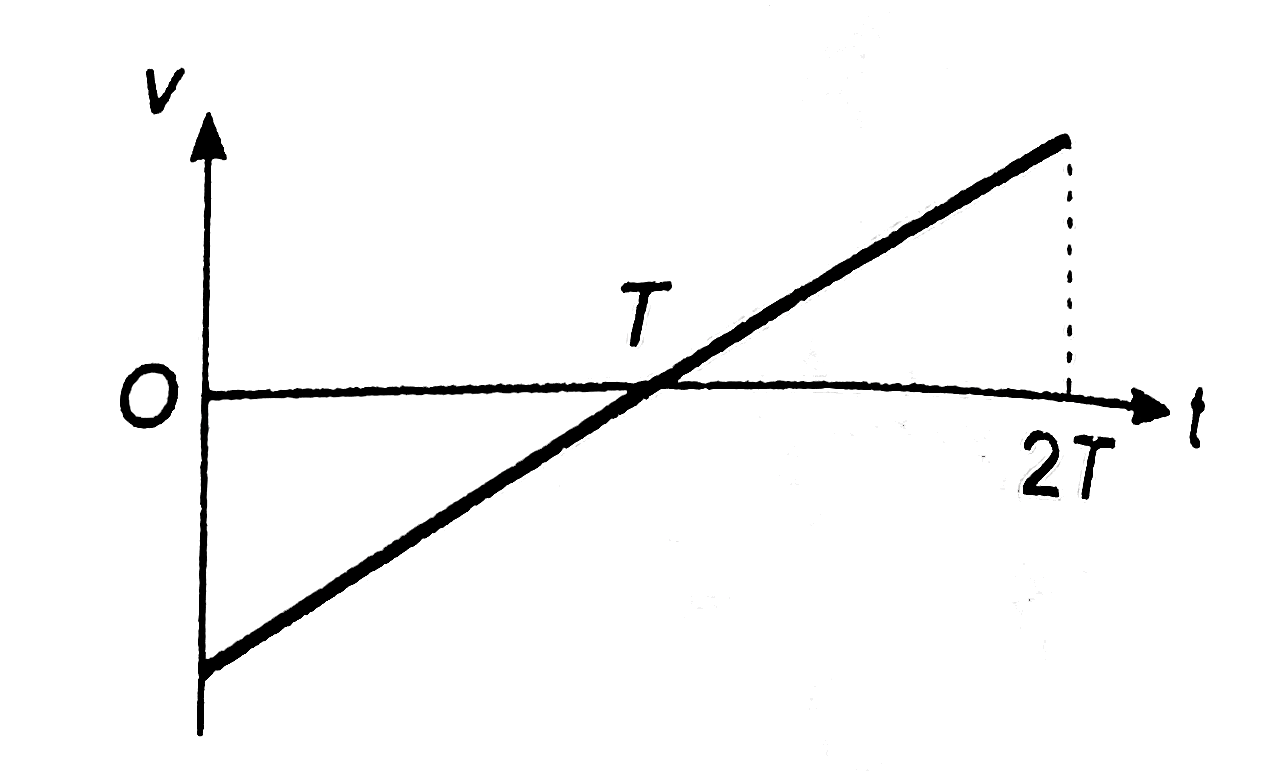
The particle changes its direction of motion at some point.
The acceleration of the particle remains constant
The displacement of the particle is zero
The initial and final speeds of the particle are the same
The correct Answer is:A, B, C, D
For t<T,v=−ve
For t>T,v=+ve
At t=T,v=0
∴ Particle change direction of velocity at t=T
S=Net area of v-t garph=0
a=Slope of v-t graph =constant
Topper's Solved these Questions
- BOOK - DC PANDEY ENGLISHCHAPTER - KINEMATICSEXERCISE - Comprehension7videos
KINEMATICS
- BOOK - DC PANDEY ENGLISHCHAPTER - KINEMATICSEXERCISE - Subjective Questions24videos
KINEMATICS
- BOOK - DC PANDEY ENGLISHCHAPTER - KINEMATICSEXERCISE - Subjective50videos
KINEMATICS
- BOOK - DC PANDEY ENGLISHCHAPTER - GRAVITATIONEXERCISE - (C) Chapter Exercises45videos
GRAVITATION
- BOOK - DC PANDEY ENGLISHCHAPTER - KINEMATICS 1EXERCISE - INTEGER_TYPE15videos
KINEMATICS 1
Similar Questions
Knowledge Check
- Question 1 - Select One
A tall cylinder is filled with viscous oil. A round pebble is dropped from the top with zero initial velocity. From the plot shown in figure, indicate the one that represents the velocity (v) of the pebble as a function of time (t)
A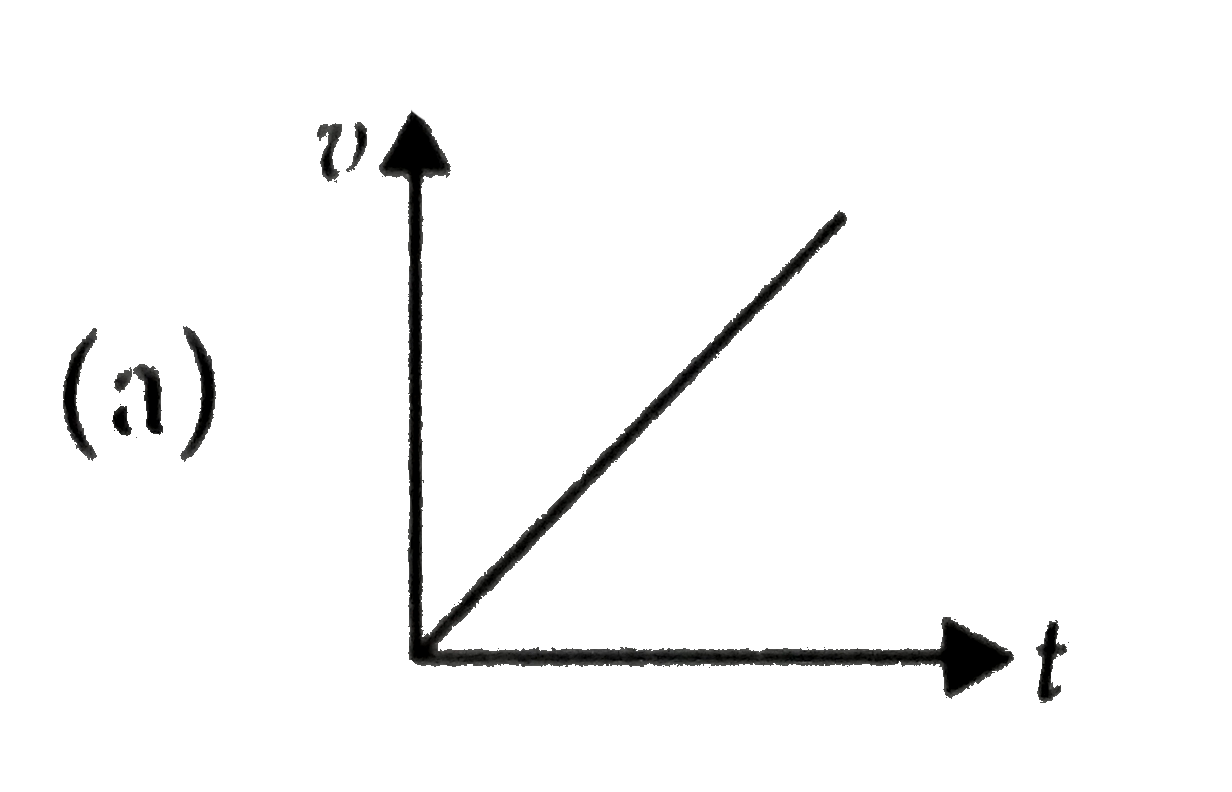 B
B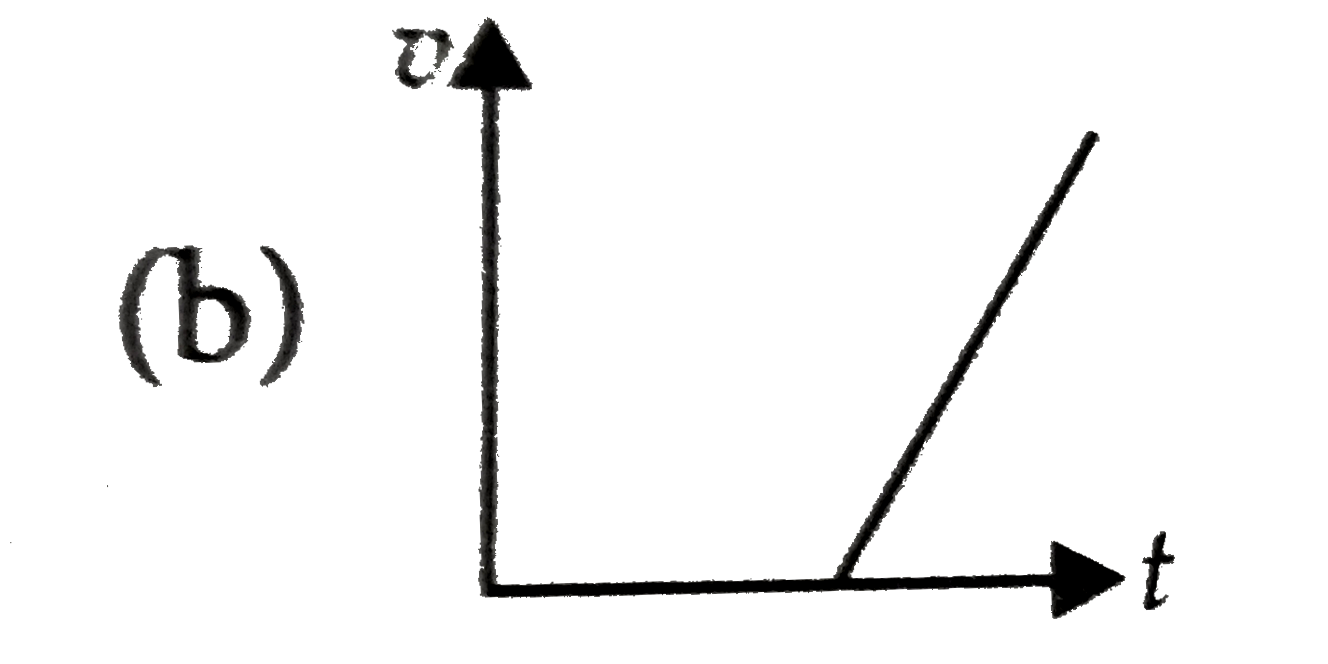 C
C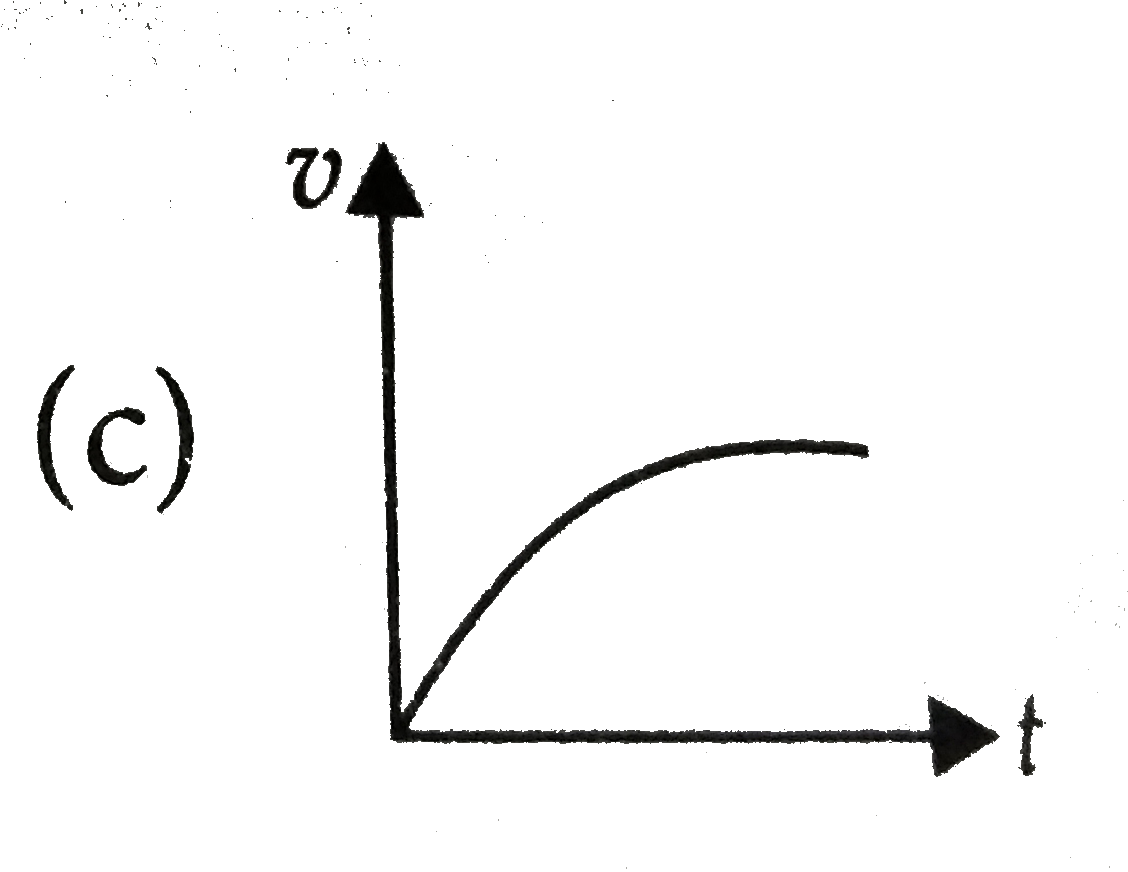 D
D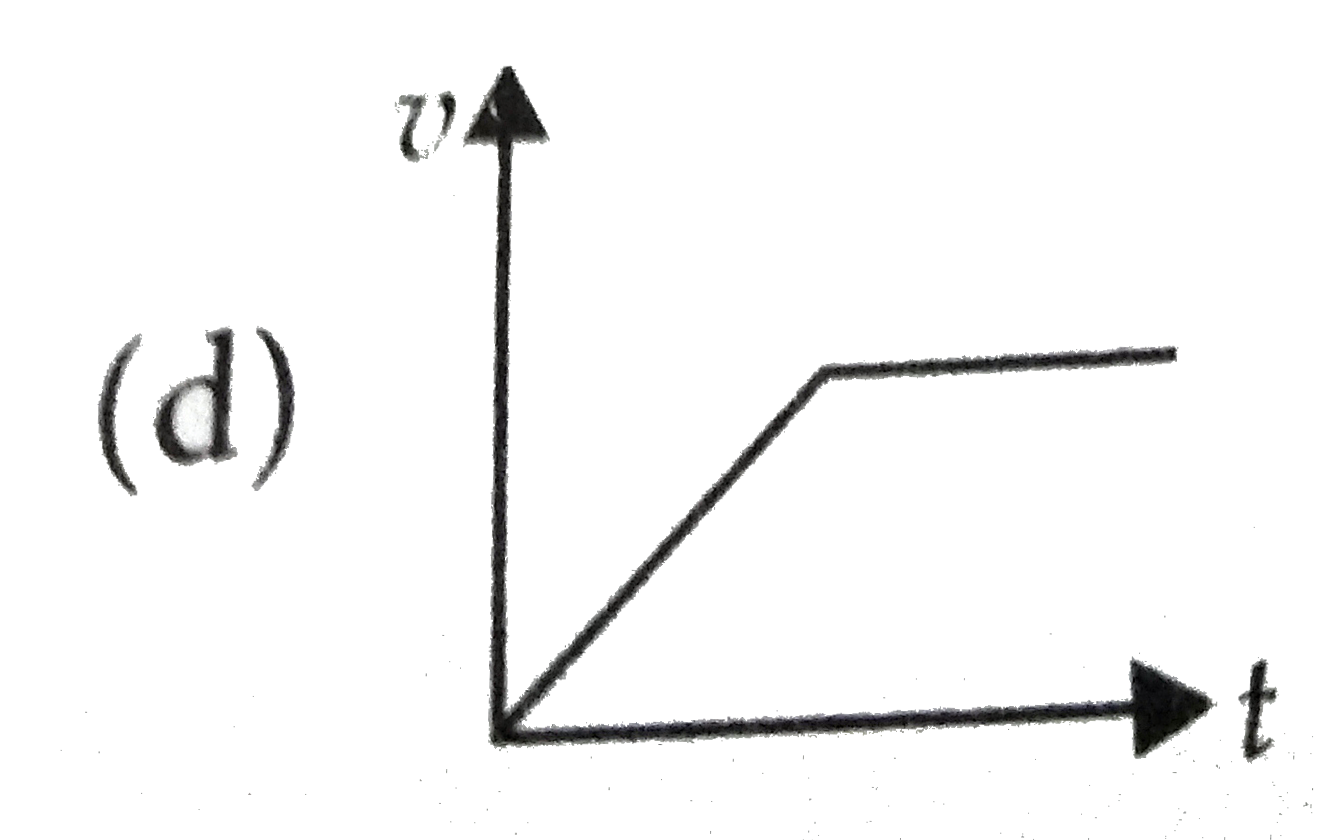
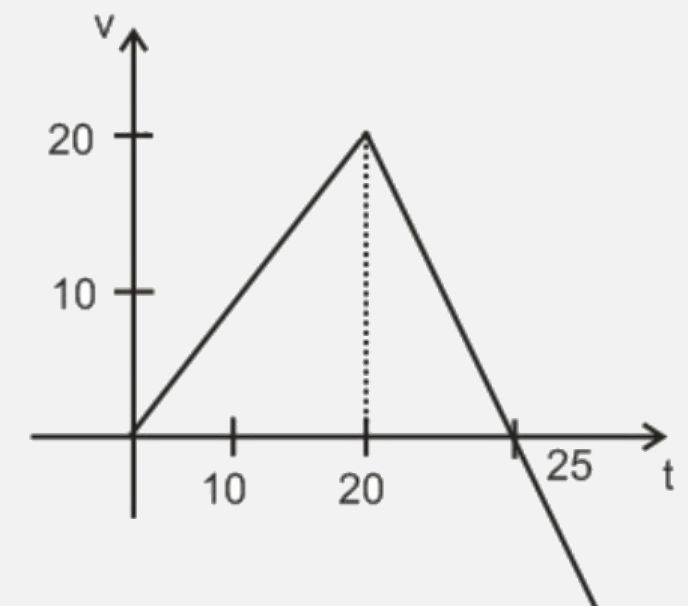
The figure shows velocity-time graph of a particle moving along a straight line. Identify the correct statement.
 View Solution
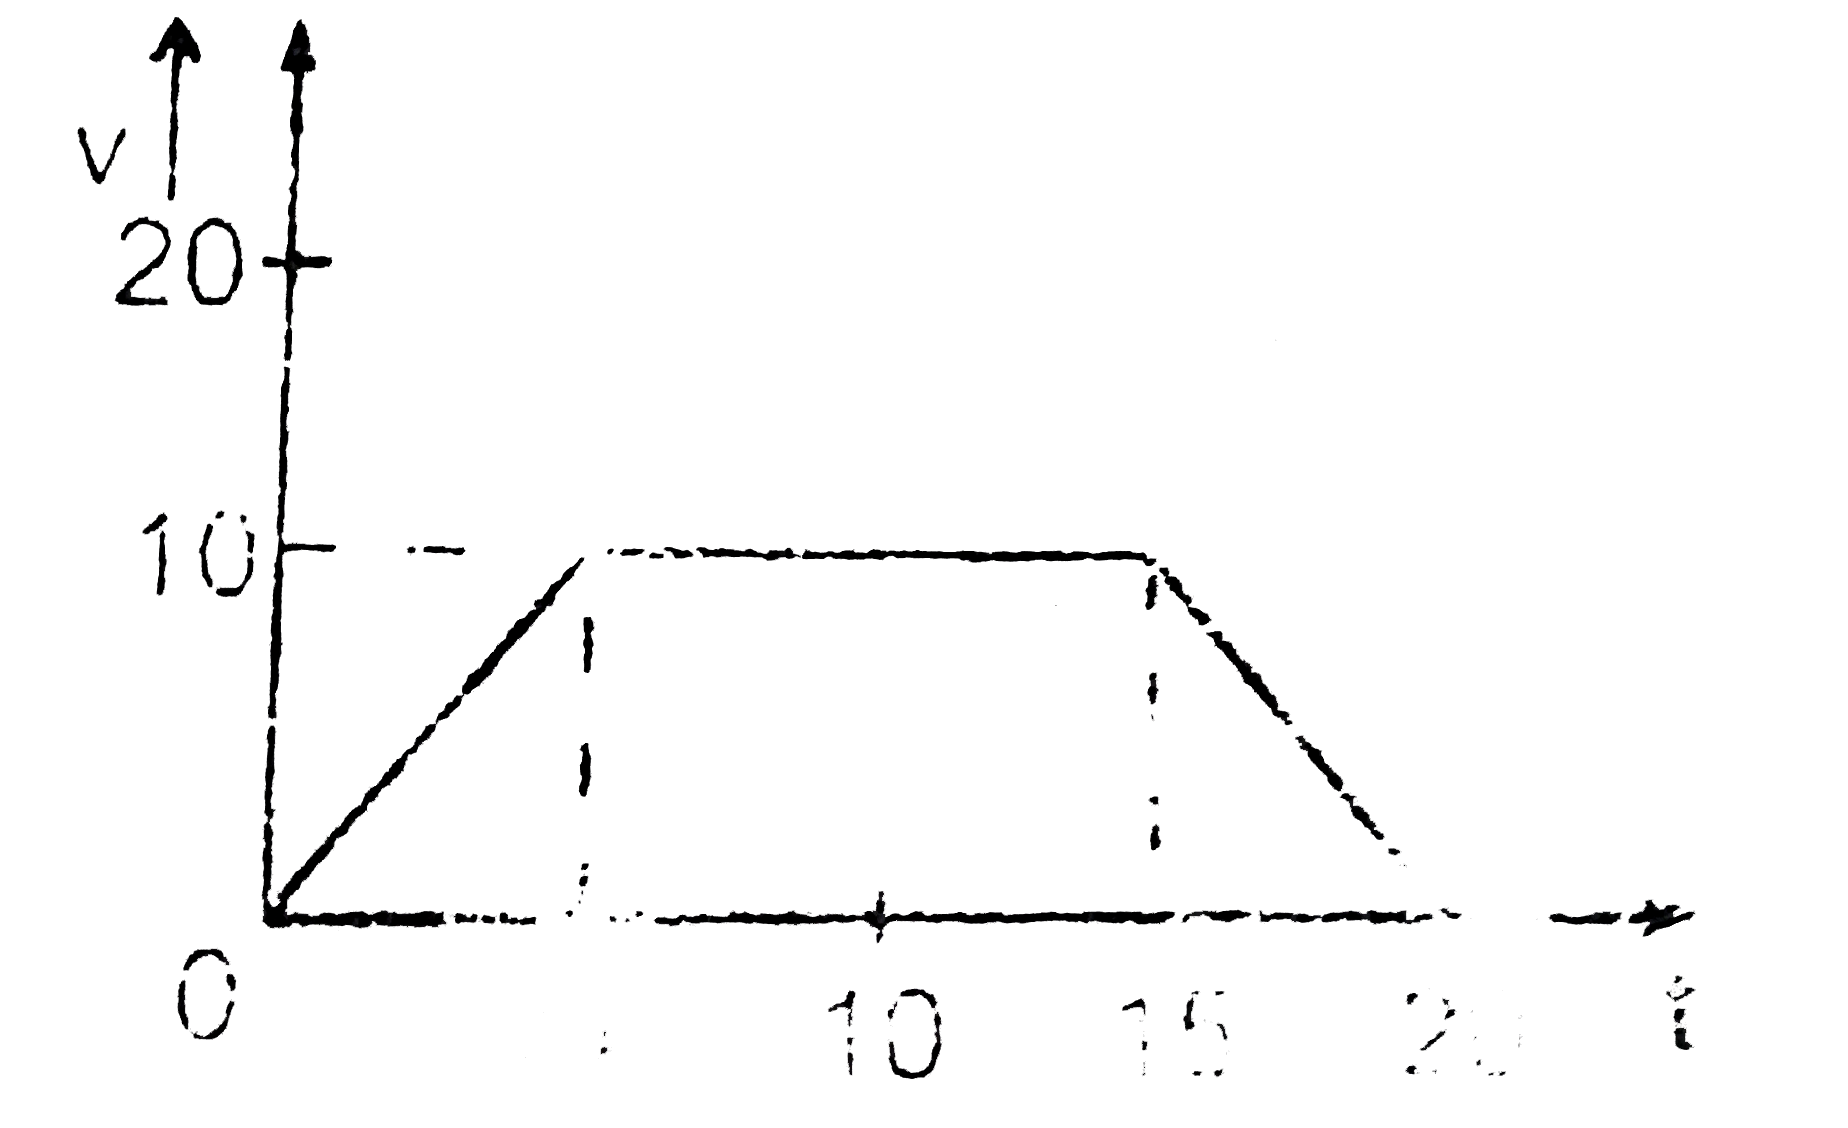
Figure shows the velocity time graph of a particle moving along straight line (v is m/s and t is in second). It average velocity in 20 seconds will be:
 .View Solution
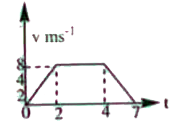
Figure given here shows the variation of velocity of a particle with time.
Find the displacement. ,
 View Solution
A tall cylinder is filled with viscous oil. A round pebble is dropped from the top with zero initial velocity. From the plot shown in figure, indicate the one that represents the velocity (v) of the pebble as a function of time (t)
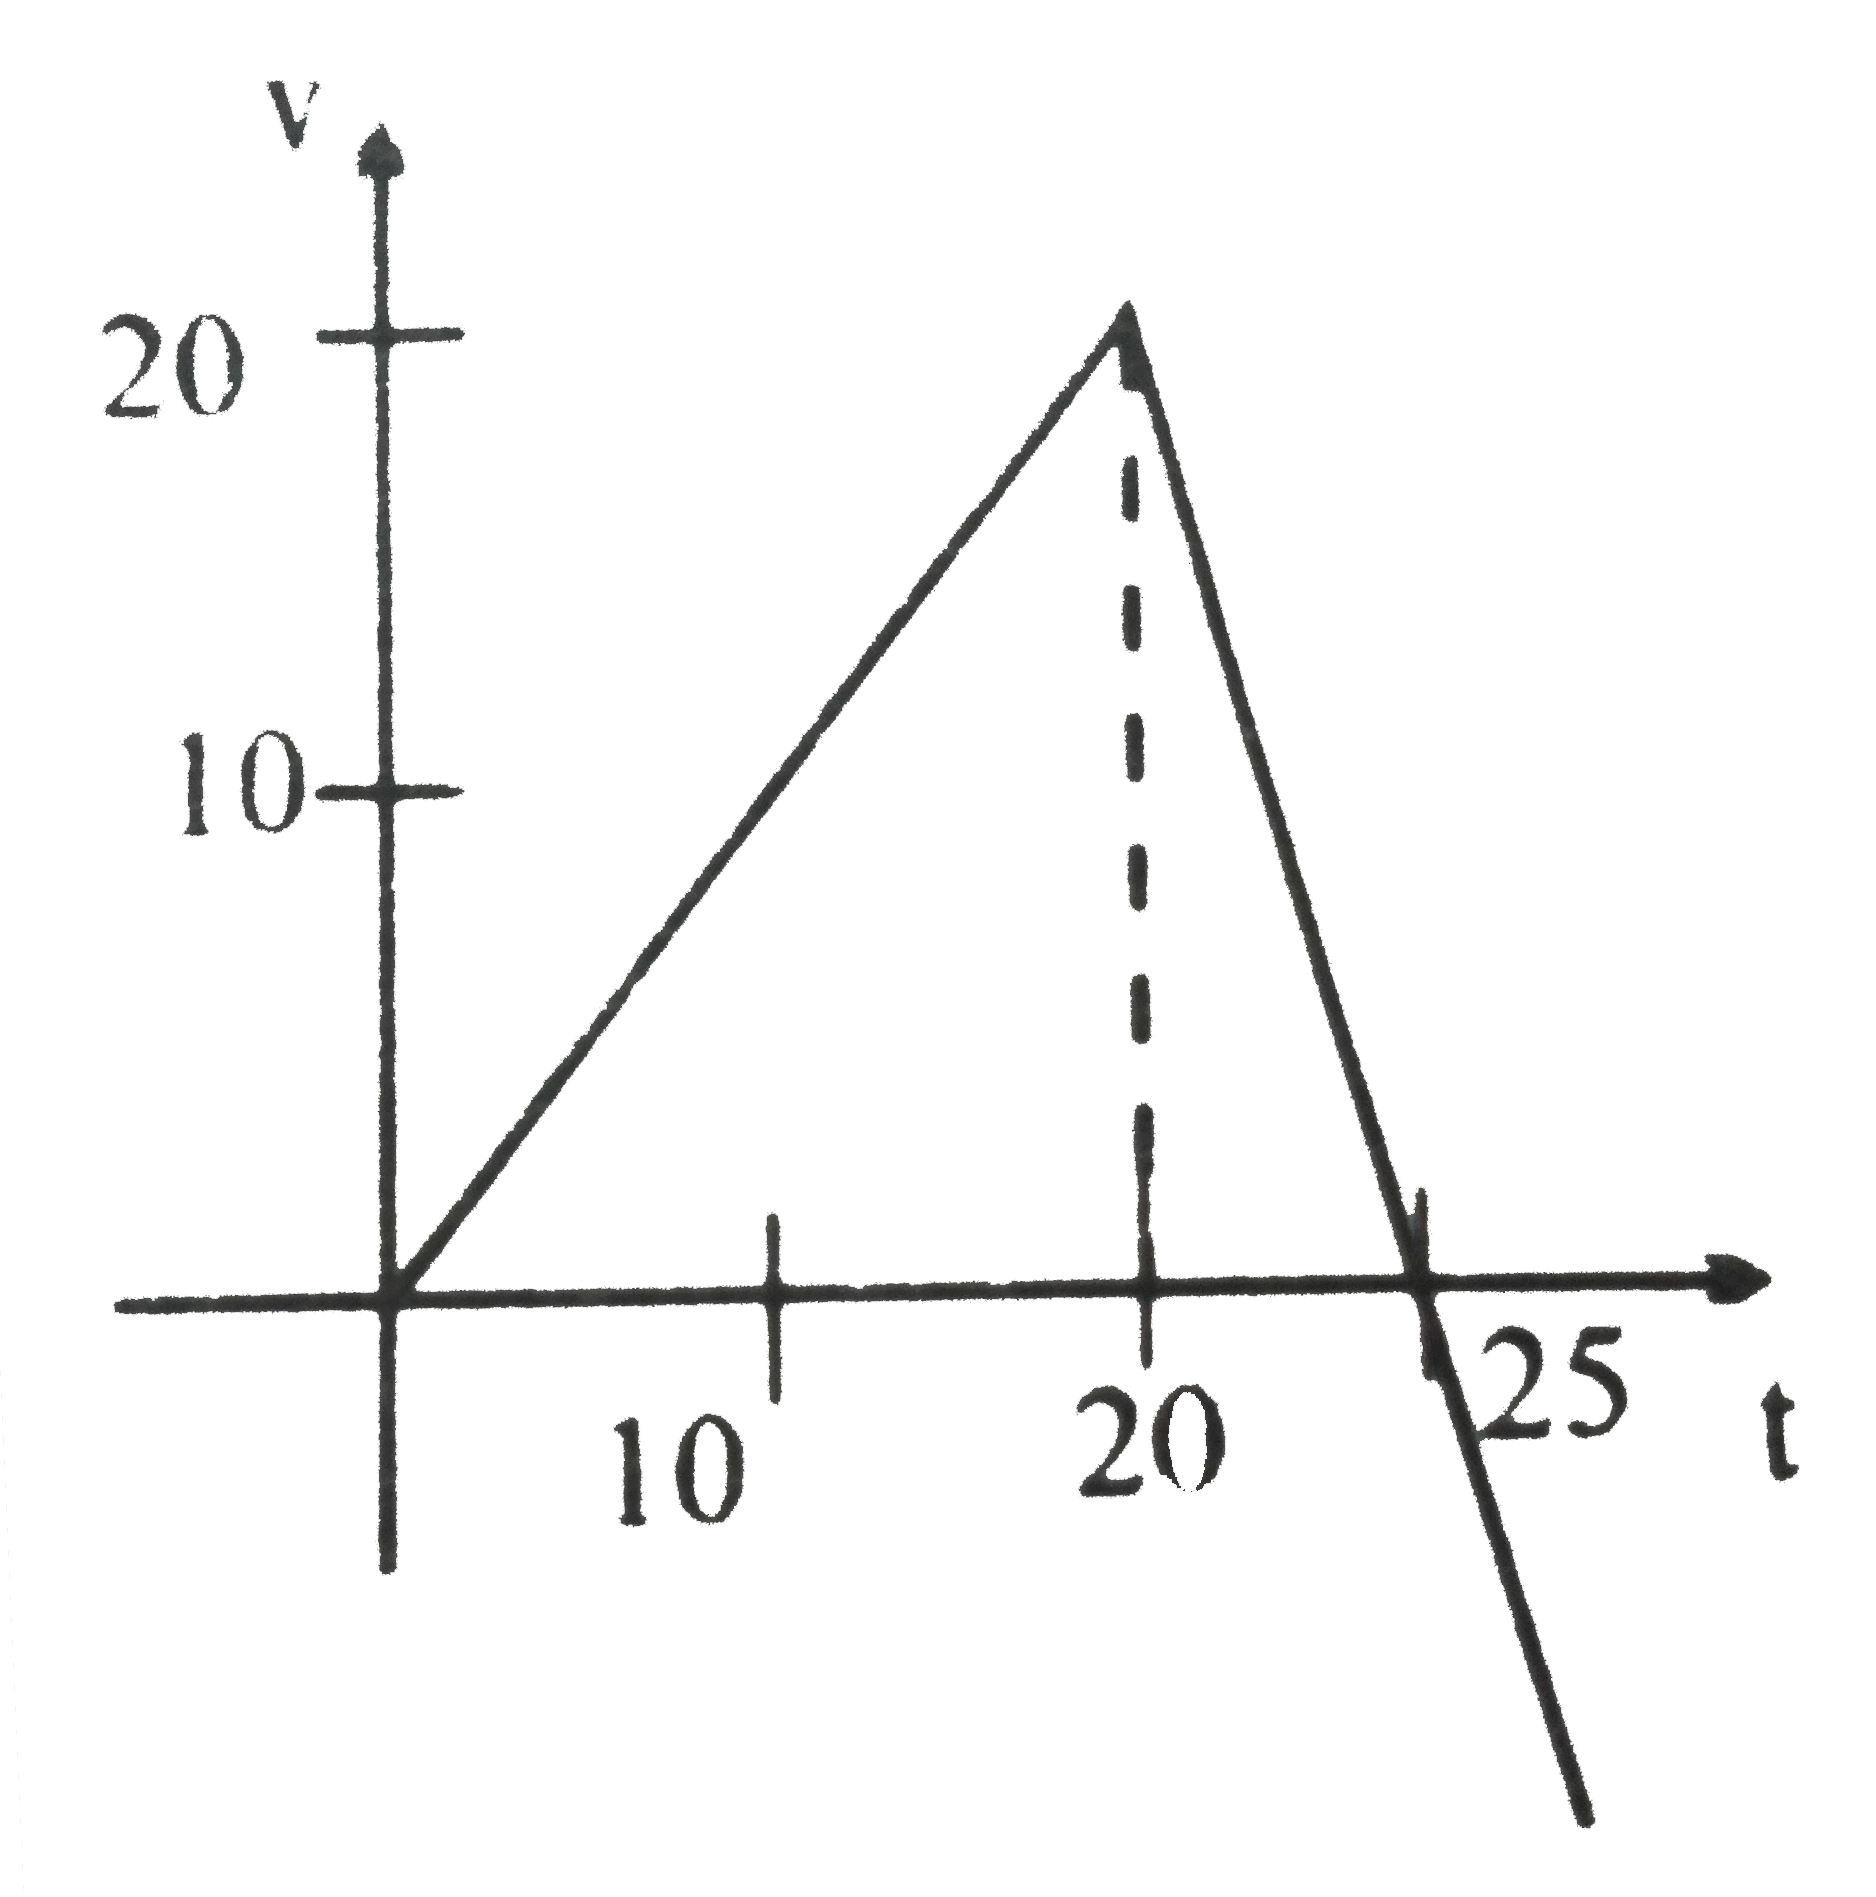
View SolutionThe fig. shows the v−t graph of a particle moving in straight line. Find the time when particle returns to the starting point.
 View Solution
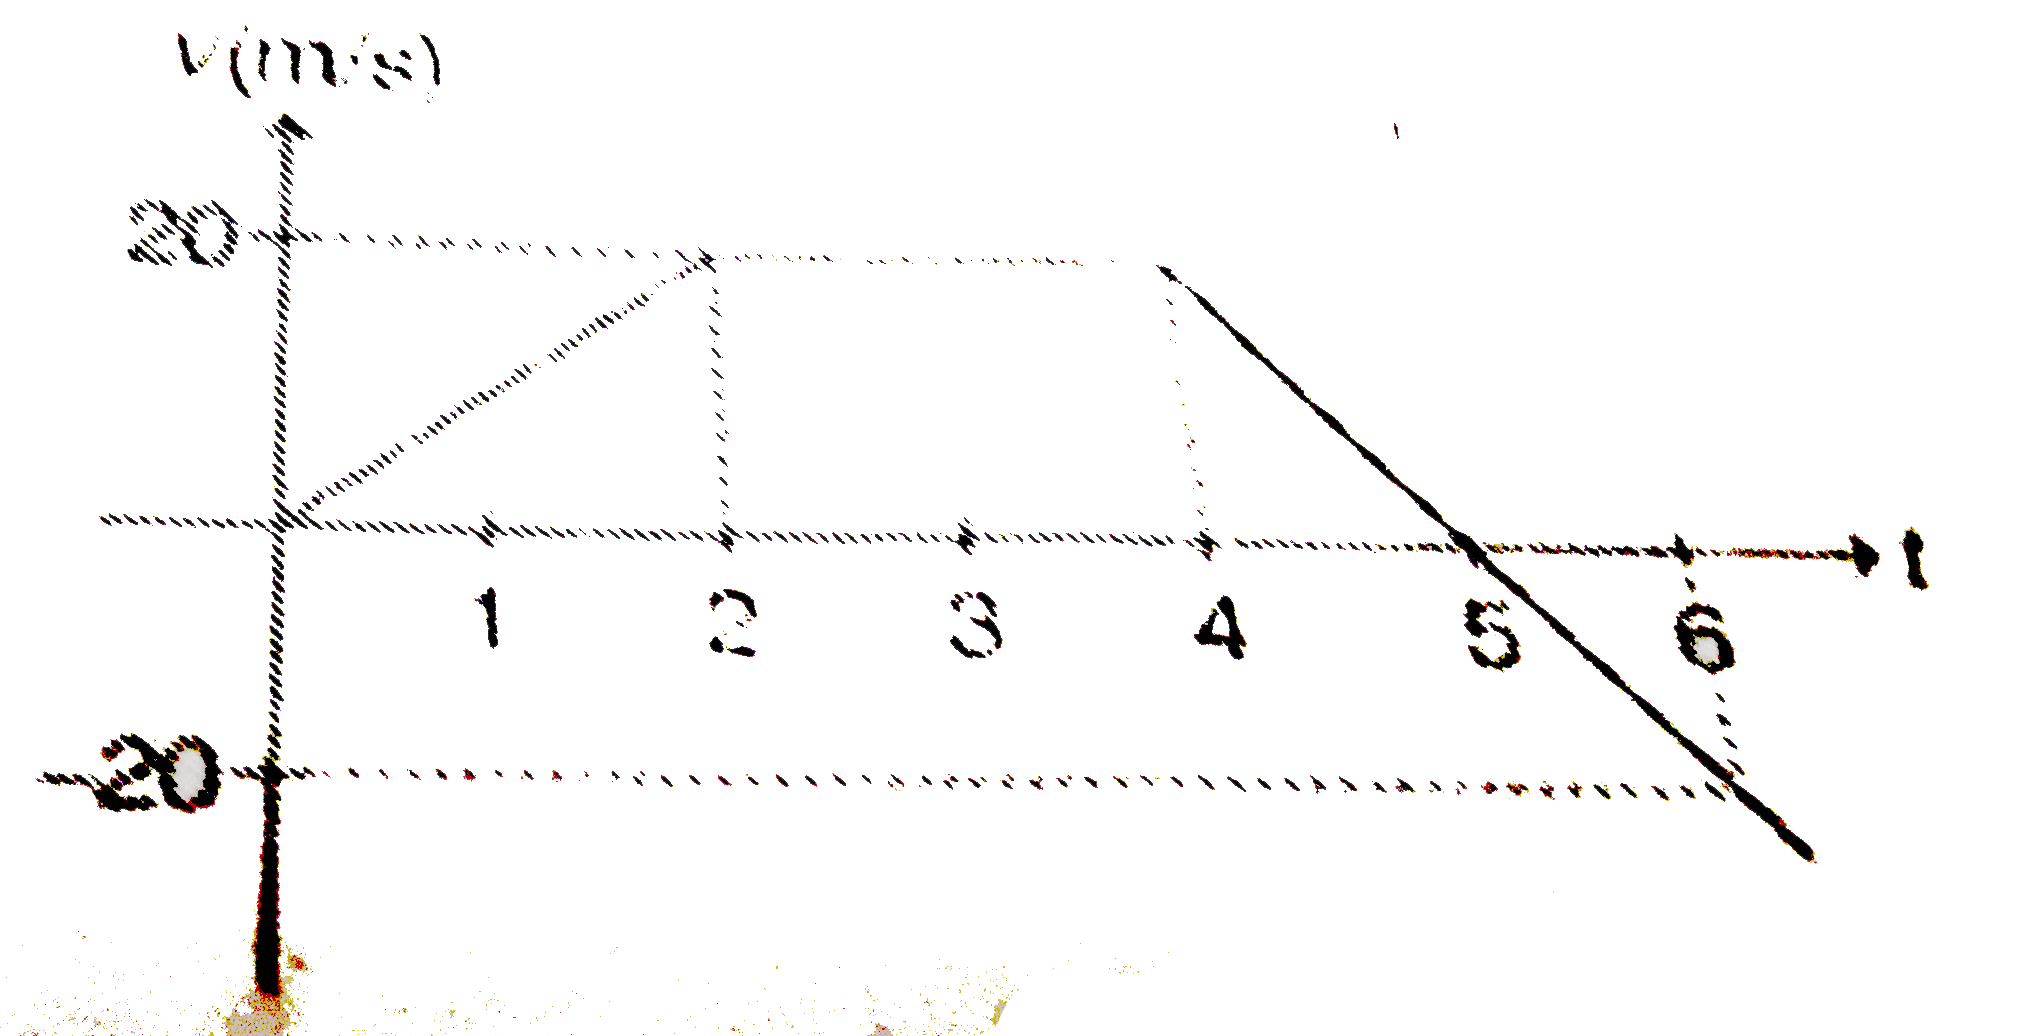
Figure shows the velocity time graph for a particle travelling along a straight line. The magnitude of average velocity (in m/s) of particle during the time interval from t=0 to t=6s is 10α. Find the value of α.
 View Solution
A piece of cork starts from rest at the bottom of a lake and floats up. Its velocity v is plotted against time t. Which of the following best represents the resulting curve?
_S01_061_Q01.png) View Solution
View Solution


