The following table represents the position of a car with time in a fixed direction.

Plot displacement-time graph and find graphically
(i) the velocity of the car
(ii) the displacement of the car at 3.5 s and 4.5 s
(i)v=10ms−1
(ii) 35m,45m
Topper's Solved these Questions
- DESCRIPTION OF MOTIONBOOK - CENGAGE PHYSICSCHAPTER - DESCRIPTION OF MOTIONEXERCISE - MANDATORY EXERCISE (EXERCISE SET - III)
12 Videos
- DESCRIPTION OF MOTIONBOOK - CENGAGE PHYSICSCHAPTER - DESCRIPTION OF MOTIONEXERCISE - CONSOLIDATED EXERCISE (COMPREHENSION)
7 Videos
- DESCRIPTION OF MOTIONBOOK - CENGAGE PHYSICSCHAPTER - DESCRIPTION OF MOTIONEXERCISE - MANDATORY EXERCISE (EXERCISE SET - I)
22 Videos
- ELASTICITYBOOK - CENGAGE PHYSICSCHAPTER - ELASTICITYEXERCISE - OLYMPIAD AND NTSE LEVEL EXERCISES
10 Videos
Similar Questions
The following table represents the distance of a car at different instants in a fixed direction.

(a) Draw a displacement-time graph and with its help, find whether the motion of the car is uniform or non-uniform?
(b) Use graph to calculate :
(i) the velocity of car (ii) the displacement of car at t = 2.5 s and t = 4.5 s.
View SolutionFollowing table gives the displacement of a car at different instants of time. (a) Draw the displacement-time sketch and find the average velocity of car.
(b) What will be the displacement of car at (i) 2.5 s and (ii) 4.5 s?

View Solution
Knowledge Check
The velocity time graph of the motion of a car is given here.
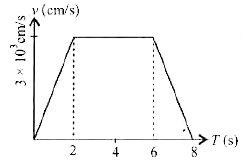 AThe distance travelled by the car in the first six seconds is 150 m.BThe deceleration of the car during the last two seconds are −15ms2.CThe distance travelled by the car in the first six second is 220 m.DThe deceleration of the car during the last two second is −20ms2
If d denotes the distance covered by a car in time t and →s denotes the displacement by the car during the same time, then :
Ad≤∣∣→S∣∣Bd=∣∣→S∣∣ onlyCd≥∣∣→S∣∣Dd≤∣∣→S∣∣
The following figure represents the velocity-time graph of a moving car on a road:
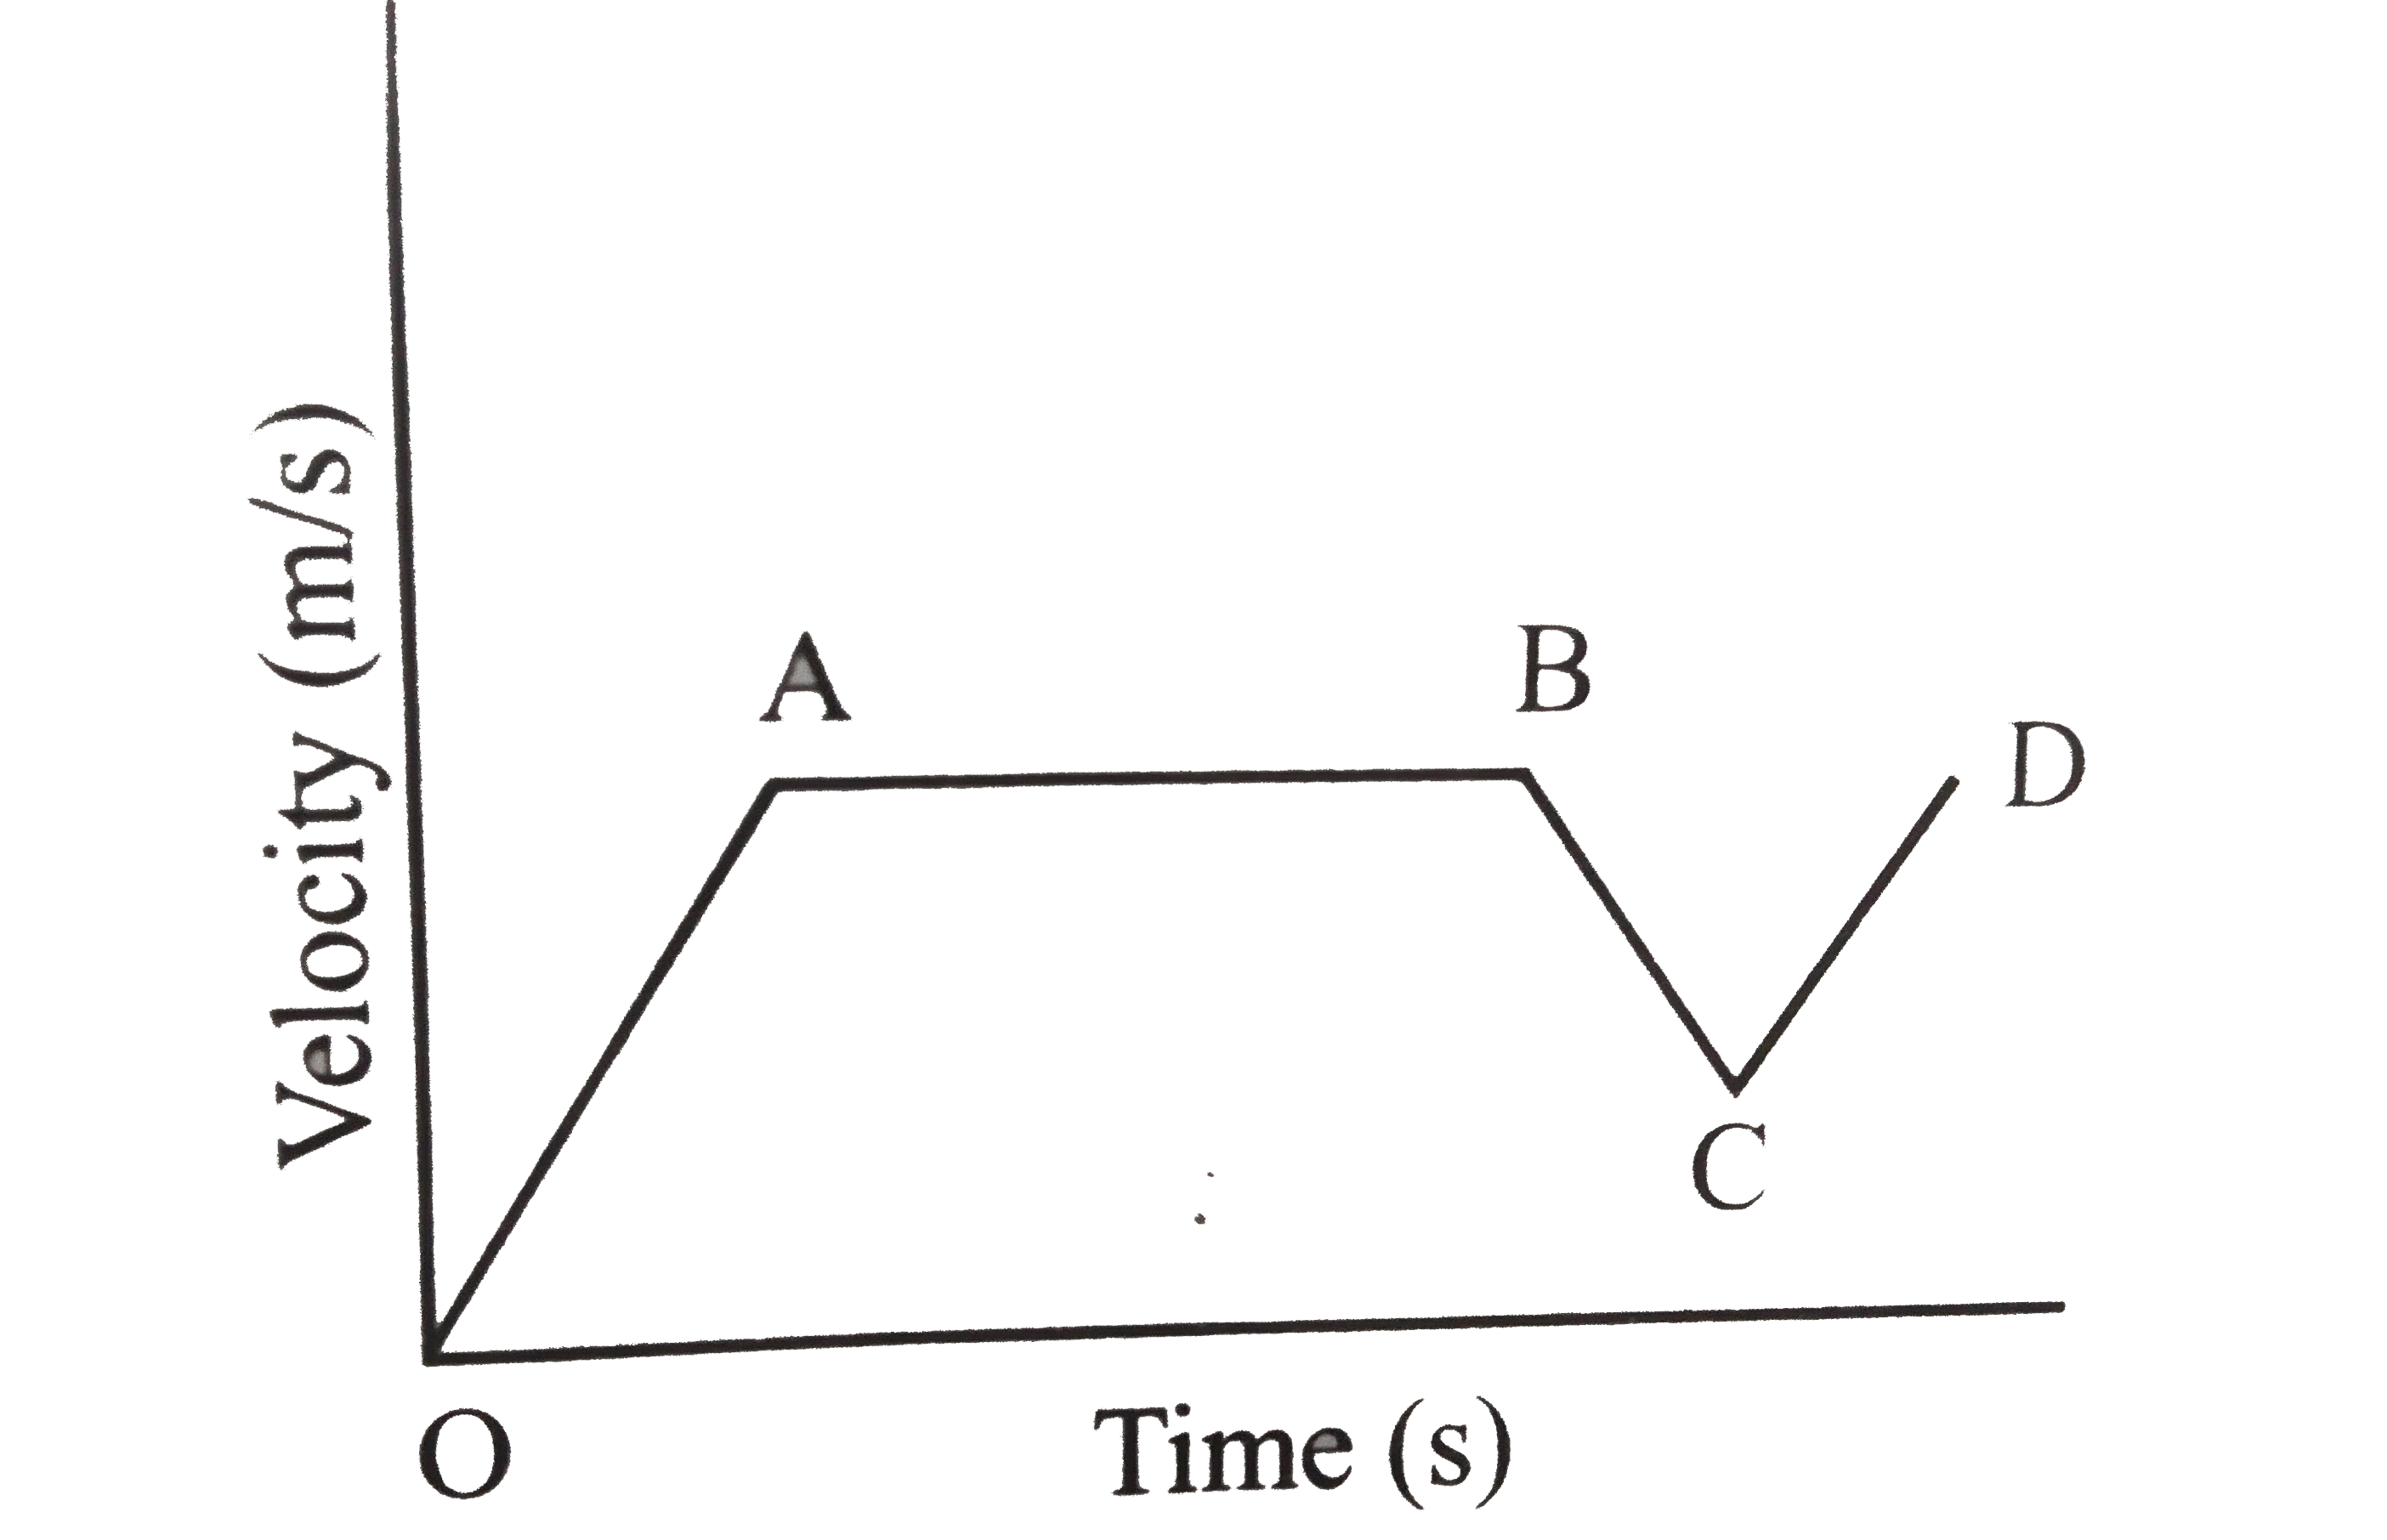
Which segment of the graph represents the retardation?
View SolutionA body is moving in a straight line and its displacement at various instants of time is given in the following table :

Plot displacement-time graph and calculate :
(i) total distance travelled in interval 1 s to 5 s,
(ii) average velocity in time interval 1 s to 5 s.
View Solution5.The displacement s of a particle at a time t is given by s= 2t - 5t + 4t - 3, find (i) the time when the acceleration is 14 ft/sec (ii)the velocity and the displacement at that time.
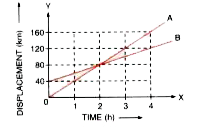
View SolutionFig. 2.40 ahead represents the displacement-time sketch of motion of two cars A and B. Find :(i) the distance by which the car B was initially ahead of car A.
(ii) the velocities of car A and car B.
(iii) the time in which car A catches car B.
(iv) the distance from start when the car A will catch the car B.
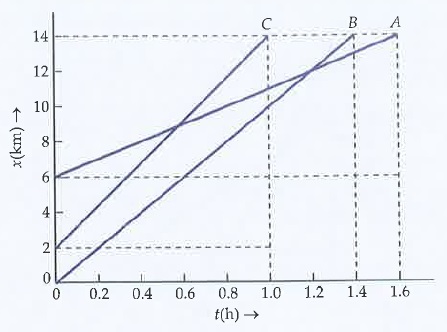
View SolutionFigure shows the position-time graphs of three car A, B and C. On the basis of the graphs, answer the following questions : What is the relative velocity of car B with respect to car C ?
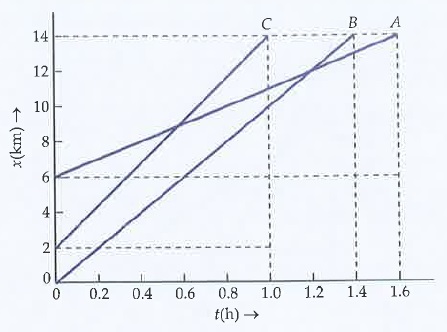
View SolutionFigure shows the position-time graphs of three car A, B and C. On the basis of the graphs, answer the following questions : What is the relative velocity of car C with respect to car A ?
View Solution
