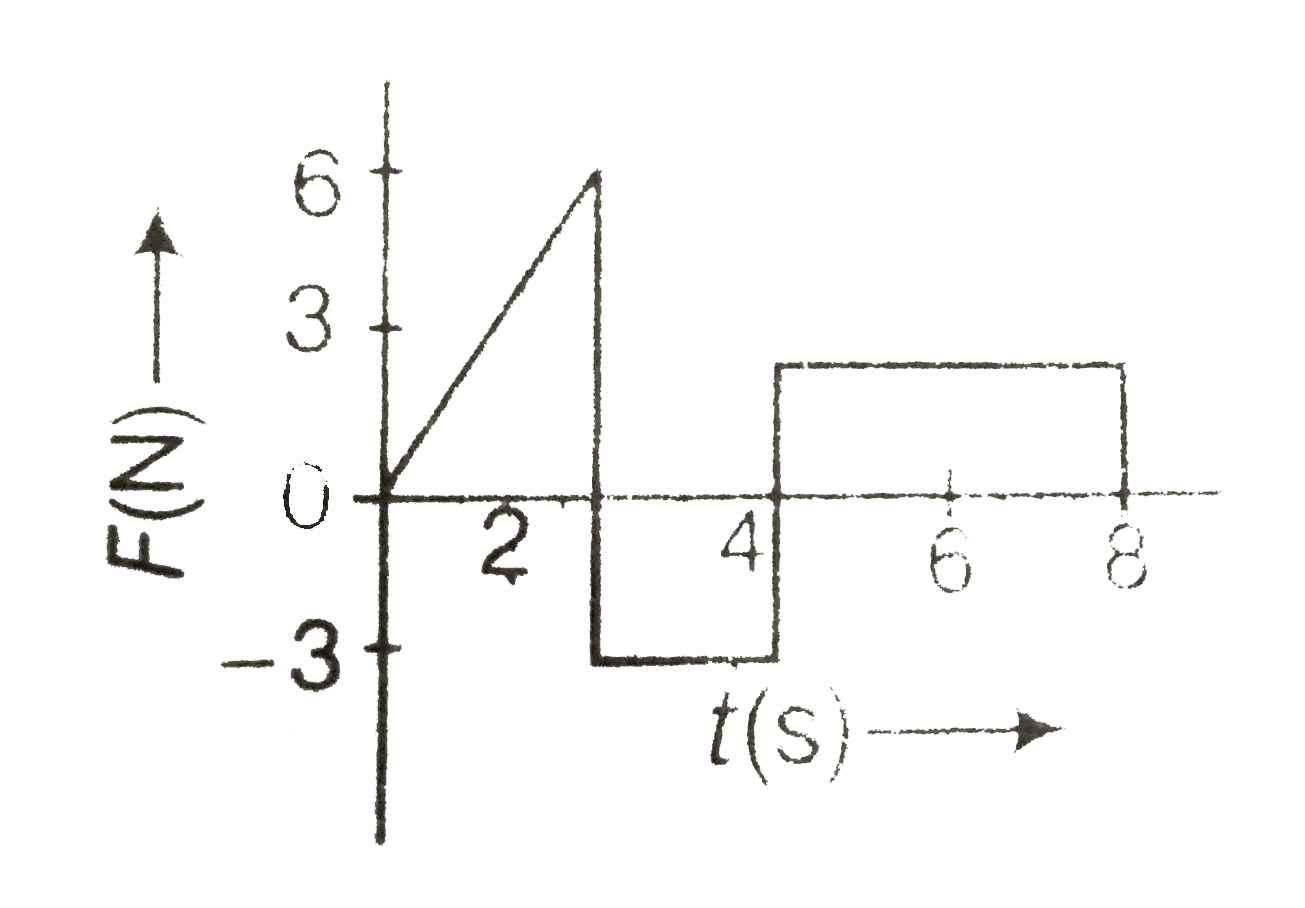
The force F acting on a particle of mass m is indicated by the force-time graph shown below. The change in momentum of the particle over the time interval from 0 to 8 s is
24 Ns
20 Ns
12 Ns
6 Ns
The correct Answer is:C
Step by step video solution for The force F acting on a particle of mass m is indicated by the force-time graph shown below. The change in momentum of the particle over the time interval from 0 to 8 s is by Physics experts to help you in doubts & scoring excellent marks in Class 12 exams.
Updated on:21/07/2023Similar Questions
The force F acting on a partical of mass m is indicated by the force-time graph shown below. The change in momentum of the particle over time interval from zero to 8 s is.
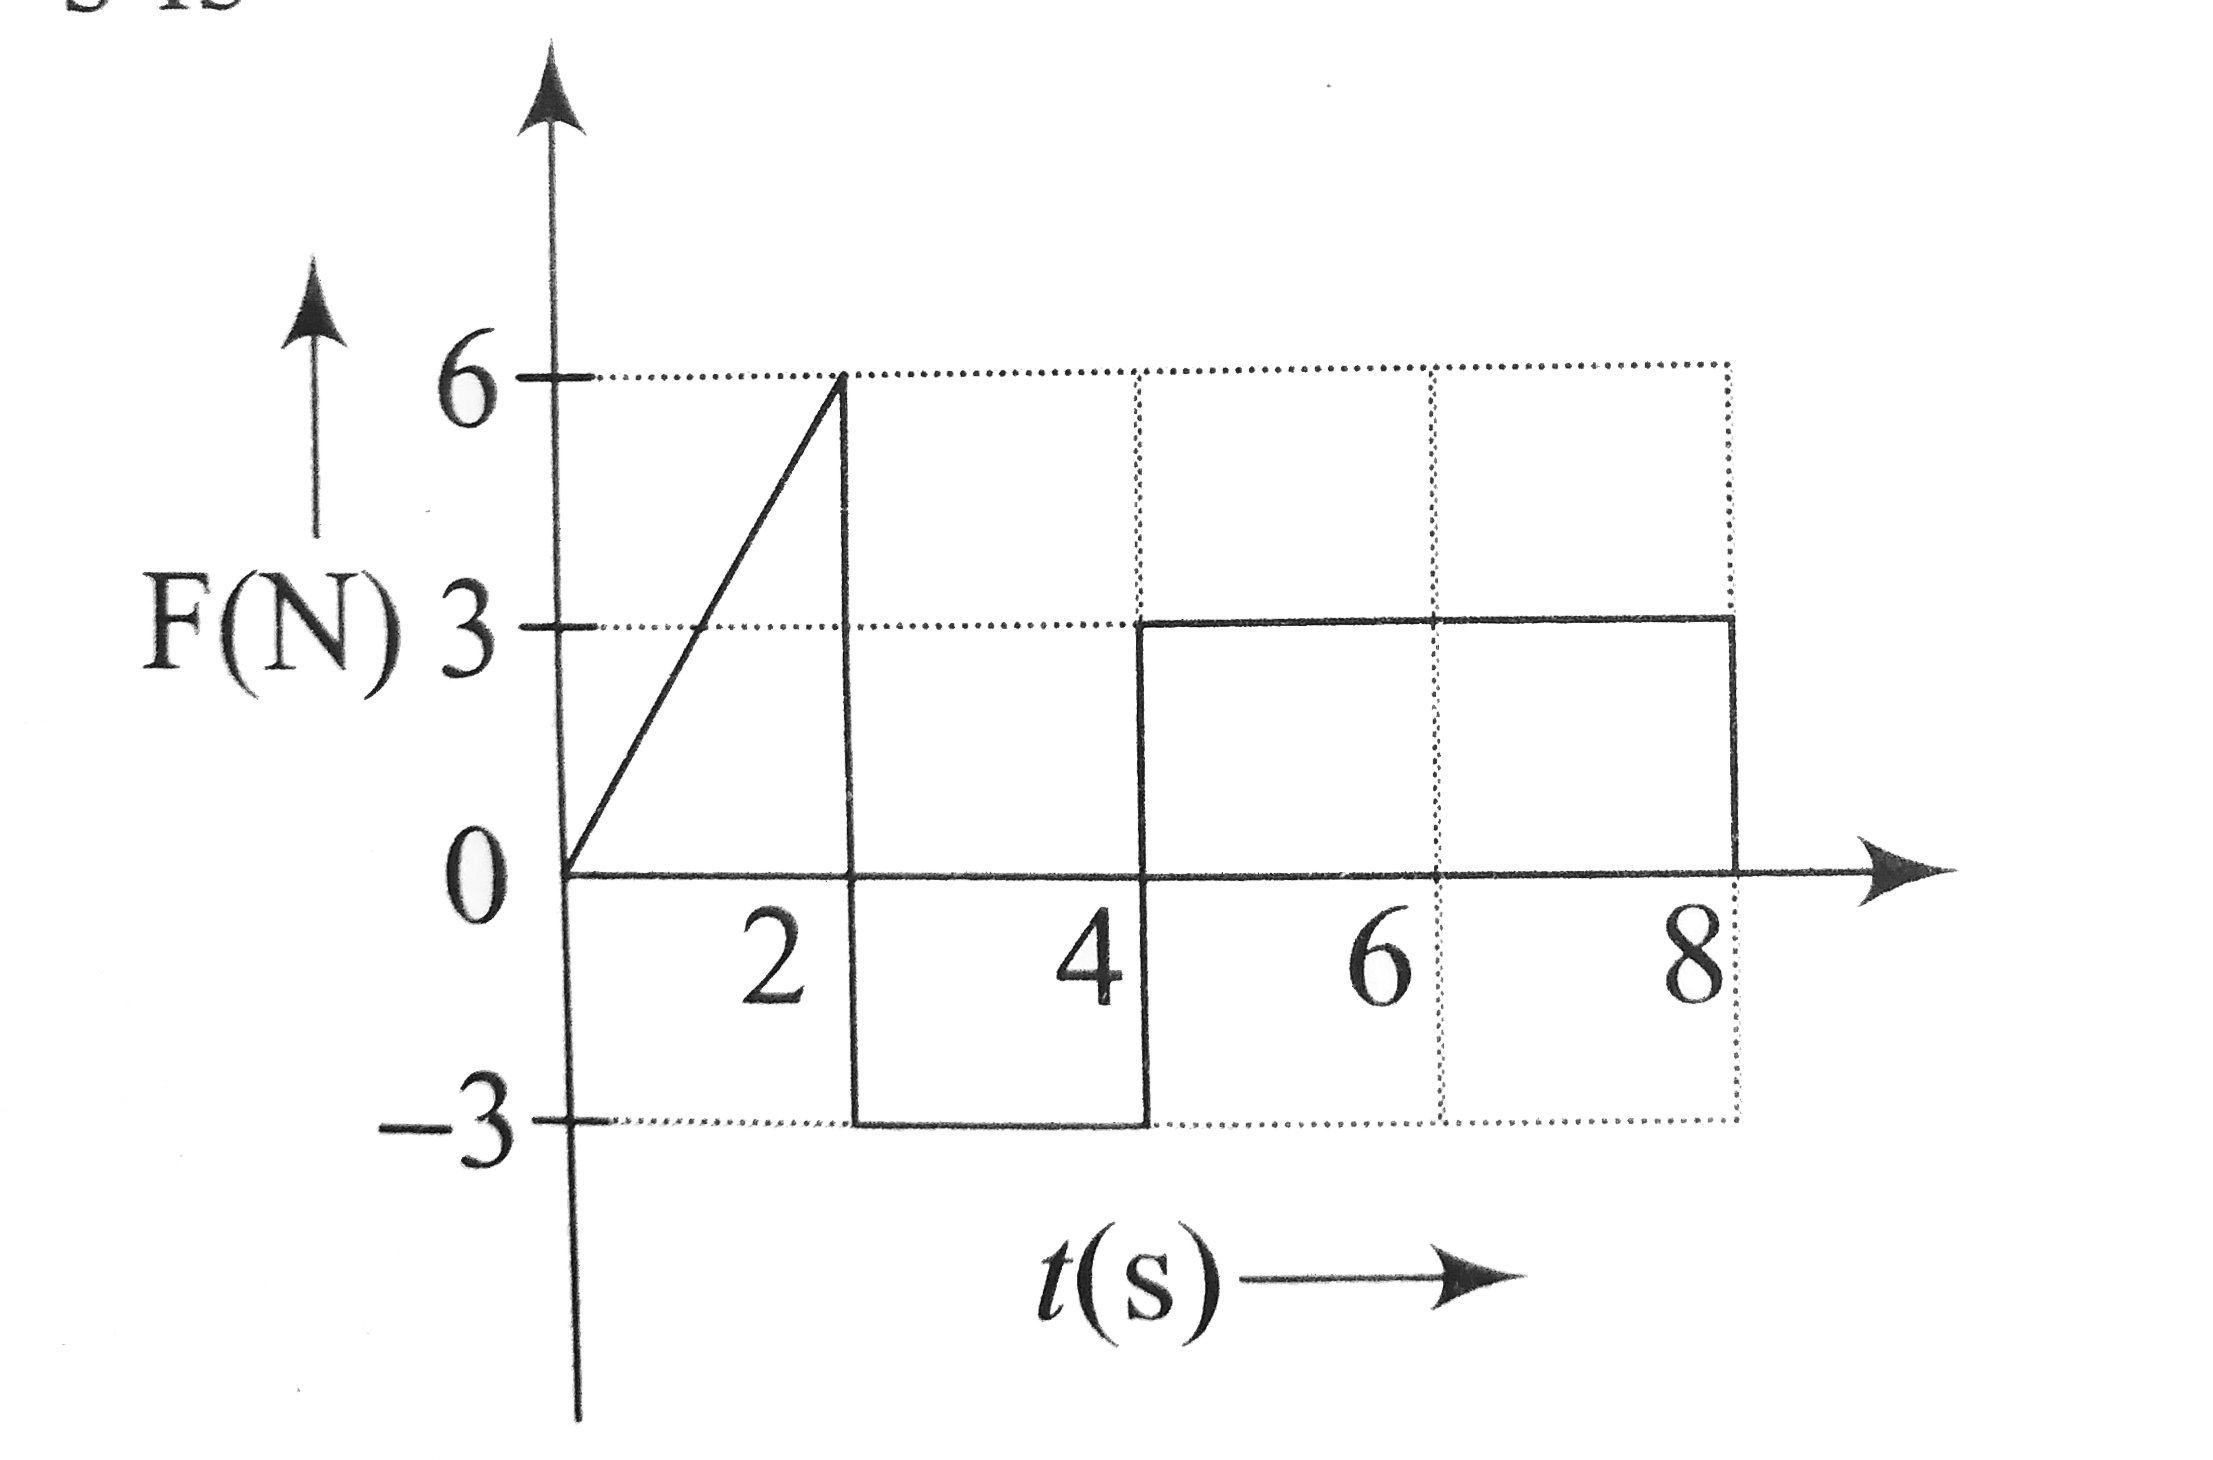
View SolutionThe force acting on a particle of mass 20 kg is indicated by force - time graph as shown in figure. The magnitude of change in linear momentum of particle during time interval 0 to 6 second is
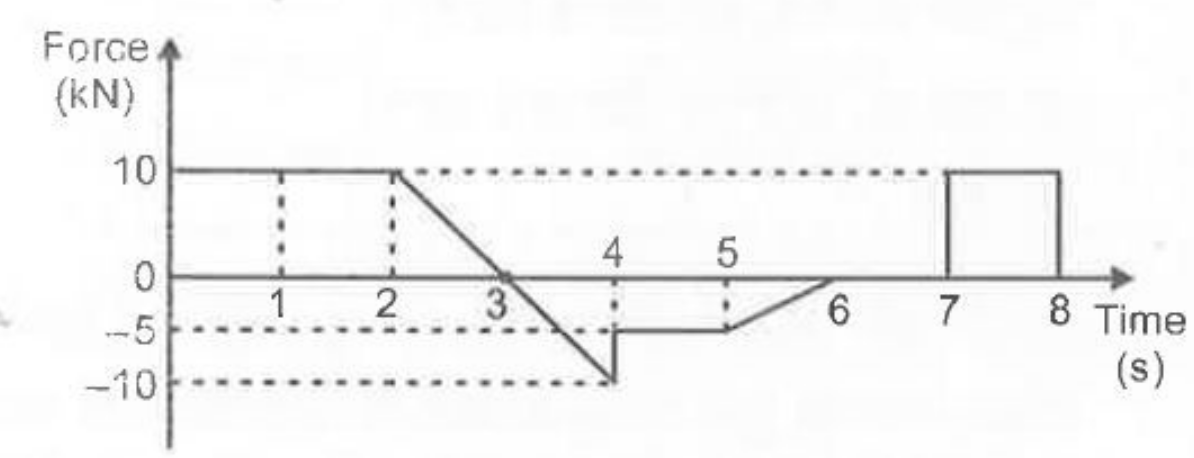
View SolutionThe force(F) acting on a particle of mass m changing with time(t) is as shown in (F−t) graph. The change in linear momentum from t=0 to t=6 s (in kN s) is

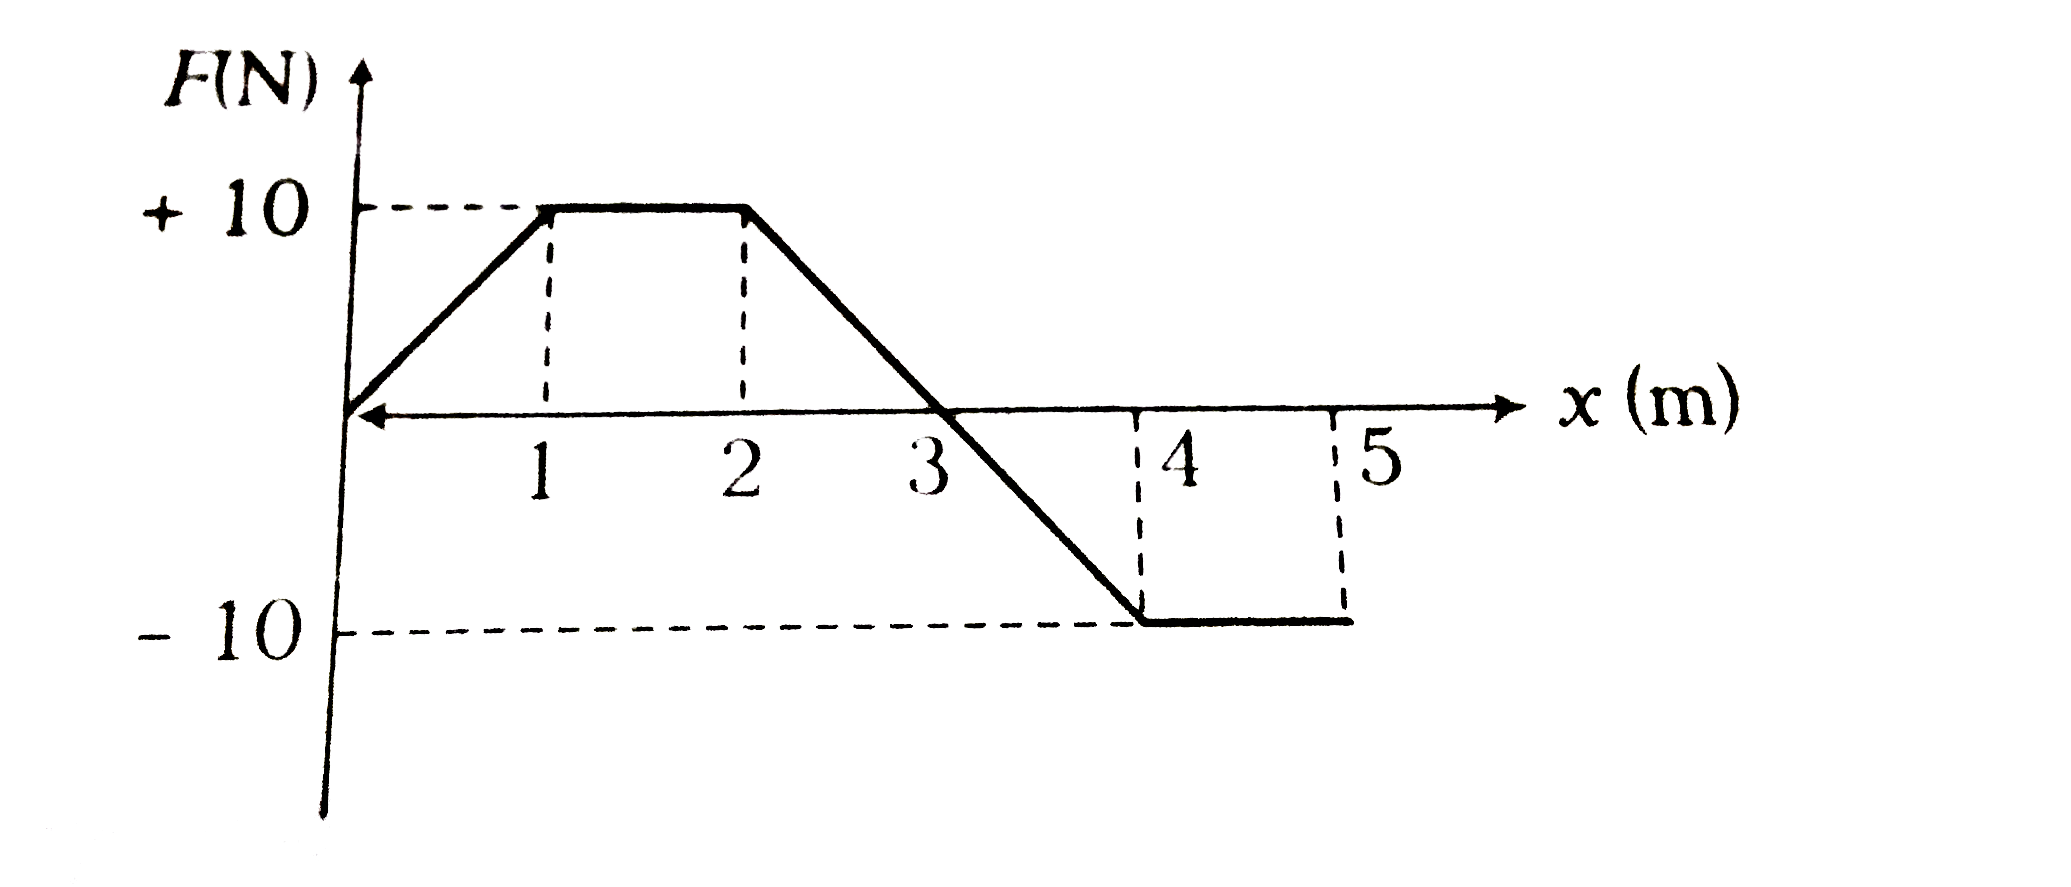
View SolutionA position dependent force F ia acting on a particle and its force-position curve is shown in the figure. Work done on the particle, when its displacement is from 0 to 5 m is
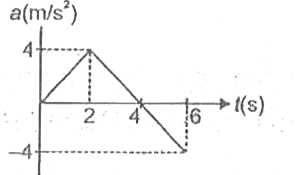
View SolutionFor the acceleration - time (a - t) graph shown in figure, the change in velocity of particle from t = 0 to t = 6 s is
View SolutionDisplacement of a particle of mass 2 kg varies with time as s=(2t2−2t+10)m. Find total work done on the particle in a time interval from t=0 to t=2s.
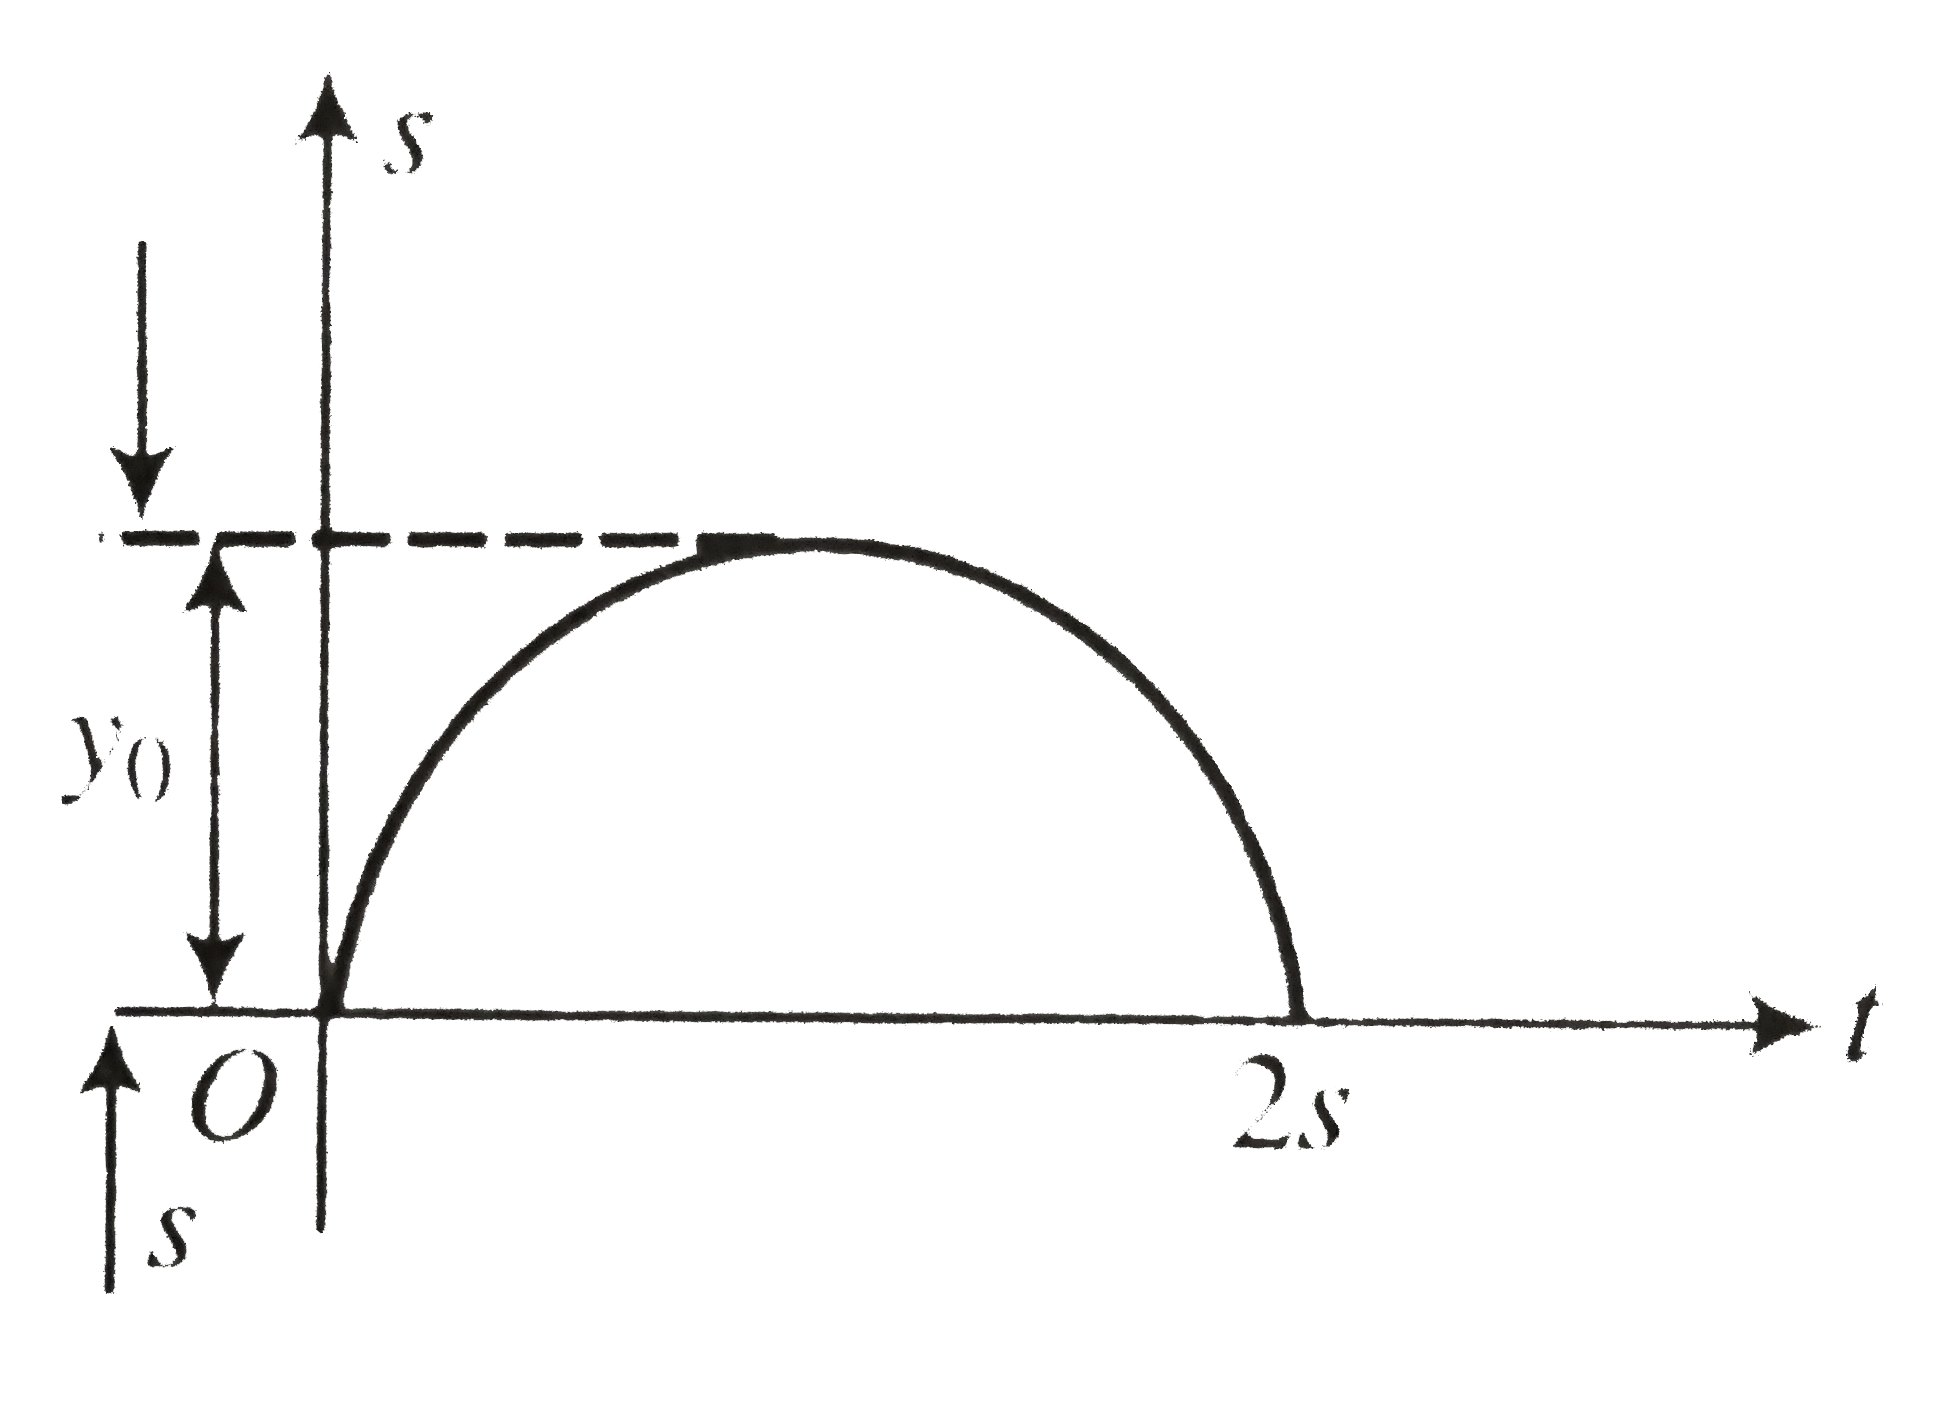
View SolutionA particle moves rectilinearly possessing a parabolic s-t graph. Find the average velocity of the particle over a time interval from t=12s→t=1.5s.
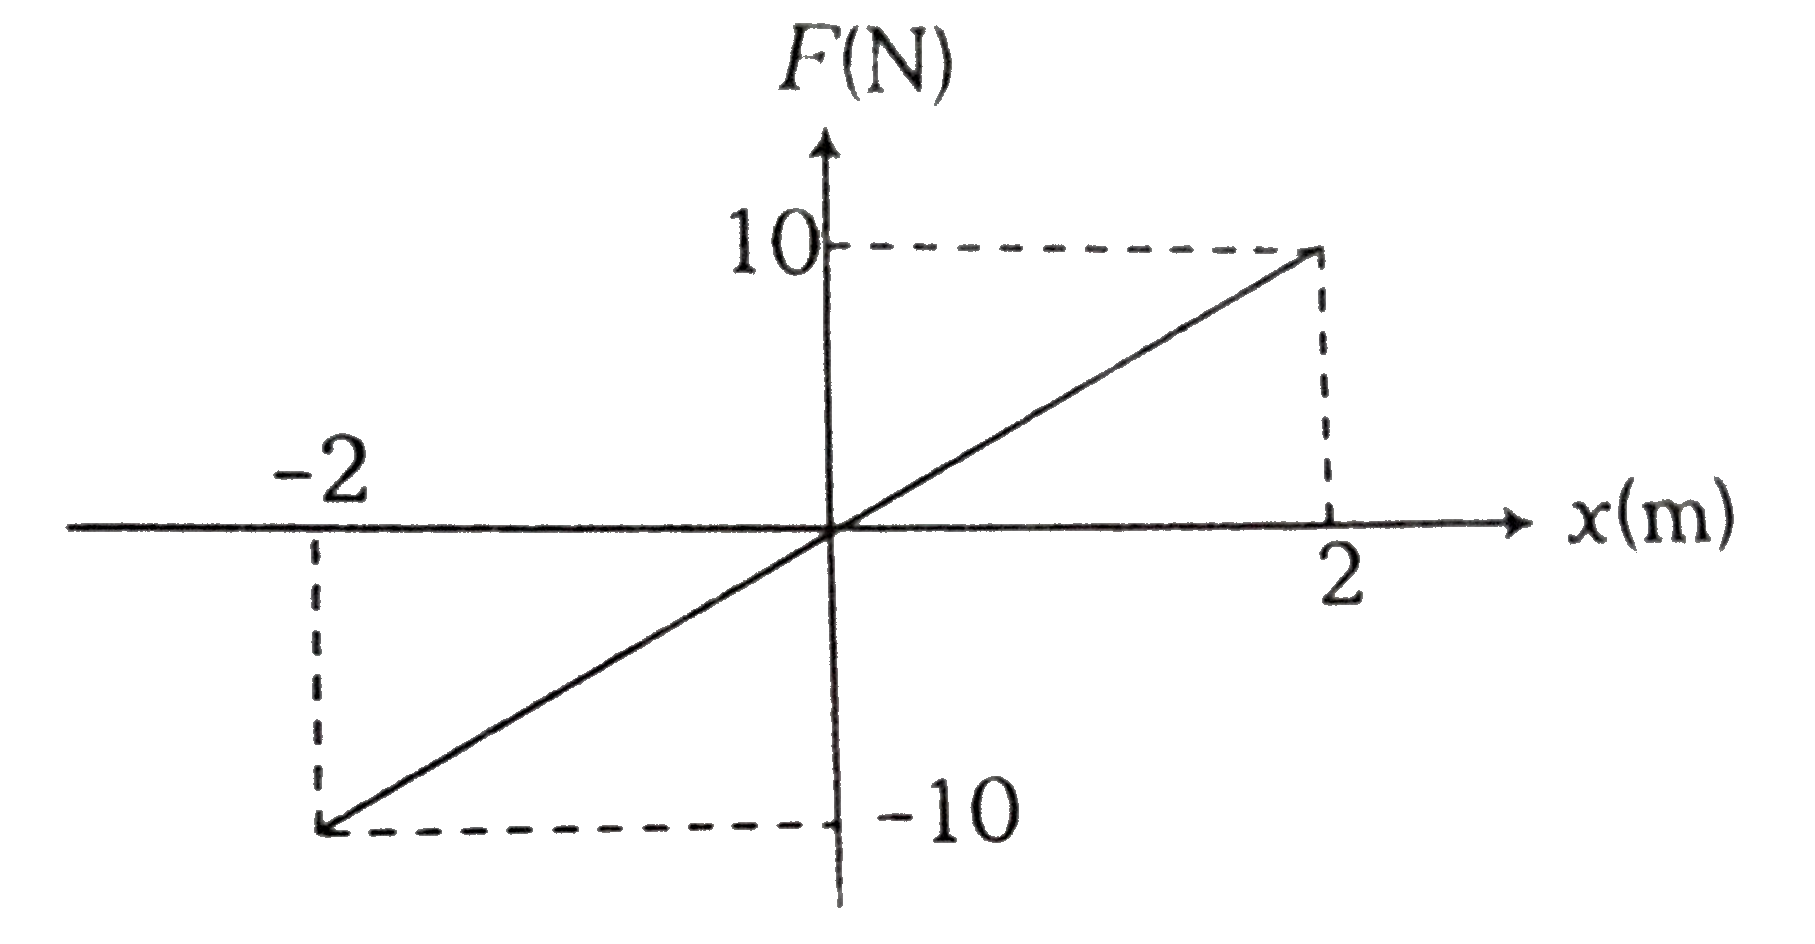
View SolutionThe variation of force (F) acting on a particle of mass 800 g with position (x) is as shown in figure. The time period of oscillation of the particles is
View SolutionA force F acting on a particle varies with the position x as shown in figure. Find the work done by this force in displacing the particle from
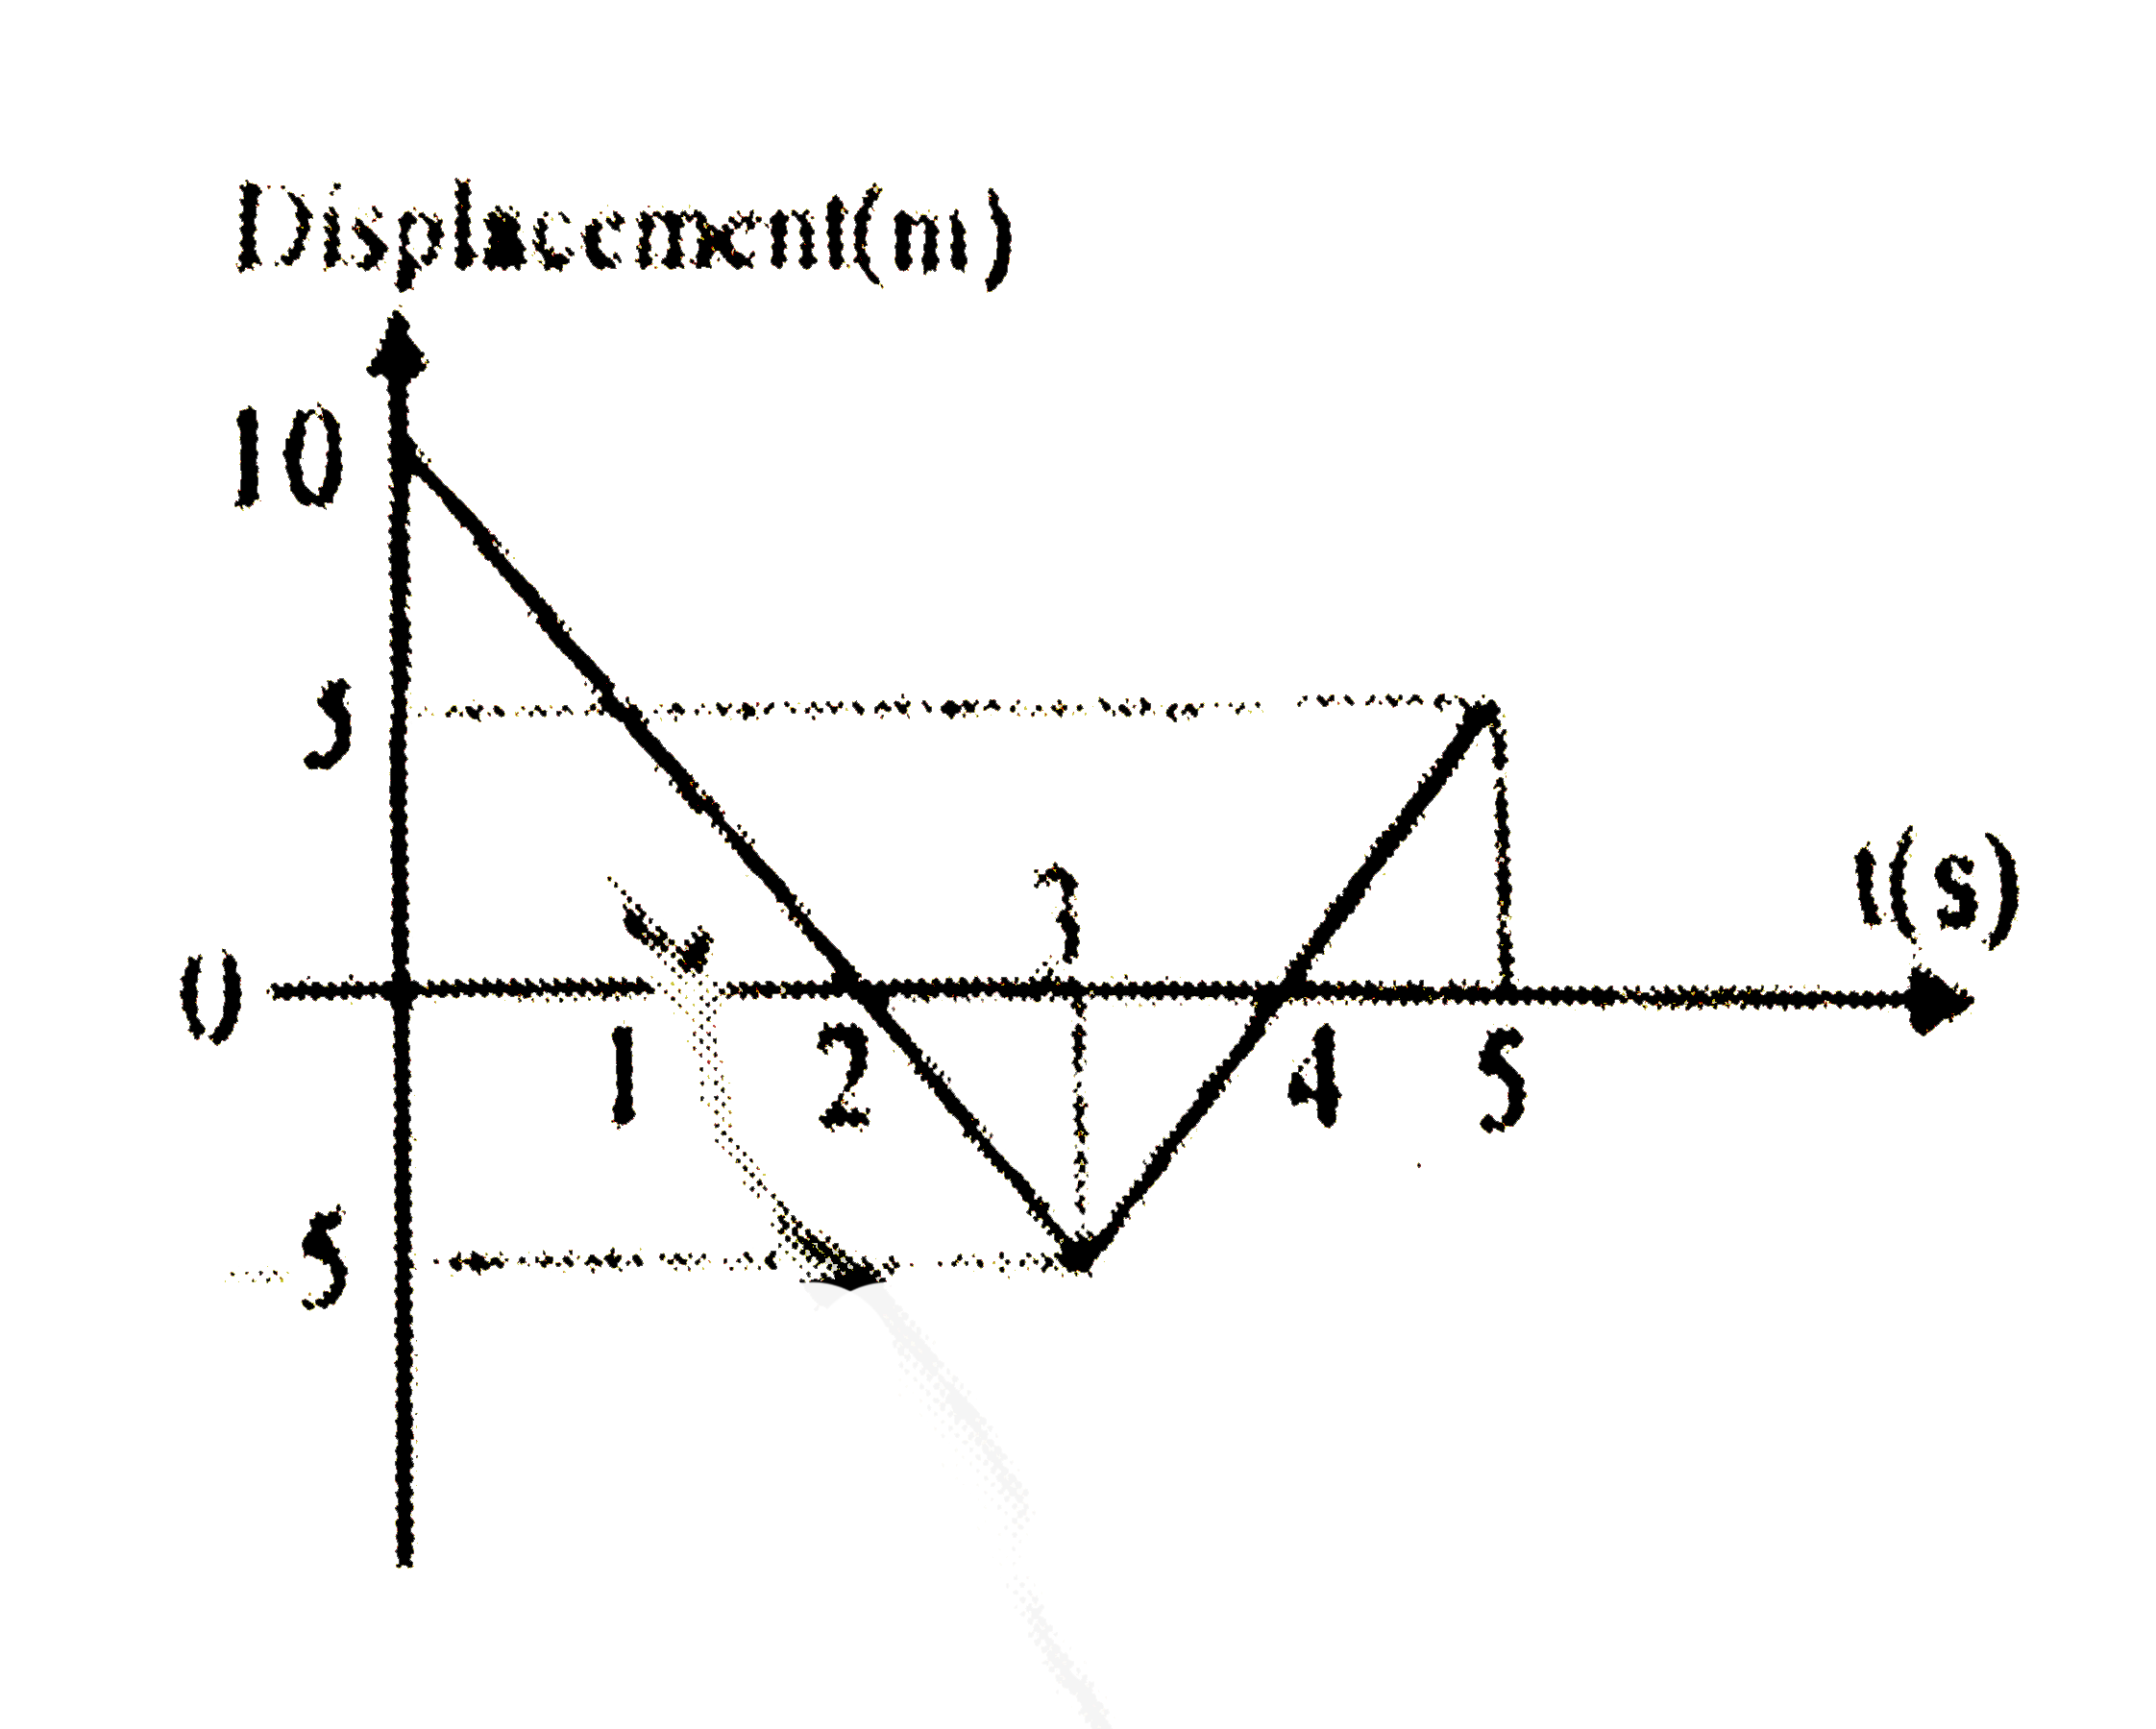
View SolutionThe diagram shows the displacement - time graph for a particle moving in a straight line. The distance (in m) coverted by the particle in the time interval t=0 to t=5s is
View Solution
