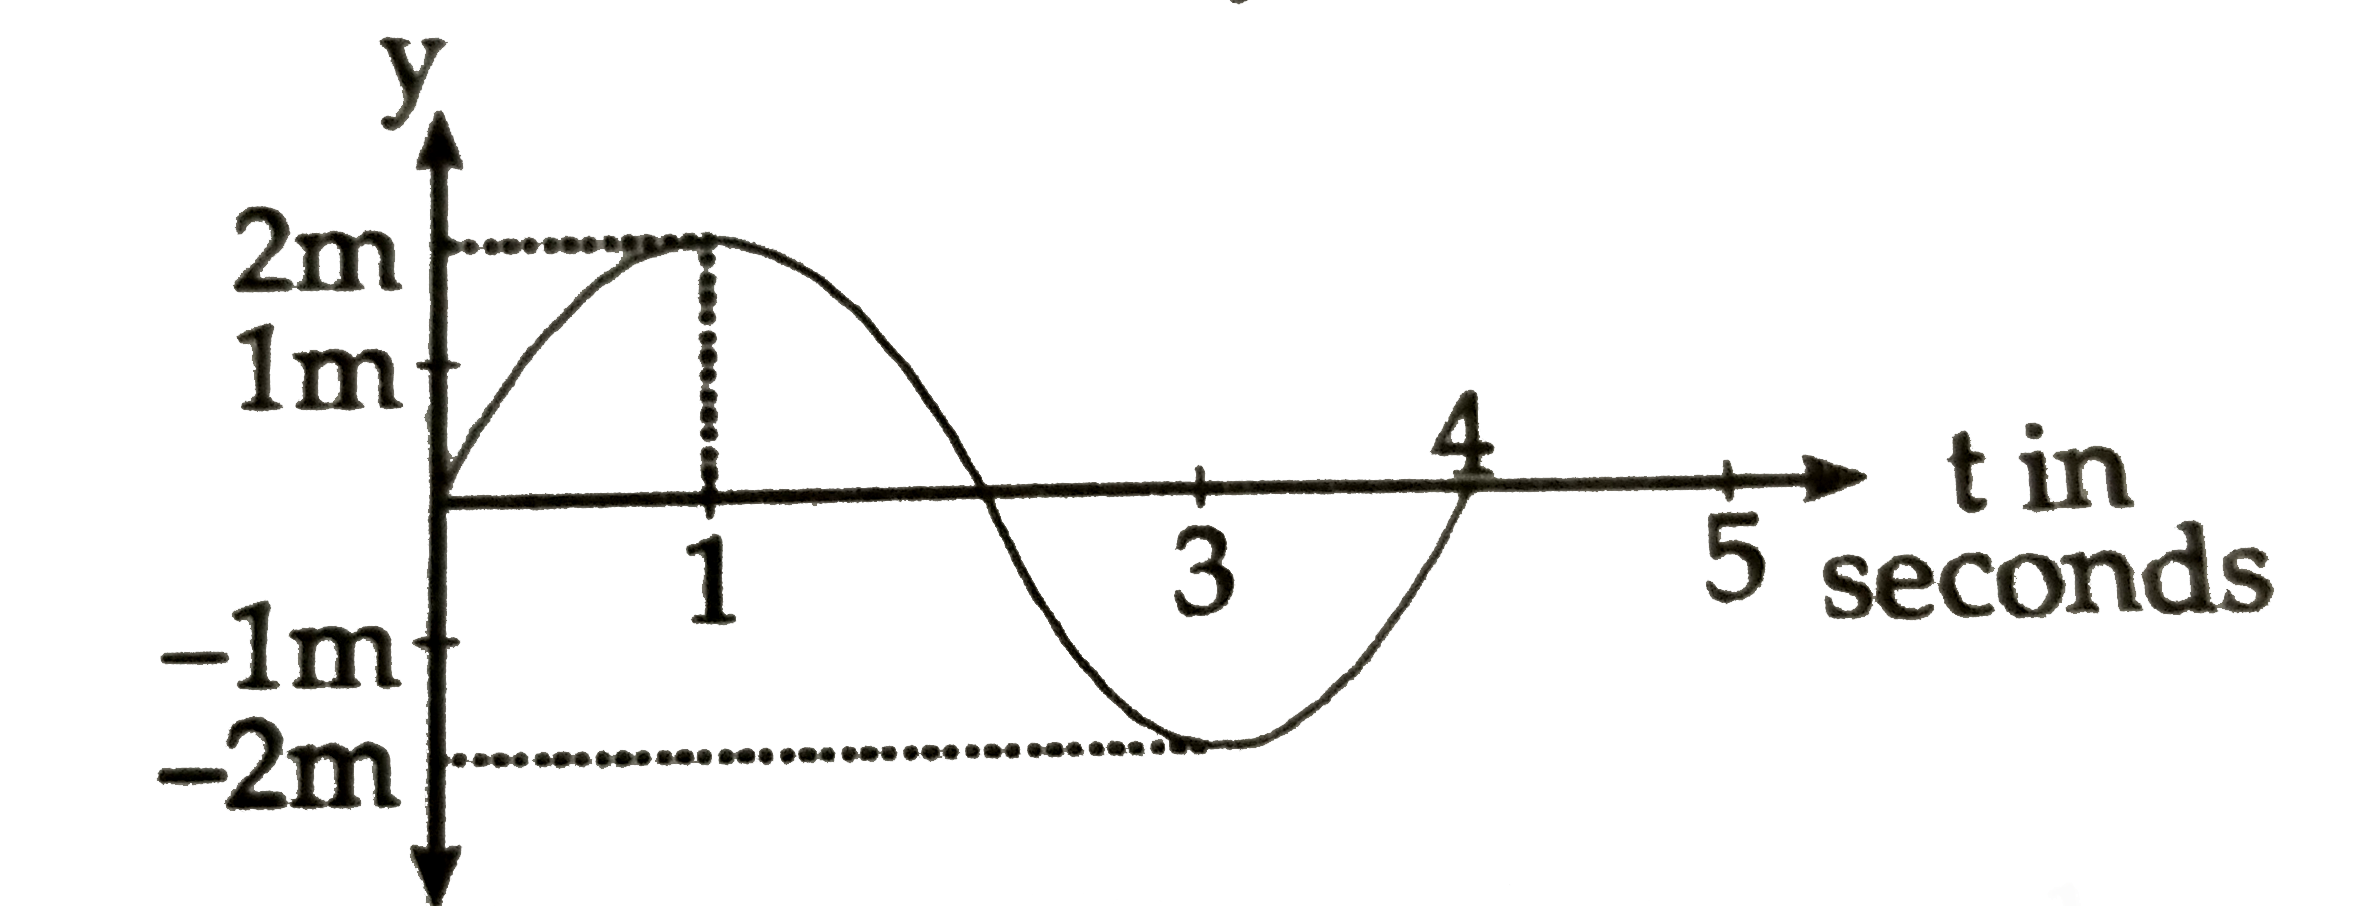
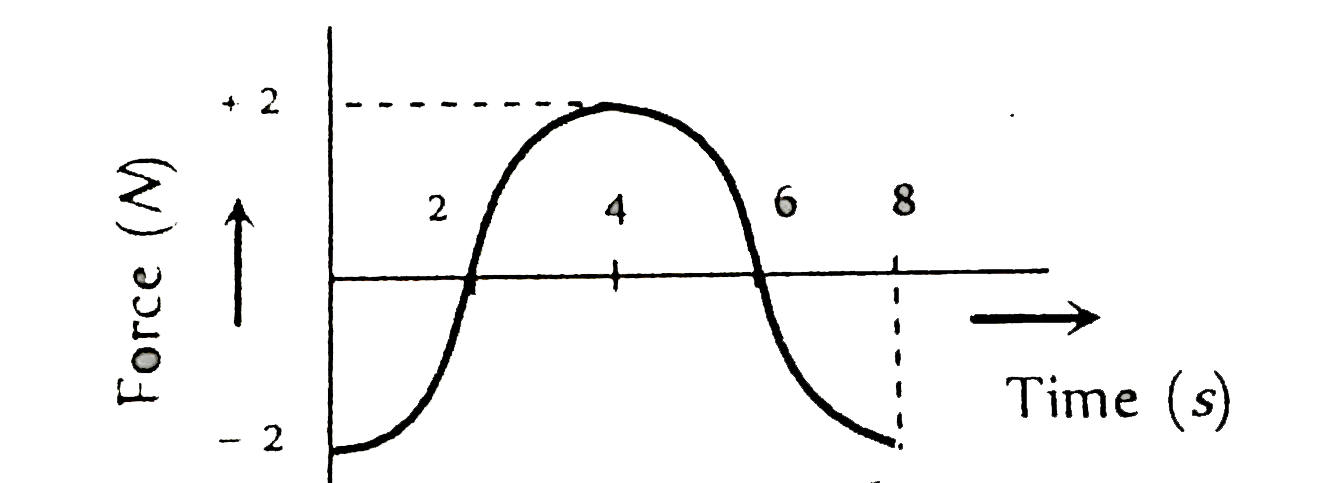
The force-time(F–t) curve of a particle executing linear motion is as shown in the figure. The momentum acquired by the particle in time interval from zero to 8 second will be
−2 N-s
+4 N-s
6 N-s
Zero
The correct Answer is:D
Step by step video, text & image solution for The force-time( F – t ) curve of a particle executing linear motion is as shown in the figure. The momentum acquired by the particle in time interval from zero to 8 second will be by Physics experts to help you in doubts & scoring excellent marks in Class 11 exams.
Topper's Solved these Questions
- BOOK - ERRORLESS CHAPTER - NEWTONS LAWS OF MOTIONEXERCISE - Assertion & Reason25videos
NEWTONS LAWS OF MOTION
- BOOK - ERRORLESS CHAPTER - NEWTONS LAWS OF MOTIONEXERCISE - Self Evaluation Test16videos
NEWTONS LAWS OF MOTION
- BOOK - ERRORLESS CHAPTER - NEWTONS LAWS OF MOTIONEXERCISE - Critical Thinking19videos
NEWTONS LAWS OF MOTION
- BOOK - ERRORLESS CHAPTER - MOTION IN TWO DIMENSIONEXERCISE - Exercise319videos
MOTION IN TWO DIMENSION
- BOOK - ERRORLESS CHAPTER - ROTATIONAL MOTIONEXERCISE - Practice Problems (Problems based on motion of connected mass)10videos
ROTATIONAL MOTION
Similar Questions
Knowledge Check
- Question 1 - Select One
The displacement time graph of a particle executing SHM is as shown in the figure
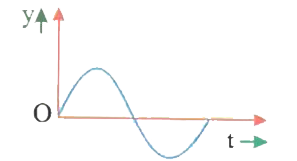
The corresponding force-time graph of the particle isA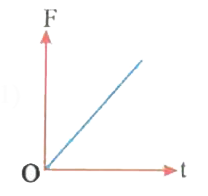 B
B C
C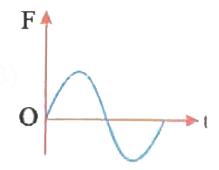 D
D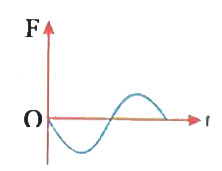
- Question 2 - Select One
The displacement time graph of a particle executing S.H.M. is as shown in the figure
The corresponding force-time graph of the particle is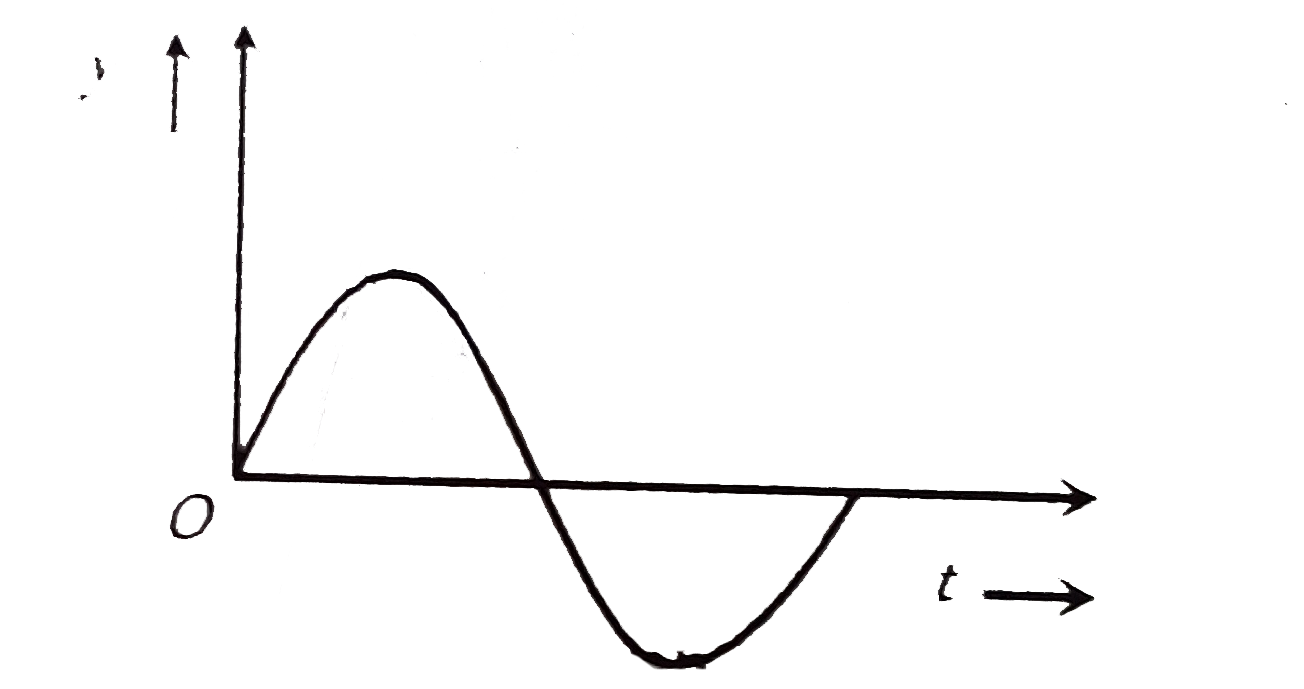 A
A B
B C
C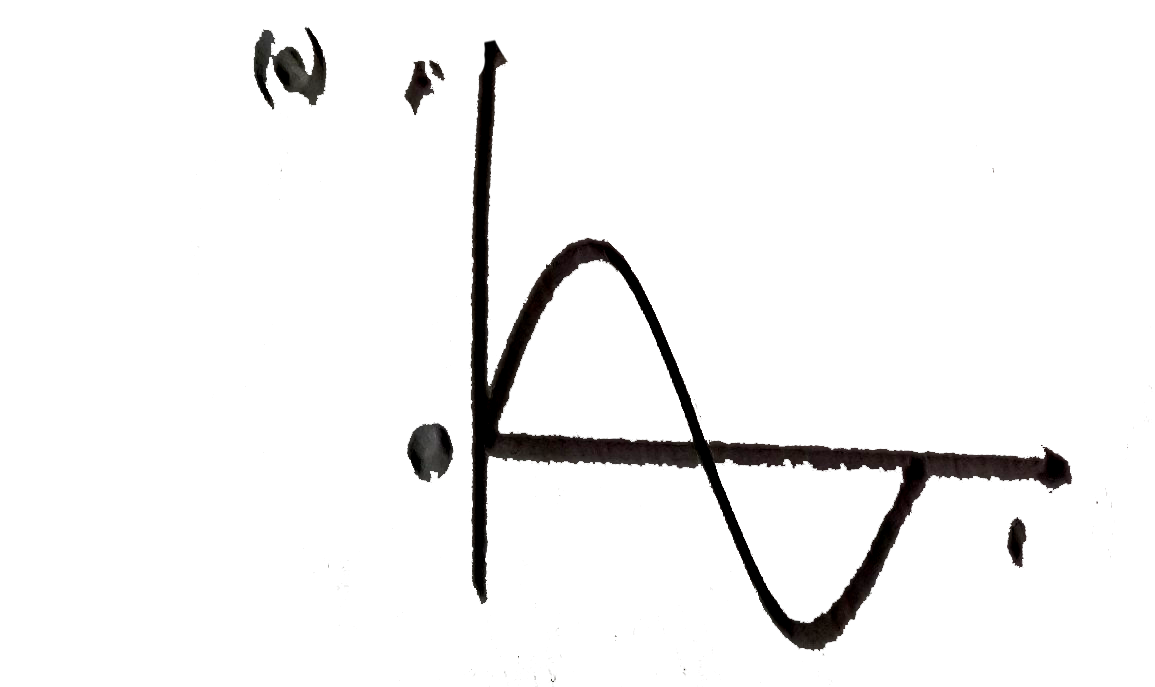 D
D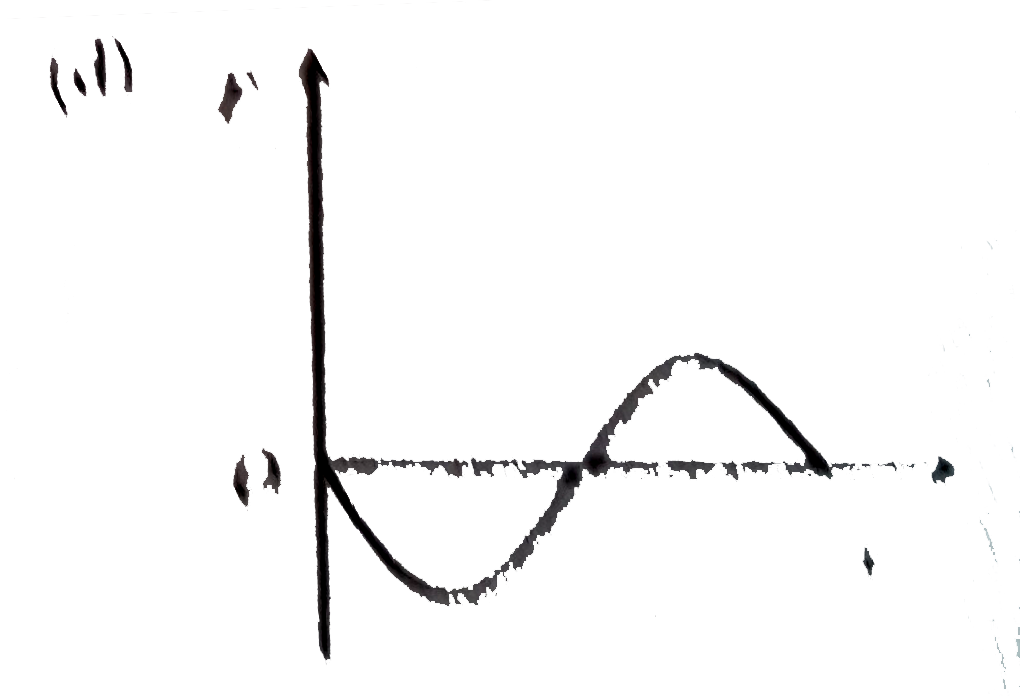
- Question 3 - Select One
The velocity time graph of a linear motion is shown in the figure. The distance from the starting point after 8 seconds will be
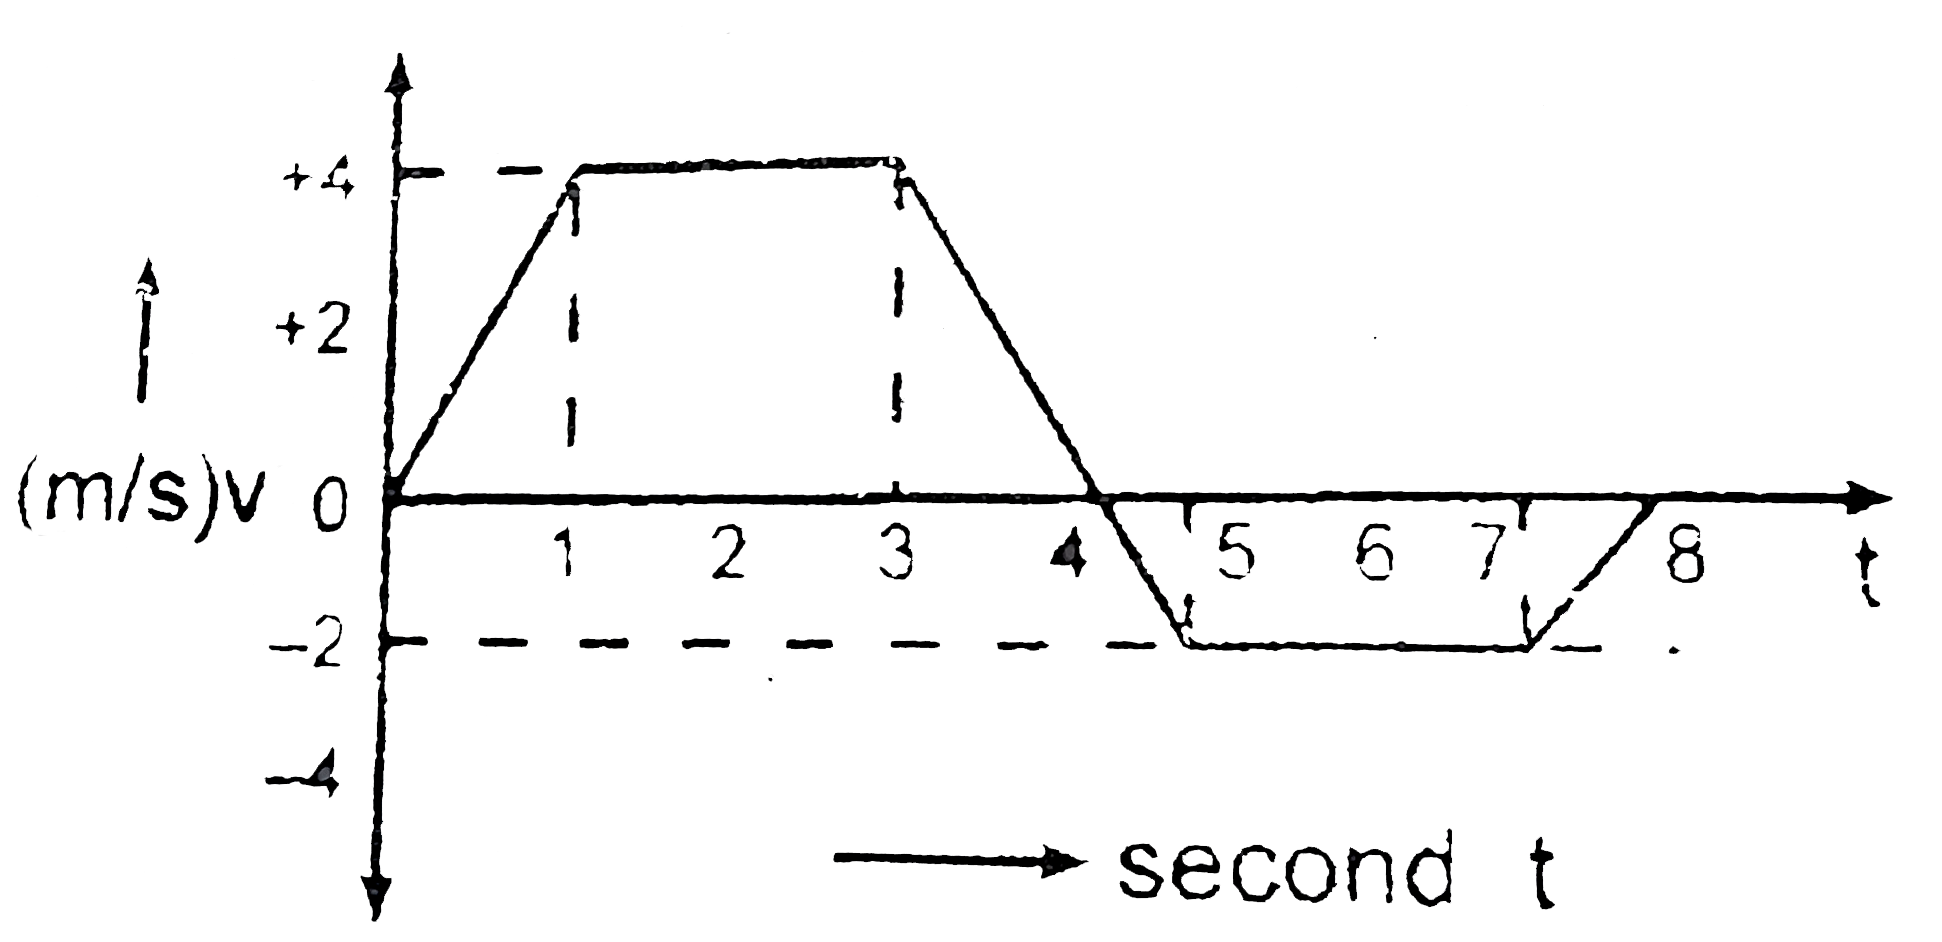 .A18 mB6 mC8 mDnone of these
The force F acting on a particle of mass mis indicated by the force-time graph shown below. The change in momentum of the particle over the time interval from zero to 8 s is
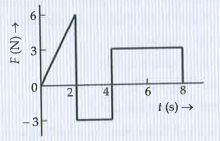 View Solution
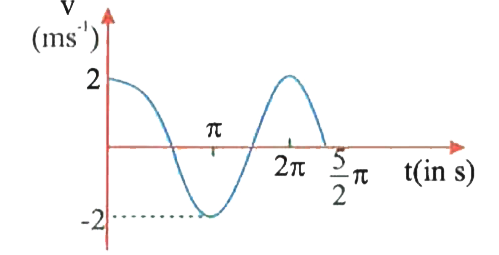
The velocity-time graph of a particle executing SHM is as shown in the figure. The amplitude and maximum acceleration of the particle respectively are
 View Solution
The force F acting on a particle of mass mis indicated by the force-time graph shown below. The change in momentum of the particle over the time interval from zero to 8 s is
 View Solution
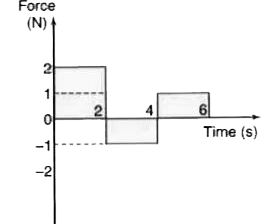
A force-time graph for a linear motion is shown in figure. The linear momentum gained between 0 and 6 second is
 View Solution
The acceleration displacement graph of a particle executing simple harmonic motion is shown in figure. The time period of simple harmonic motion is
View Solution

