The given curve represents the variation of temperatue as a function of volume for one mole of an ideal gas. Which of the following curves best represents the variation of pressure as a function of volume ?
(##DCP_V03_C20_E01_099_Q01##).
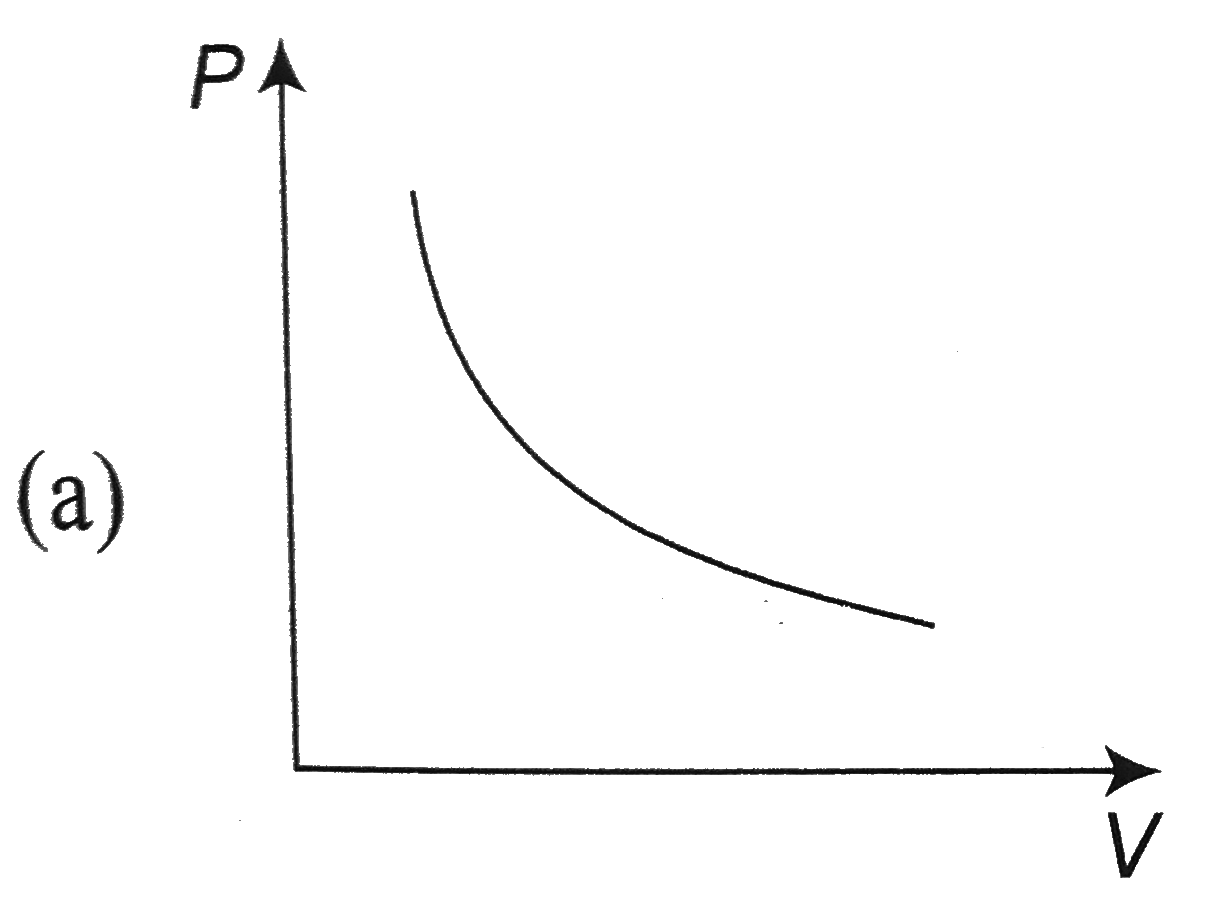
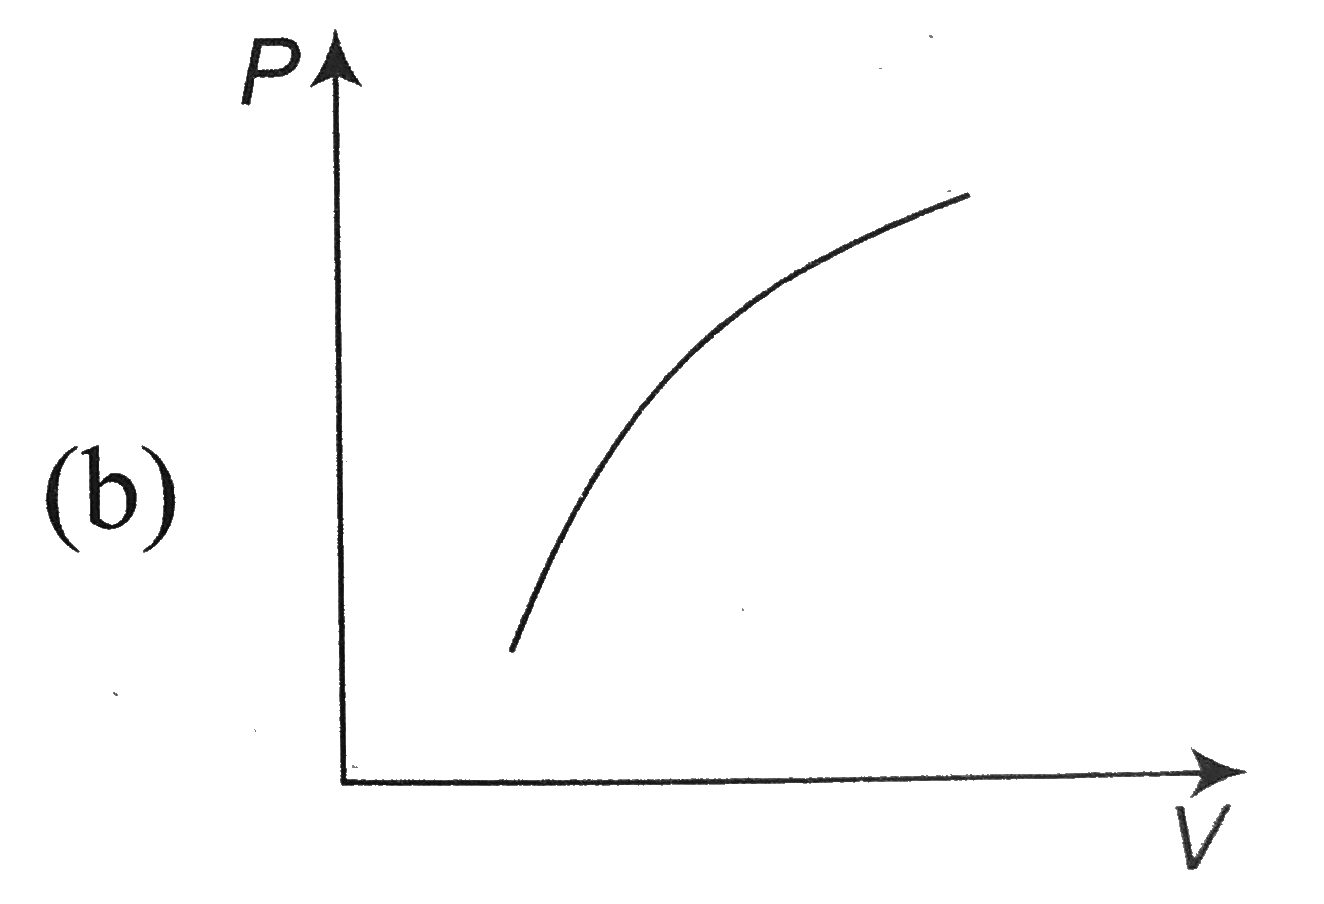
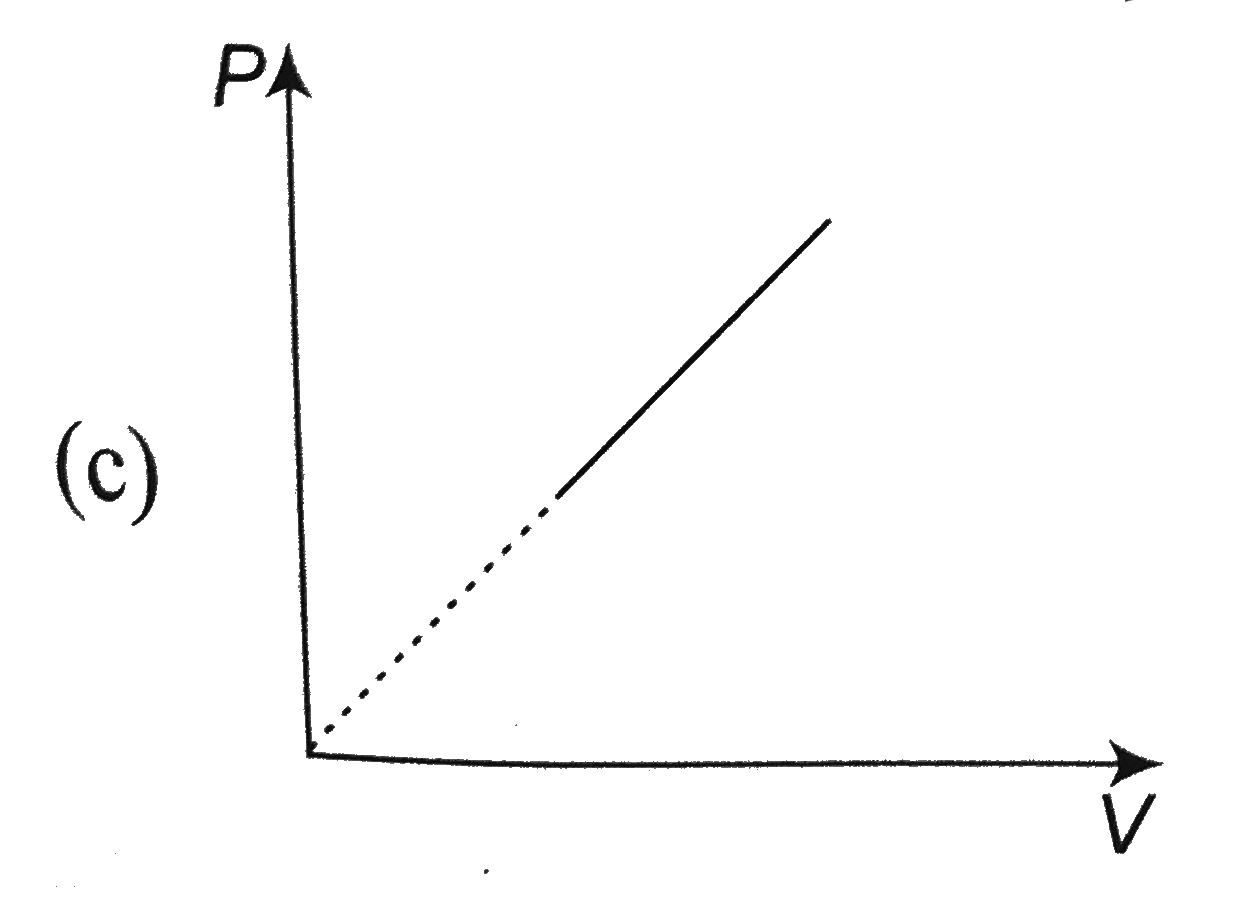
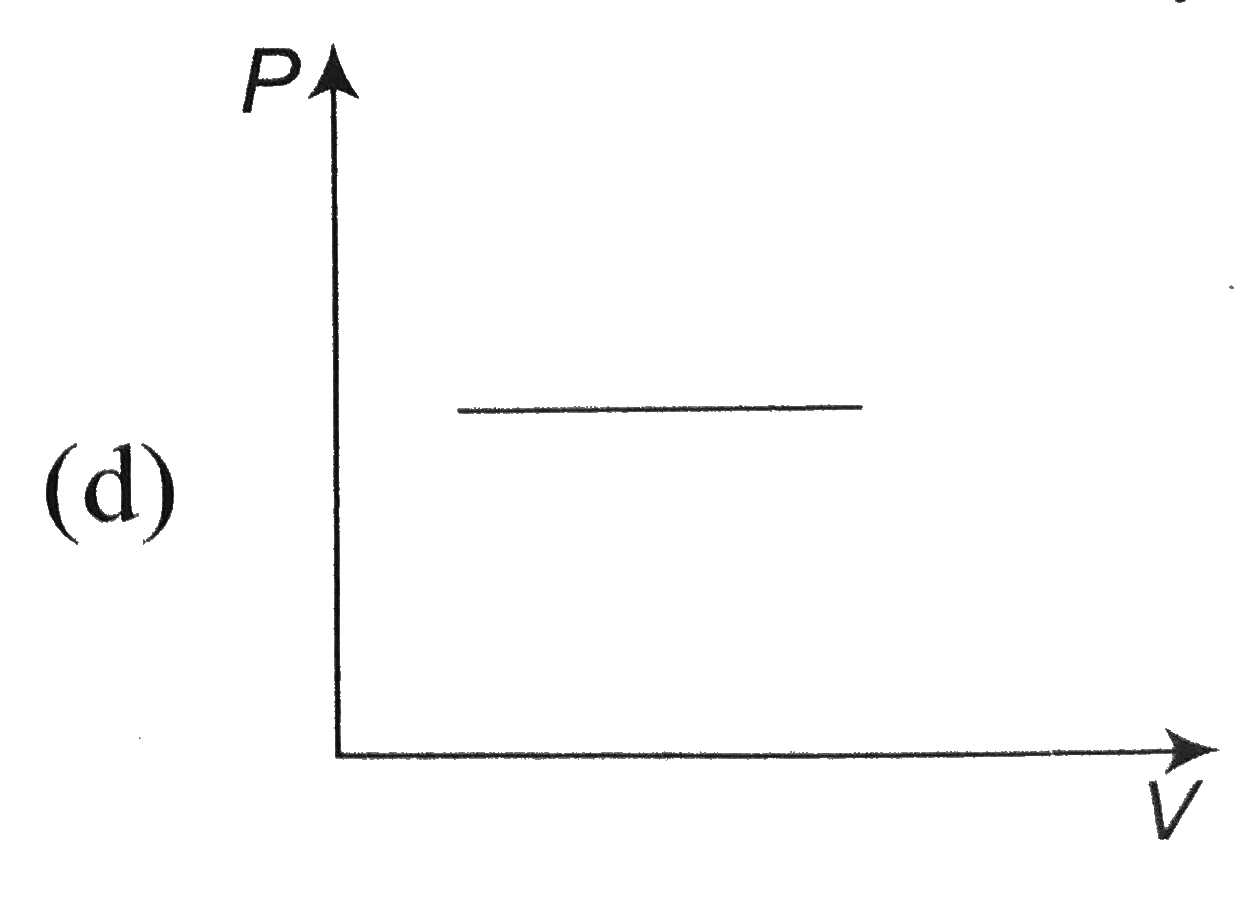
The correct Answer is:A
Here T=Vtan45∘+T0⇒T=V+T0
And P=nRTV
∴PVR=V+T0 (since , n=1)
(P−R)V=RT0.
Topper's Solved these Questions
- KINETIC THEORY OF GASES AND THERMODYNAMICSBOOK - A2ZCHAPTER - KINETIC THEORY OF GASES AND THERMODYNAMICSEXERCISE - First Law Of Thermodynamics , Internal Energy And Work Done
55 Videos
- KINETIC THEORY OF GASES AND THERMODYNAMICSBOOK - A2ZCHAPTER - KINETIC THEORY OF GASES AND THERMODYNAMICSEXERCISE - Application Of First Law Of Thermodynamics In Different Situations
25 Videos
- KINETIC THEORY OF GASES AND THERMODYNAMICSBOOK - A2ZCHAPTER - KINETIC THEORY OF GASES AND THERMODYNAMICSEXERCISE - Chapter Test
29 Videos
- GRAVITATIONBOOK - A2ZCHAPTER - GRAVITATIONEXERCISE - Chapter Test
29 Videos
- MOCK TESTBOOK - A2ZCHAPTER - MOCK TESTEXERCISE - Motion With Constant Acceleration
15 Videos
Similar Questions
Knowledge Check
Which of the following curve represents the variation of λm with √C for AgNO3?
A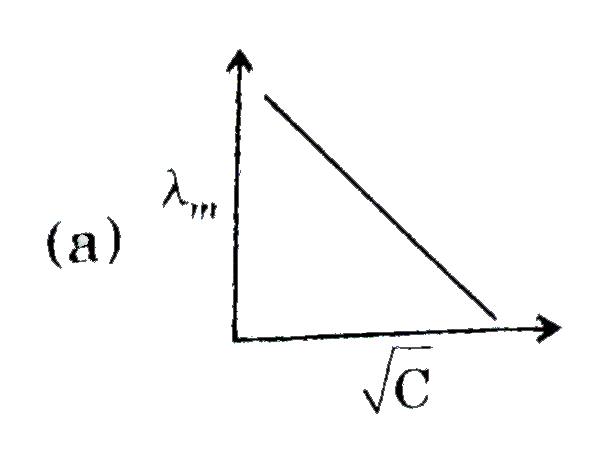 B
B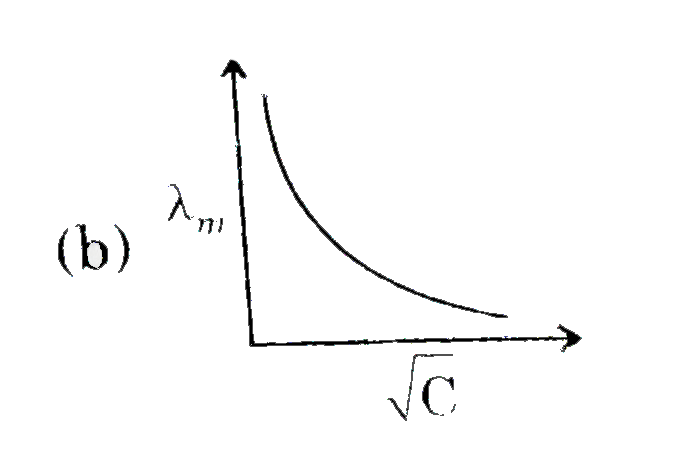 C
C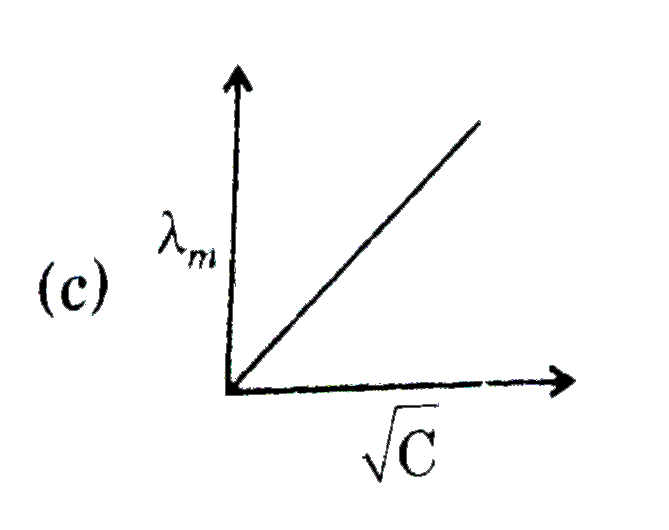 D
D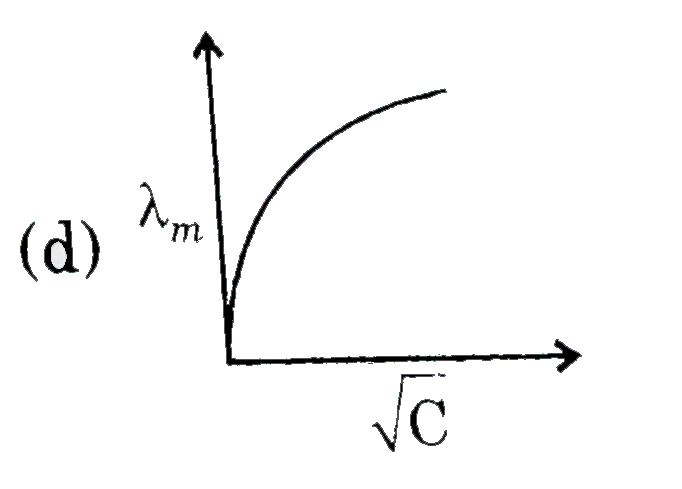
Which of the following curve represent variation of density of water with temperature best-
A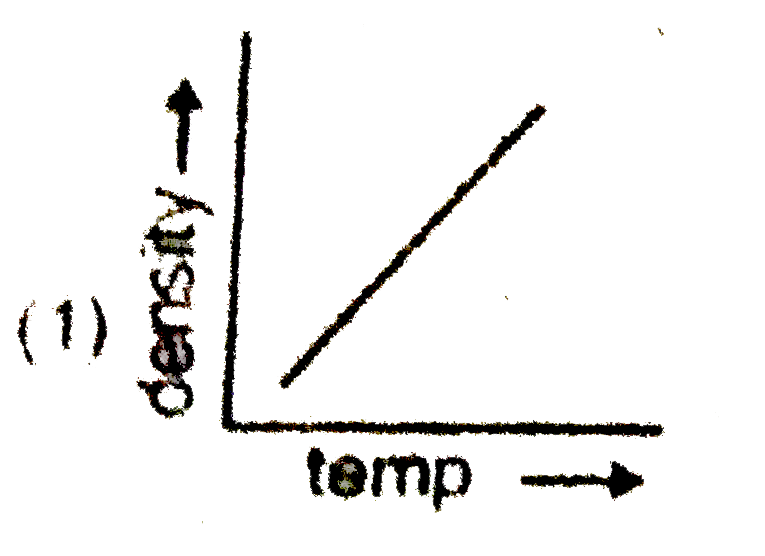 B
B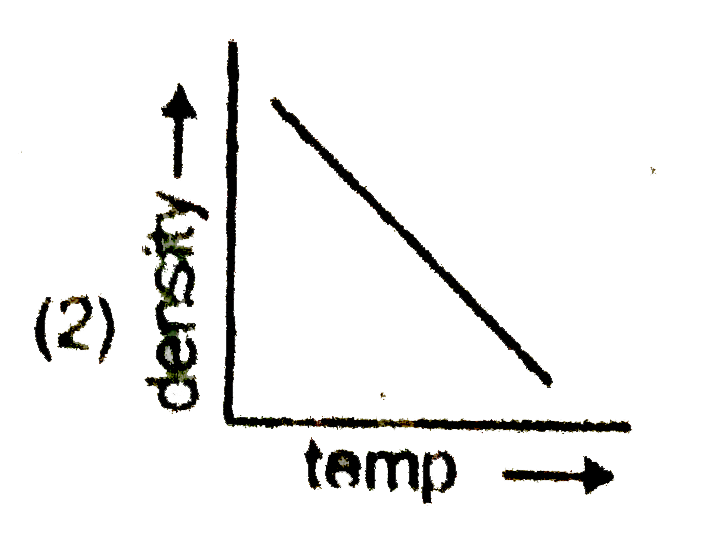 C
C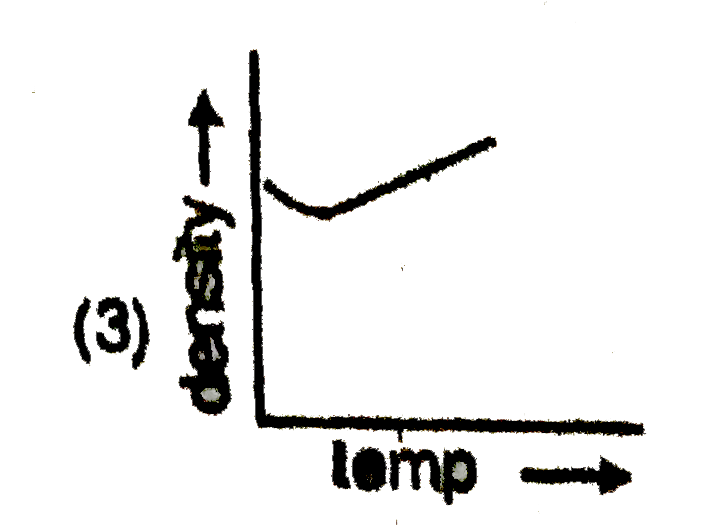 D
D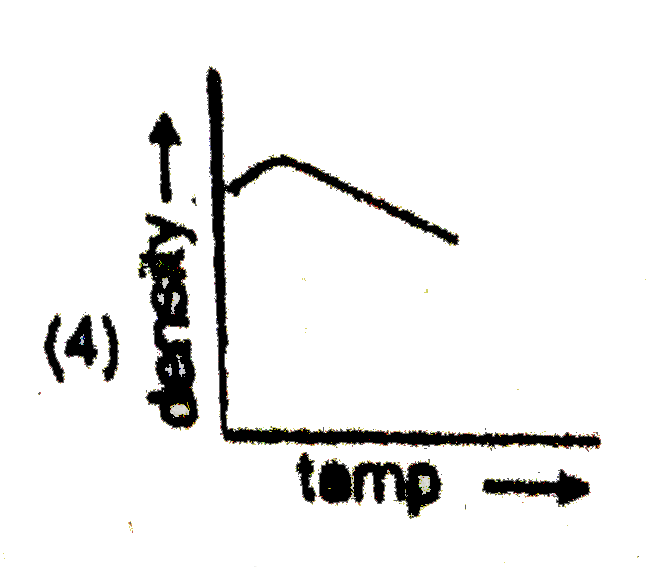
Which of the following curve represents the variation of λM with √C for AgNO3?
A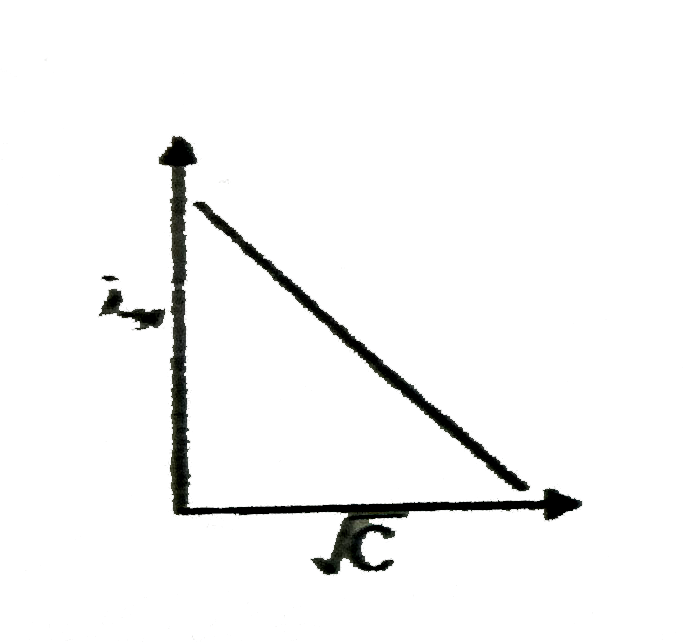 B
B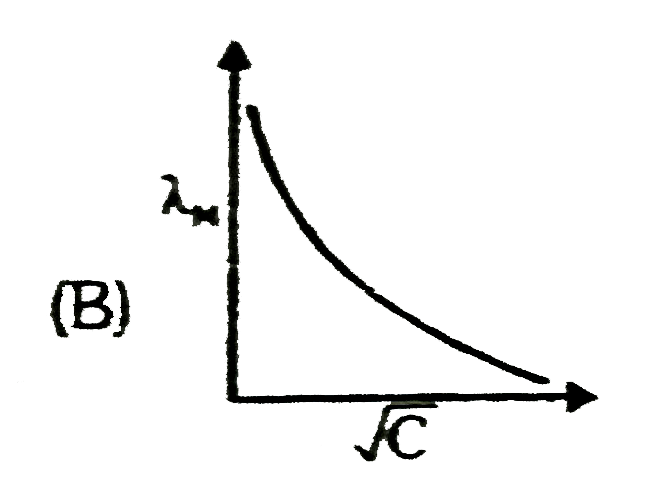 C
C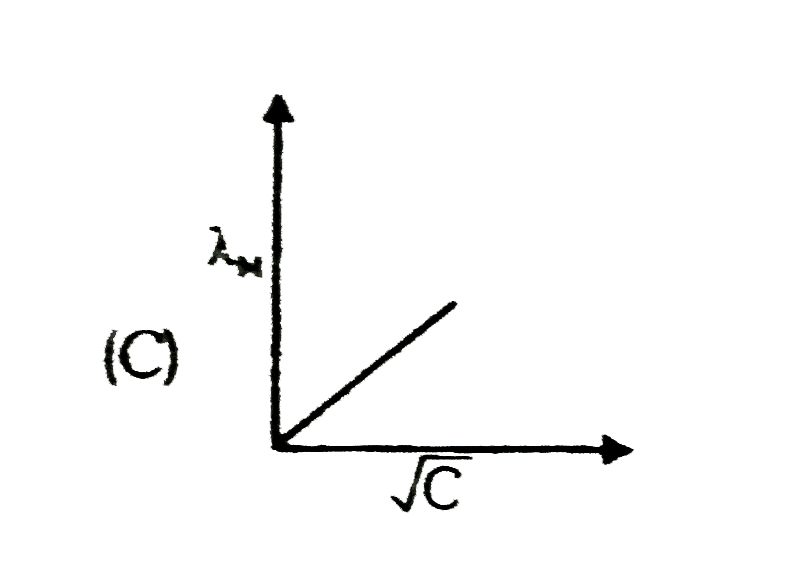 D
D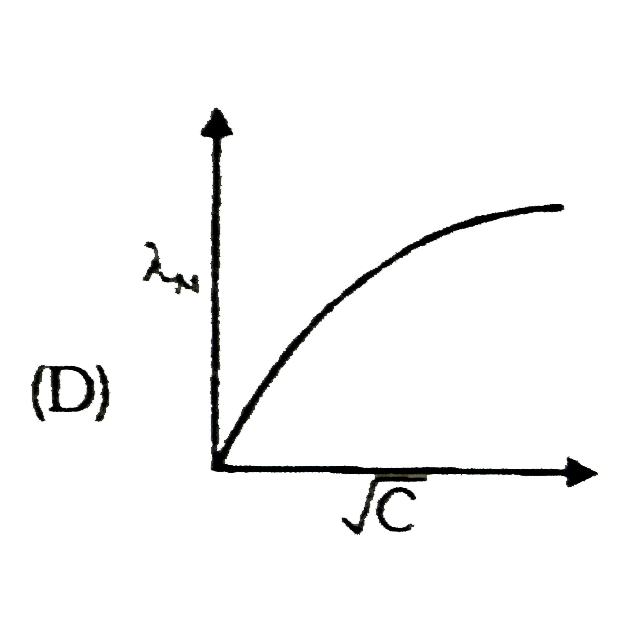
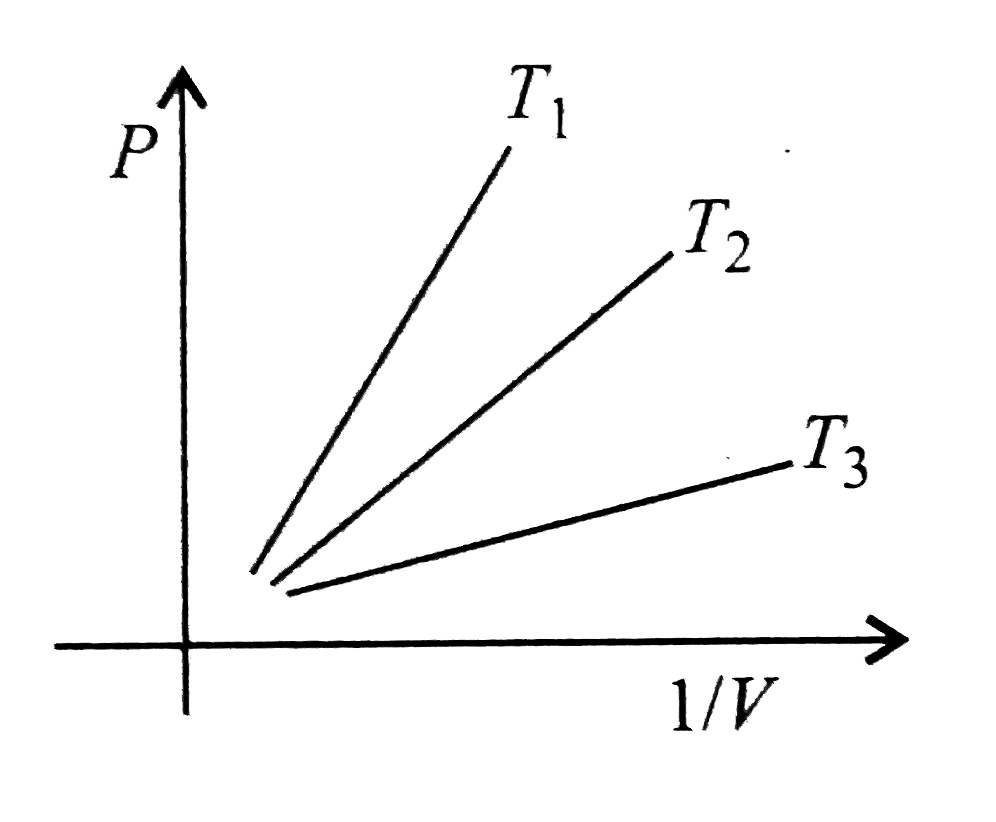
The curve drawn below shows the variations of P as a function of 1/V for a fixed mass and temperature of an ideal gas. It follows from the curve that:
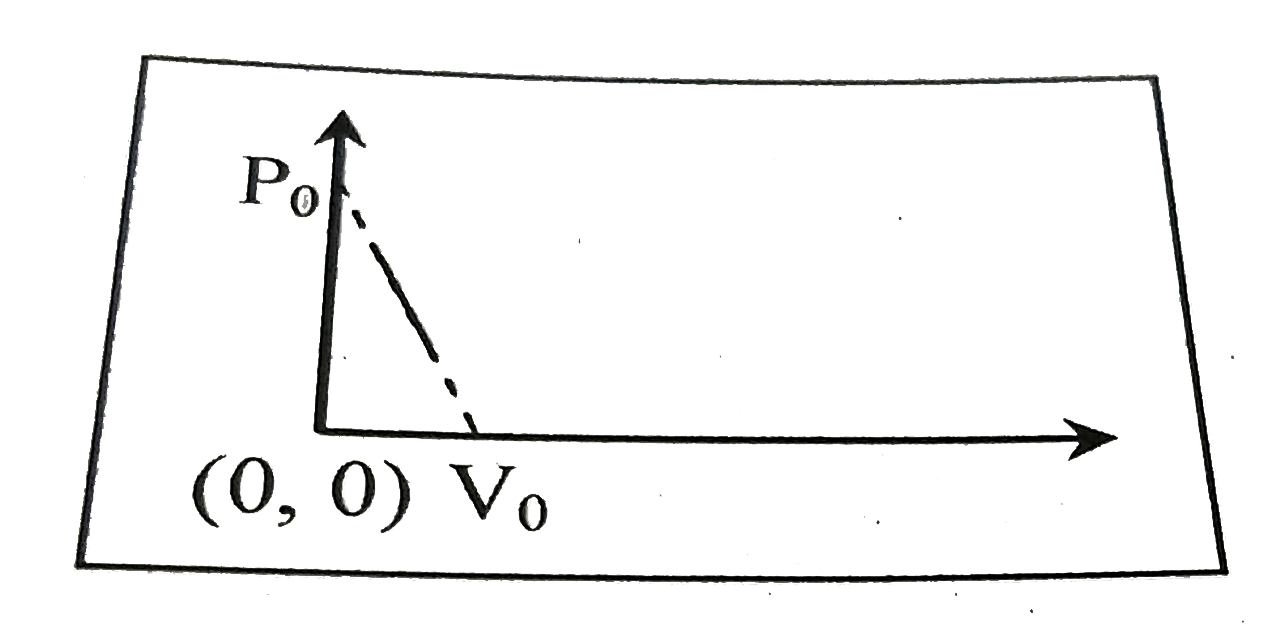
View SolutionOne mole of ideal gas undergoes a linear process as shown in figure below. Its temperature expressed as function of volume V is -
View SolutionA point source of light is used in an experiment on photoelectric effect . Which of the following curves best represents the variation of photo current (i) with distance (d) of the source from the emitter?

View SolutionAn ideal cell is connected to a capacitor through a voltmeter. The reading V of the voltmeter is plotted agains time. Which of the following best represents the resulting curve?
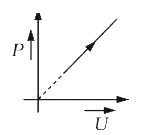
View SolutionThe given P-U graph shows the variation of internal energy of an ideal gas with increase in pressure. Which of the following pressure-volume graph is equivalent to this graph?
View Solution

