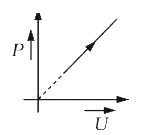
The given P-U graph shows the variation of internal energy of an ideal gas with increase in pressure. Which of the following pressure-volume graph is equivalent to this graph?
A
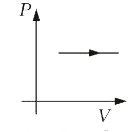
B
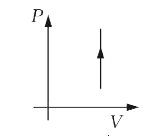
C
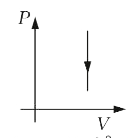
D
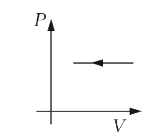
Video Solution
Text Solution
The correct Answer is:B
P∝⇒P∝T⇒ process is isochoric (pressure increasing)
|
Updated on:21/07/2023
Similar Questions
Knowledge Check
- Question 1 - Select One or More
The energy density uV of an ideal gas is related to its pressure P as
AuV=3PBuV=32PCuV=13PDuV=23P - Question 2 - Select One or More
The pressure p and volume V of an ideal gas both increase in a process.
Asuch a process is not possible.BThe work done by the system is positive.CThe tempreture of the system must increase.DHeat supplied to the gas is equal to the change in internal energy. - Question 3 - Select One
Which of the following graphs is consistent with ideal gas behaviour?
A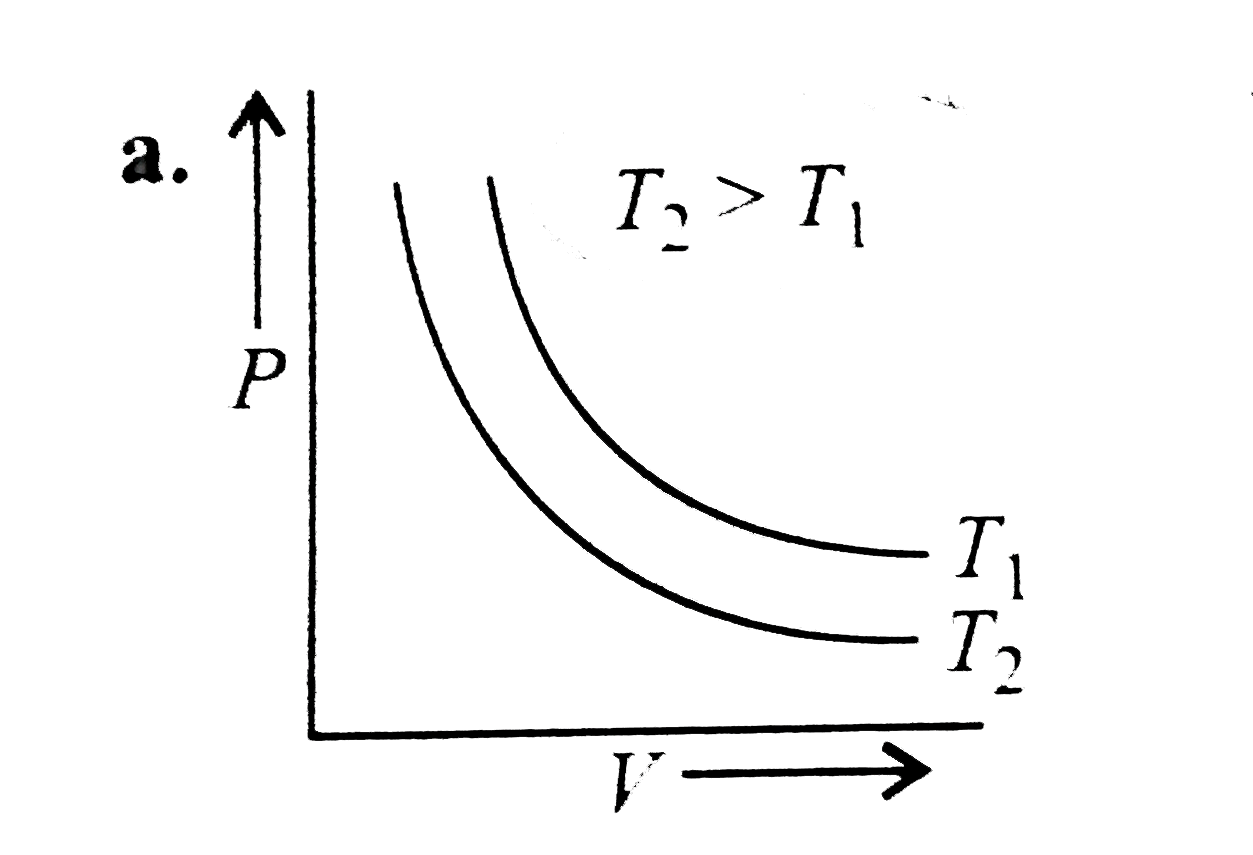 B
B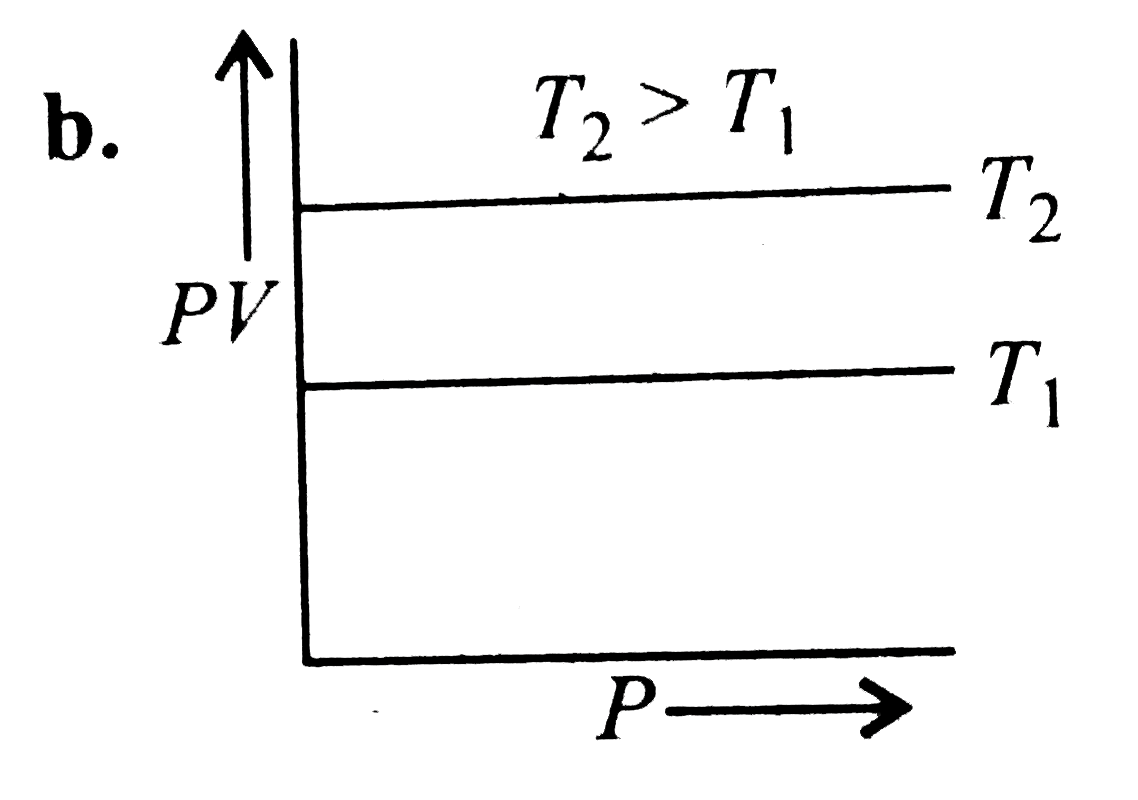 C
C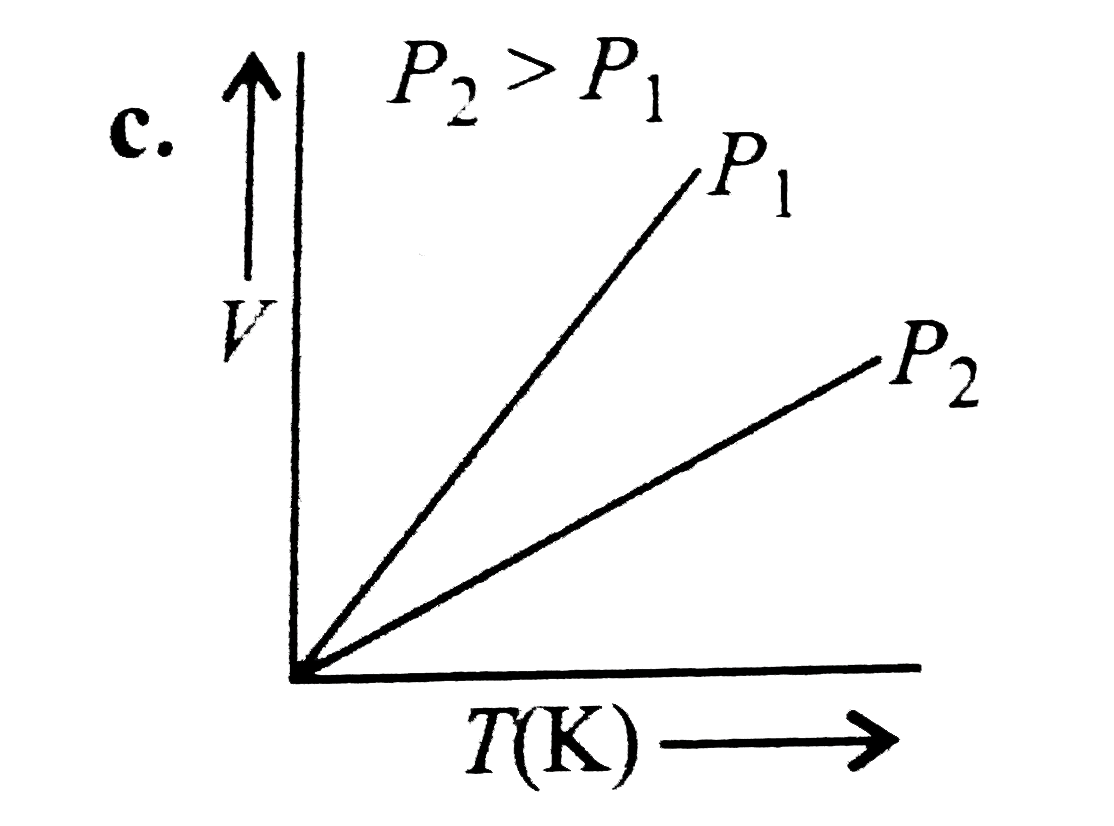 D
D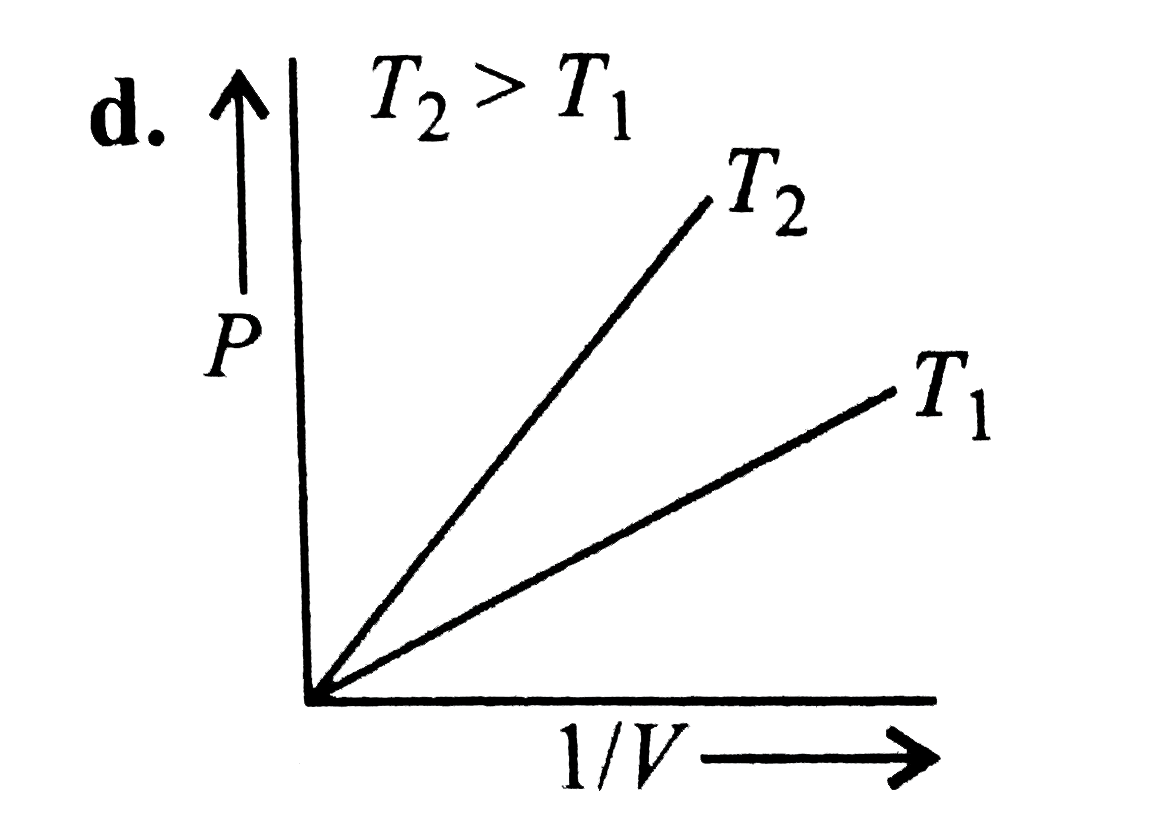
Plot a graph between internal energy U and Temperature (T) of an ideal gas.
View SolutionWhich of the following graphs is not a straight line for an ideal gas ?
View SolutionWhich of the following graphs represent the behaviour of an ideal gas ?
View SolutionThe given curve represents the variation of temperatue as a function of volume for one mole of an ideal gas. Which of the following curves best represents the variation of pressure as a function of volume ?
(##DCP_V03_C20_E01_099_Q01##).View SolutionThe P−T graph for the given mass of an ideal gas is shown in figure. Then the volume
_E01_022_Q01.png) View Solution
View Solution


