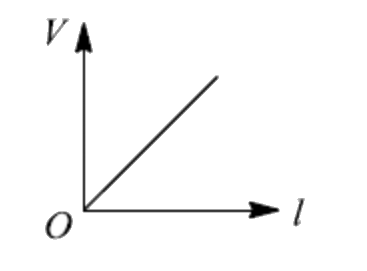
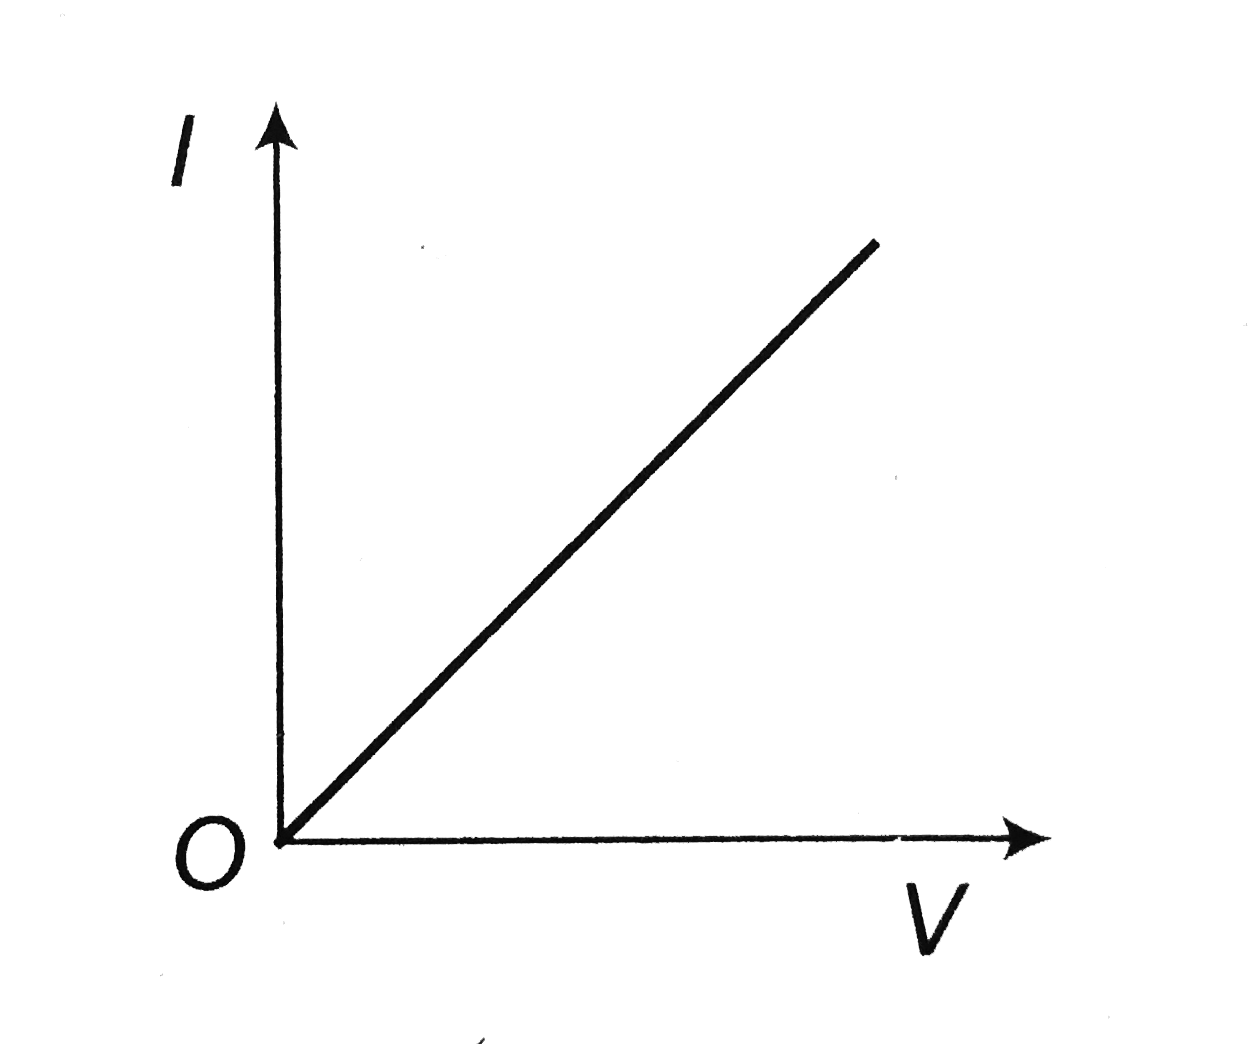
The given figure shows the I-V curve (i) for a conductor of given length and cross-section.

Which of the following changes will yield the curve (ii)?
Increase the length of conductor
Decrease the thickness of conductor
Decrease the length of conductor
Both A and B
The correct Answer is:C
Step by step video & image solution for The given figure shows the I-V curve (i) for a conductor of given length and cross-section. Which of the following changes will yield the curve (ii)? by Physics experts to help you in doubts & scoring excellent marks in Class 10 exams.
Updated on:21/07/2023Topper's Solved these Questions
Similar Questions
Knowledge Check
The given figure shows the cross-section of a plant.
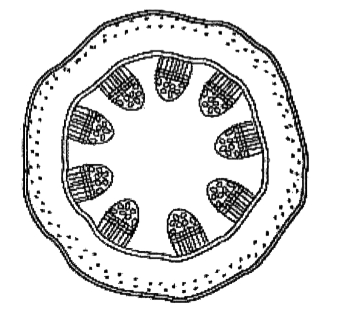
The given cross-section belongs to aAmonocot stemBmonocot rootCdicot stemDdicot rootWhich of the following option is correct for given curve?
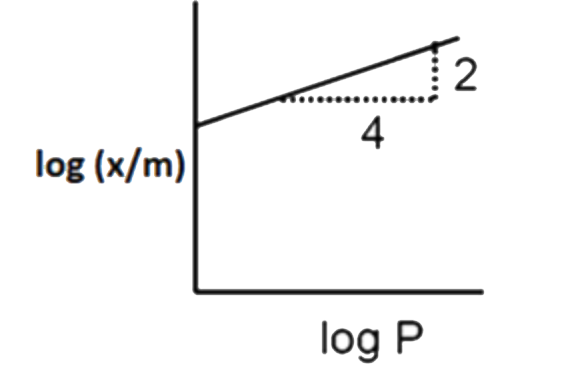 Axm∝(P)Bxm∝(P)2Cxm∝(P)1/2Dxm∝(P)0
The given figure shows the velocity versus time curve for a car traveling along a straight line. Which of the following statements is false ?
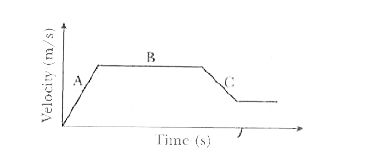 ANet forces act on the car during intervals A and C.BOpposing forces may be acting on the car during interval B.COpposing forces may be acting on the car during interval C.DThe magnitude of the net force acting duriing interval A is less then that during C.
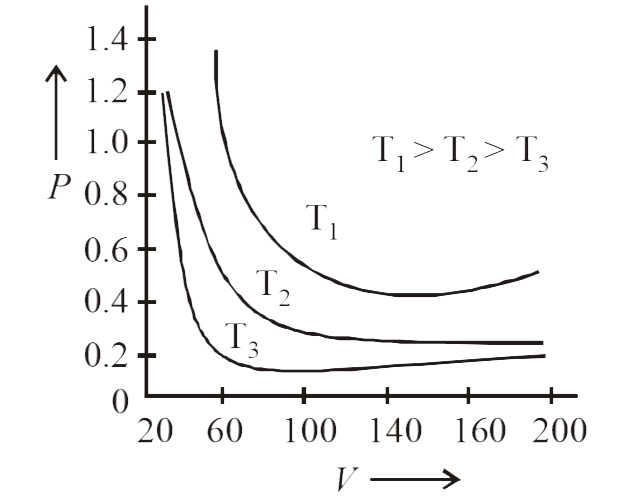
The given P-V curve is predicted by
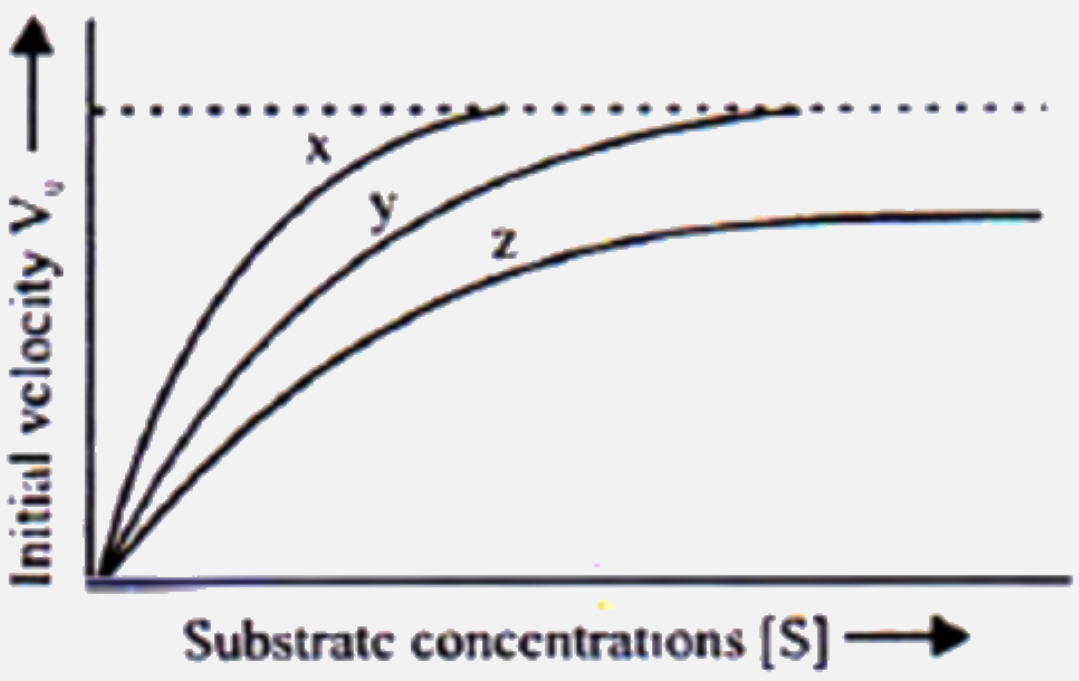
View SolutionThe Given figure shows three velocity-substrate concentration curves of an enzyme reaction. What do the curves X Y and Z depict respectively ?
View SolutionI−V characteristics of a copper wire of length L and area fo cross-section A is shown in Fig. The slope of the curve becomes
View SolutionA stready current i is flowing through a conductor of uniform cross-section. Any segment of the conductor has
View Solutionl-V characteristic of a copper wire of length Land area of cross-section A is shown in figure. The slope of the curve becomes

View Solution

