The graph between and stopping potential (V) of three metals having work- functions , and in an experiment of photoelectric effect is plotted as shown in the figure. Which of the following statement(s) is/are correct? (Here, is the wavelength of the incident ray).
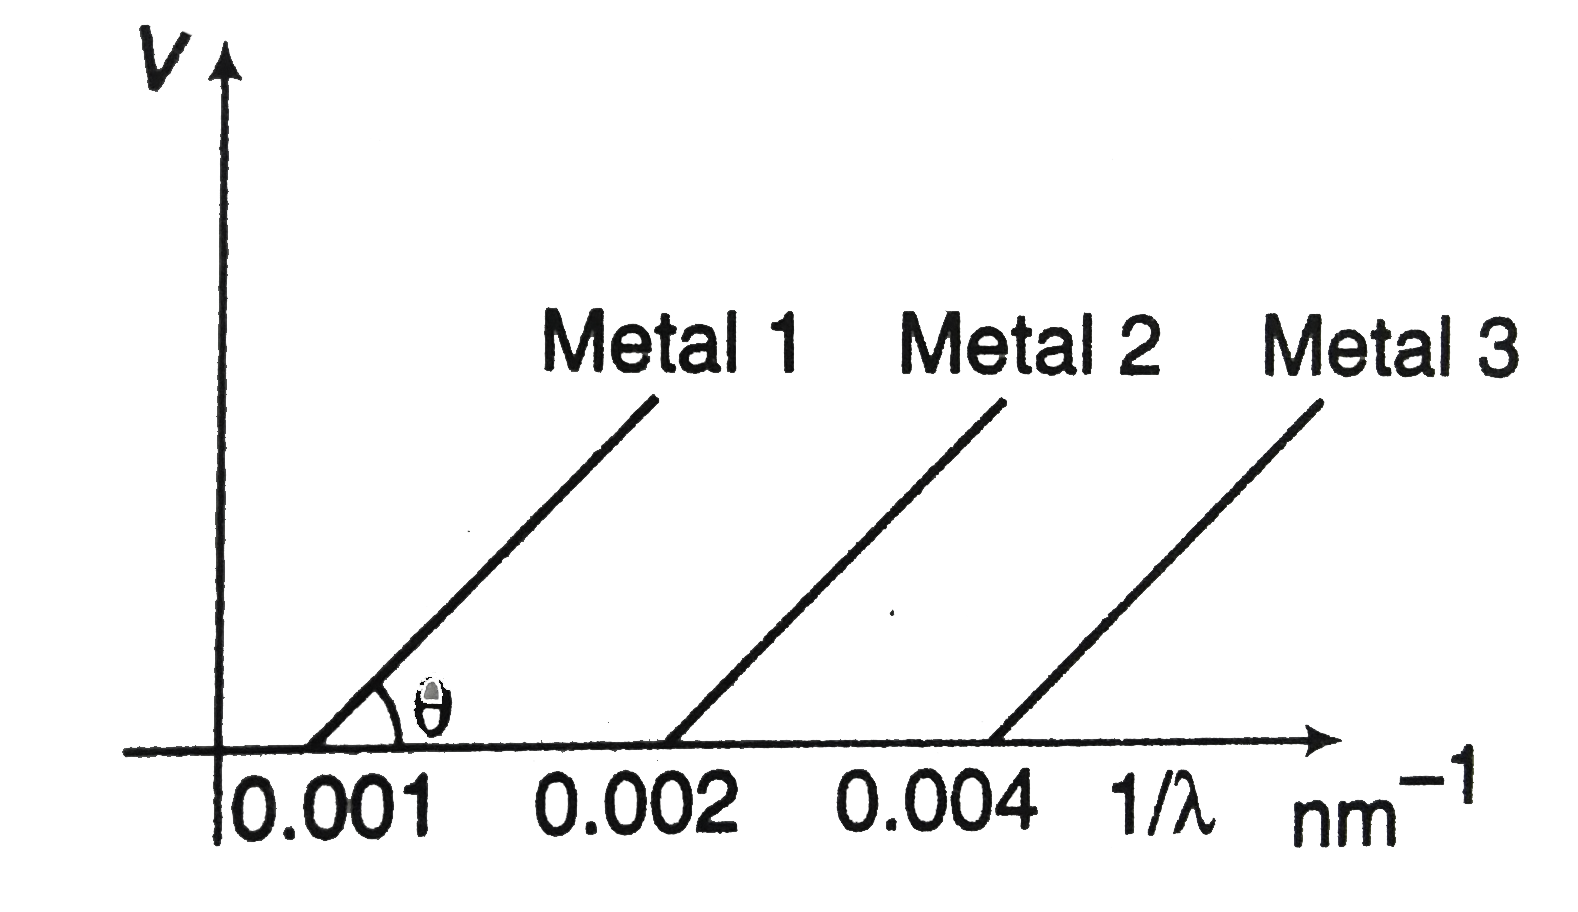
Ultraviolet light can be used to emit photoelectrons from metal 2 and metal 3 only
The correct Answer is:A, C
therefore, option (a) is correct.
By Einstein's photoelectric equation,
..(i)
Comparing Eq. (i) by , we get the slope of the line
Option (c ) is correct.
From the graph it is clear that,
Also,
and
Violet color light will have wavelength less that 400 nm. Therefore, this light will be unable to show photoelectric effect on plate 3 Option (d) is wrong.
Topper's Solved these Questions
- PHOTOELECTRIC EFFECTBOOK - CENGAGE PHYSICS ENGLISHCHAPTER - PHOTOELECTRIC EFFECTEXERCISE - Linked Comprehension Type
3 Videos
- PHOTOELECTRIC EFFECTBOOK - CENGAGE PHYSICS ENGLISHCHAPTER - PHOTOELECTRIC EFFECTEXERCISE - Integer Type
4 Videos
- PHOTOELECTRIC EFFECTBOOK - CENGAGE PHYSICS ENGLISHCHAPTER - PHOTOELECTRIC EFFECTEXERCISE - Single Correct Answer Type
7 Videos
- NUCLEAR PHYSICSBOOK - CENGAGE PHYSICS ENGLISHCHAPTER - NUCLEAR PHYSICSEXERCISE - ddp.5.5
14 Videos
- RAY OPTICSBOOK - CENGAGE PHYSICS ENGLISHCHAPTER - RAY OPTICSEXERCISE - DPP 1.6
12 Videos
Similar Questions
The graph between 1λ and stopping potential V0 of two metals having work funcation ϕ1 and ϕ2 in an experiment of photoelectric effect is obtained as shown in the figure. Find out -
_E01_164_Q01.png)
(i) Threshold wavelength ofboth metals
(ii) ϕ1:ϕ2
(iii) Whihc metal cen emit photoelectrons with visible light ?
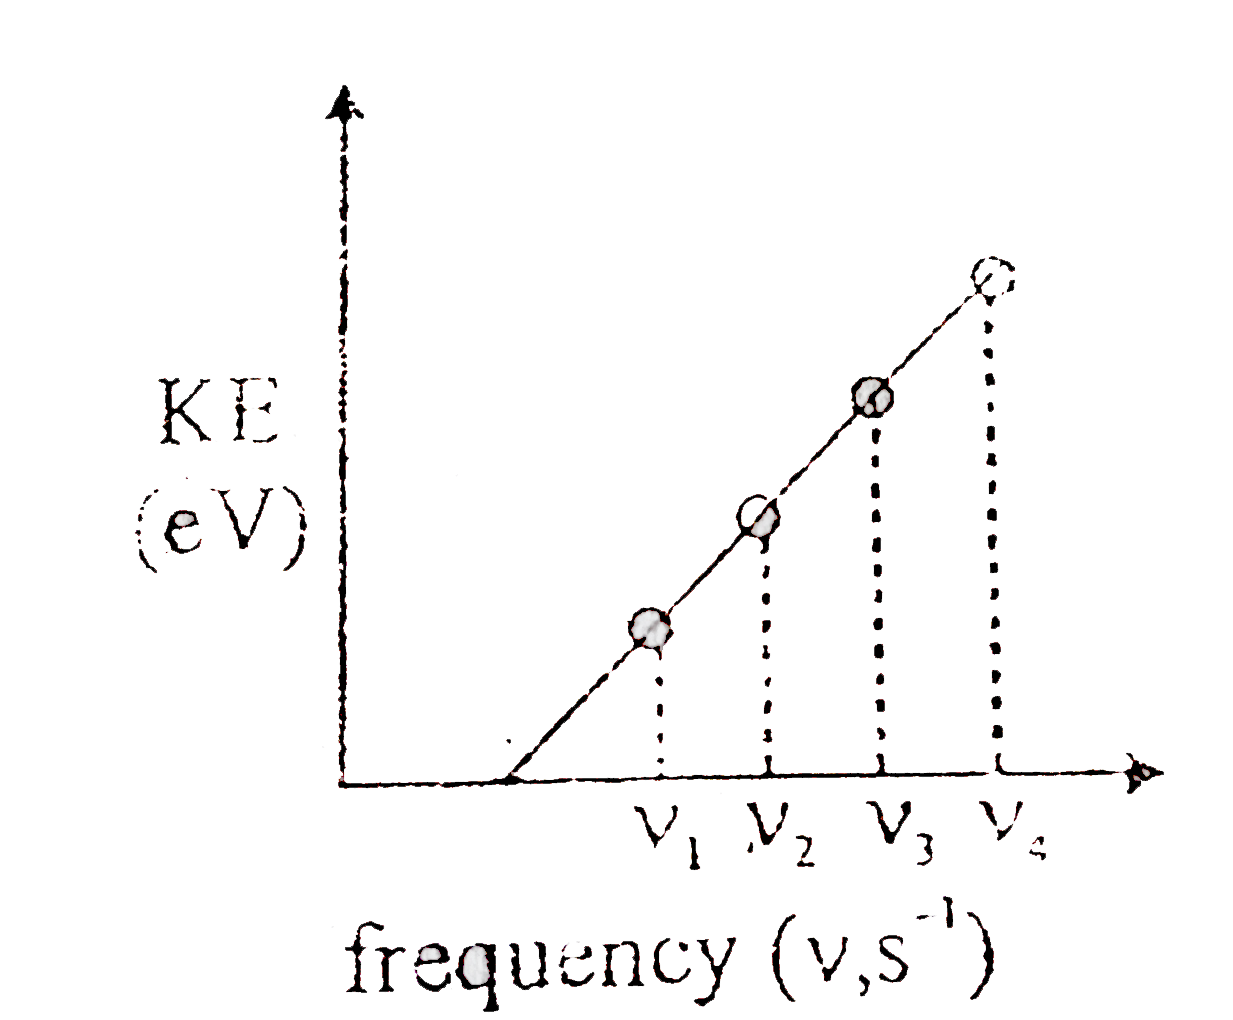
View SolutionIn a photoelectric experiment, kinetic energy of photoelectrons was plotted against the frequency of incident radition (v), as show in figure. Which of the following statements is correct ?
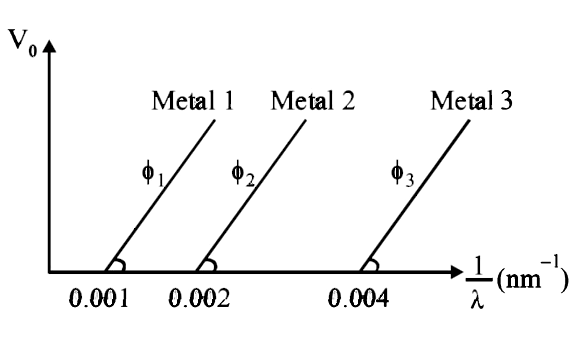
View SolutionThe graph between the stopping potential (V0)and(1λ) is shown in the figure ϕ1,ϕ2andϕ3 are work function , which of the following is /are correct
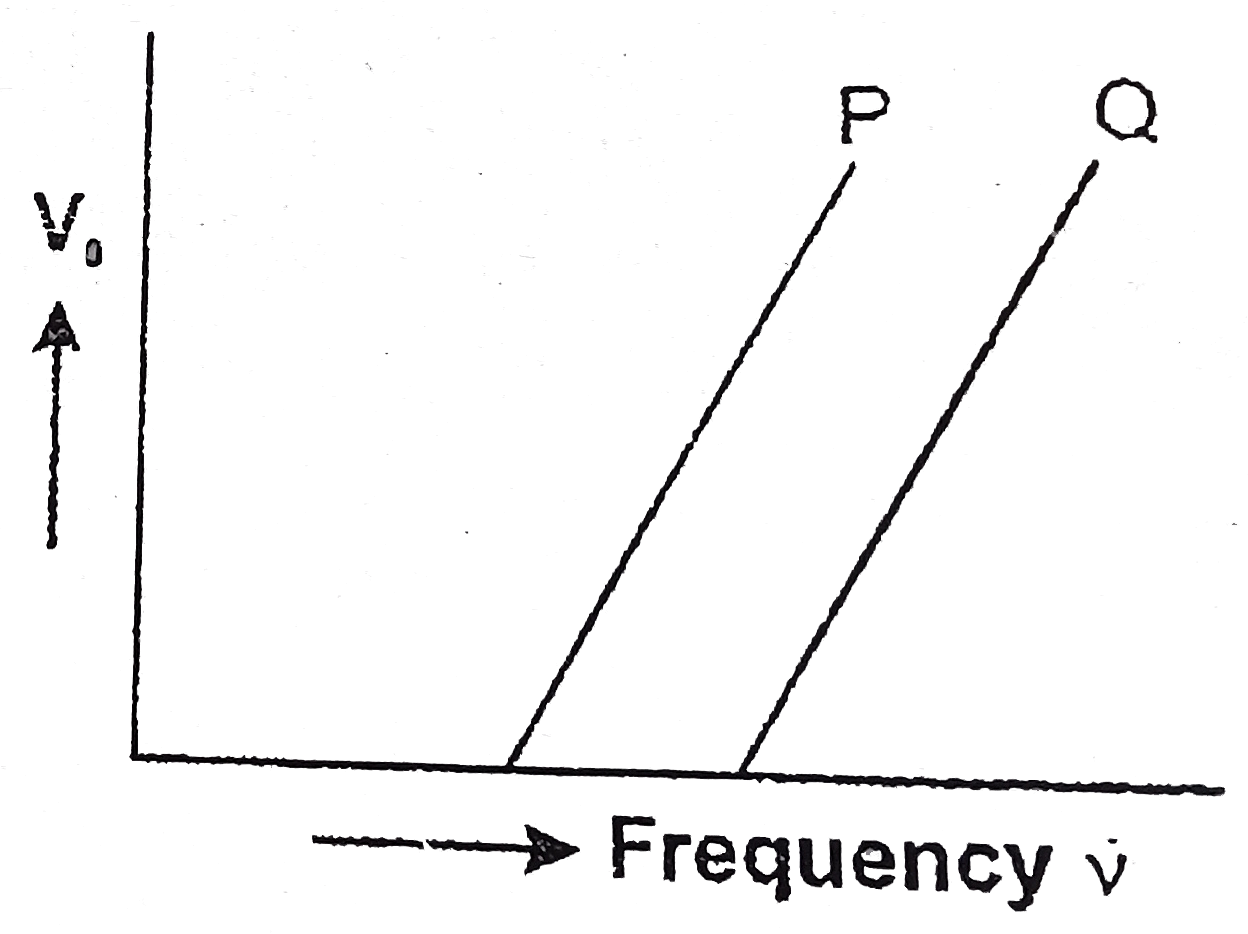
View SolutionThe graph between the stopping potential V0 and frequency v for two different metal plates P and Q are shown in the figure. Which of the metals has greater threshold wavelength and work function.
View SolutionIf graph of a function f(x) which is defined in [-1, 4] is shown in the following figure then identify the correct statement(s).
View SolutionThree metals have work functions in the ratio 2 3:4. Graphs are drawn for all connecting stopping potential and incident frequency. The graphs have slopes in the ratio
View SolutionThe work function (ϕ) of some metals is listed below . The number of metals which will show photoelectric effect when light of 300 nm wavelength falls on the metal is :

View SolutionIf a graph is plotted between 1/v and 1/u , which one of the graph shown in figure is approximately correct ?
View SolutionIn a photoelectric effect experiment, the graph of stopping potential V versus reciprocal of wavelength obtained is shown in the figure. As the intensity of incident radiation is increased :
View SolutionIn an experiment on photoelectric effect the frequency f of the incident light is plotted against the stopping potential V0. The work function of the photoelectric surface is given by ( e is the electronic charge)
View Solution
