If a graph is plotted between 1/v and 1/u , which one of the graph shown in figure is approximately correct ?
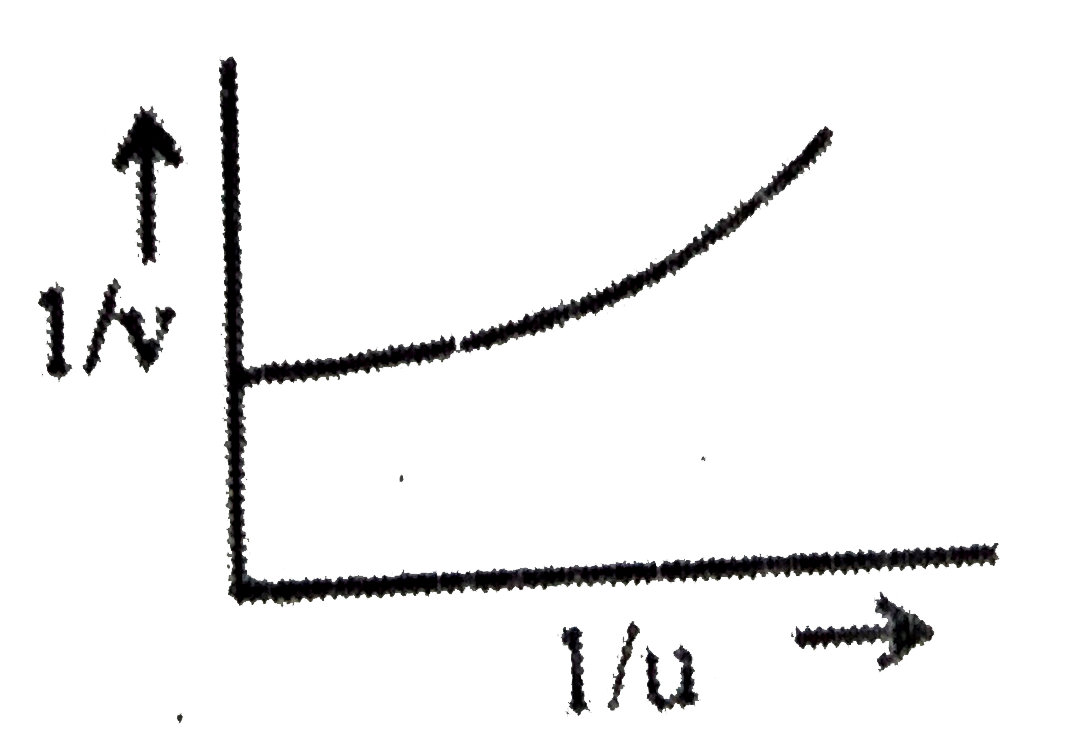
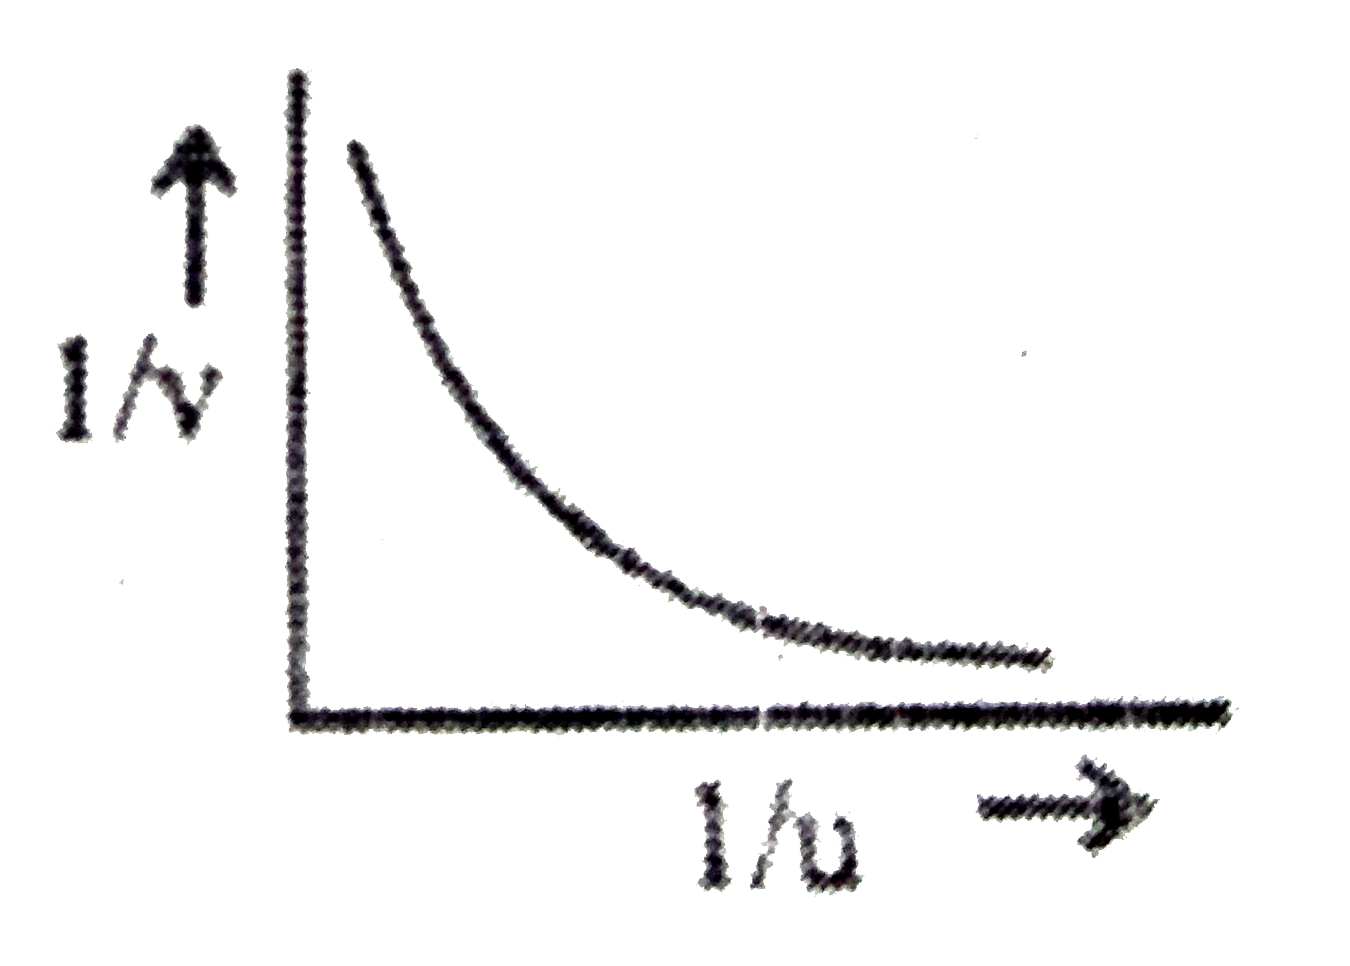
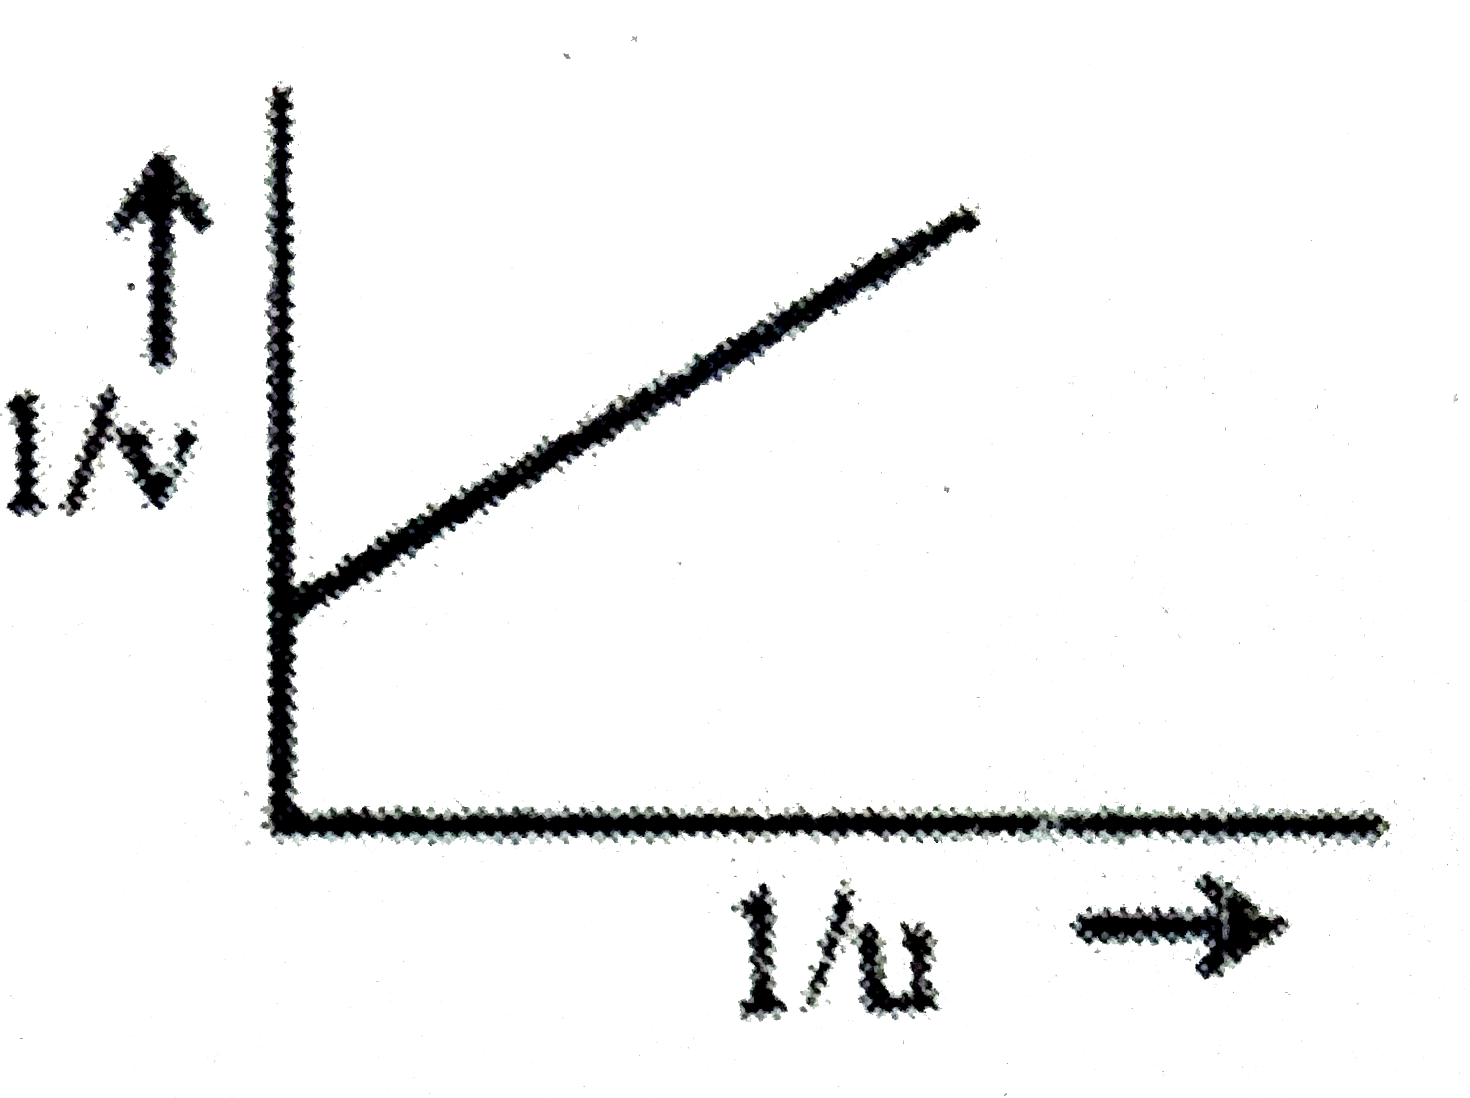
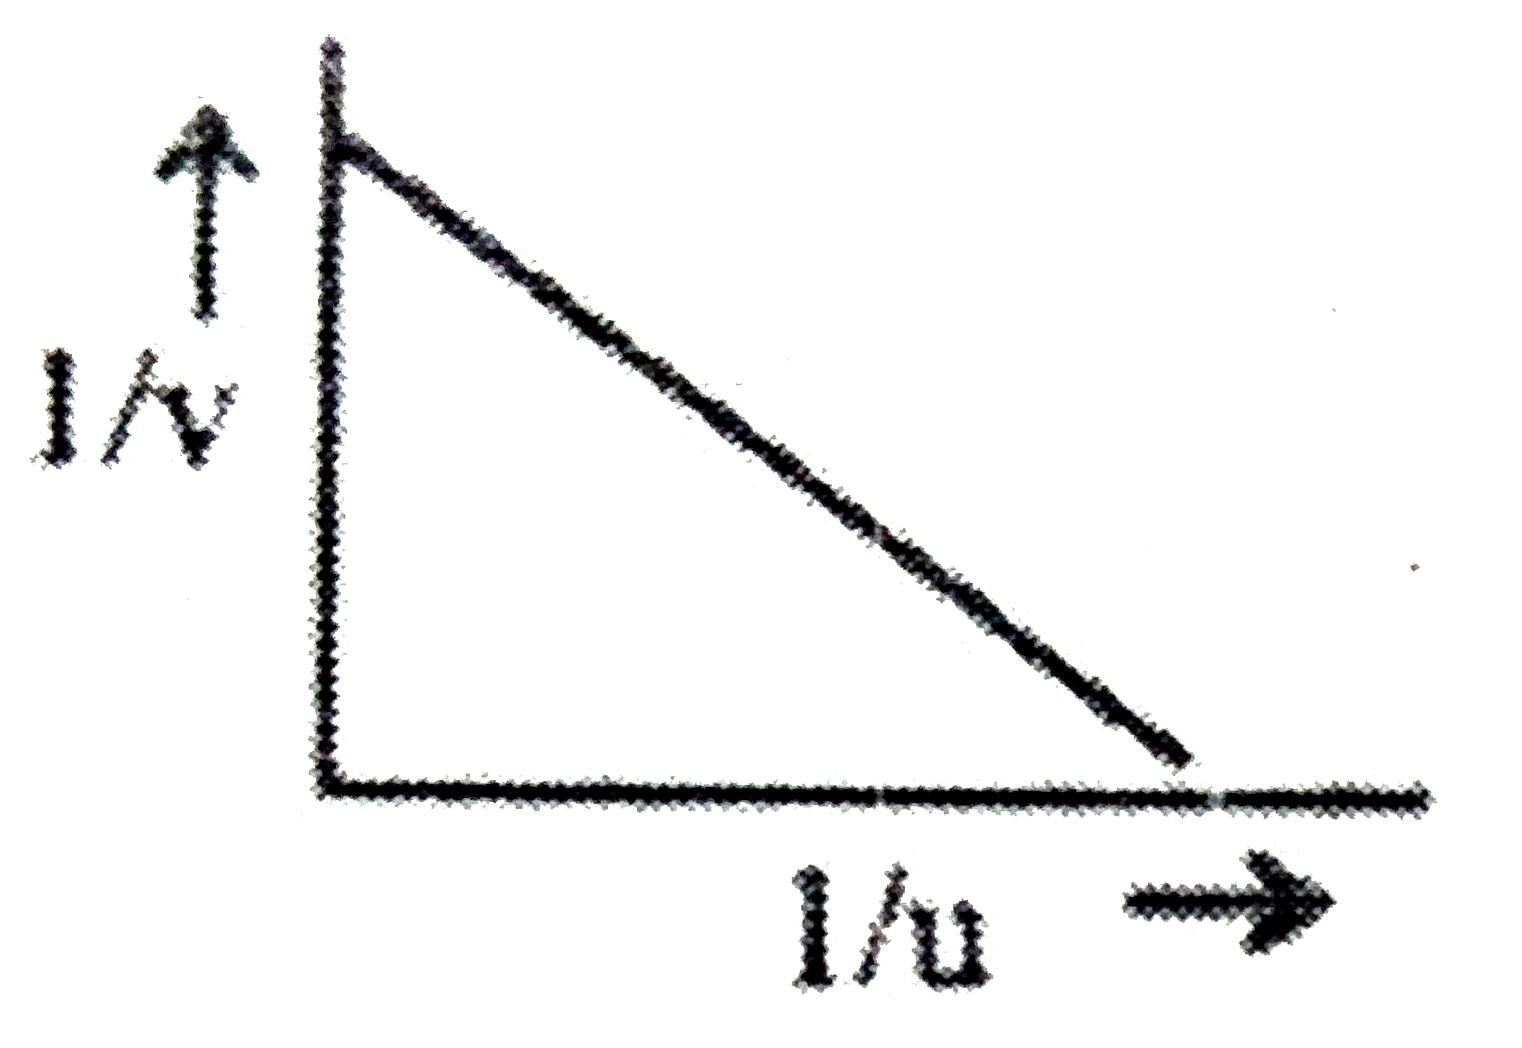
To solve the problem, we need to analyze the relationship between 1v and 1u using the lens and mirror formulas.
1. Understand the Lens Formula:
The lens formula is given by:
1v−1u=1f
Here, v is the image distance, u is the object distance, and f is the focal length of the lens.
2. Rearranging the Lens Formula:
Rearranging the lens formula gives:
1v=1u+1f
If we let y=1v and x=1u, we can rewrite this as:
y=x+1f
This represents a straight line with a slope of 1 and a y-intercept of 1f.
3. Understand the Mirror Formula:
The mirror formula is given by:
1v+1u=1f
Rearranging this gives:
1v=−1u+1f
Again, letting y=1v and x=1u, we can write:
y=−x+1f
This represents a straight line with a slope of -1 and a y-intercept of 1f.
4. Analyzing the Graphs:
- For the lens, the graph will be a straight line with a positive slope (1).
- For the mirror, the graph will be a straight line with a negative slope (-1).
5. Conclusion:
Based on the analysis, both types of graphs (one with a positive slope and one with a negative slope) can be correct depending on whether we are dealing with a lens or a mirror. Therefore, the correct options are the graphs that represent these relationships.
The lens formula is given by:
1v−1u=1f
Here, v is the image distance, u is the object distance, and f is the focal length of the lens.
Rearranging the lens formula gives:
1v=1u+1f
If we let y=1v and x=1u, we can rewrite this as:
y=x+1f
This represents a straight line with a slope of 1 and a y-intercept of 1f.
The mirror formula is given by:
1v+1u=1f
Rearranging this gives:
1v=−1u+1f
Again, letting y=1v and x=1u, we can write:
y=−x+1f
This represents a straight line with a slope of -1 and a y-intercept of 1f.
- For the lens, the graph will be a straight line with a positive slope (1).
- For the mirror, the graph will be a straight line with a negative slope (-1).
Based on the analysis, both types of graphs (one with a positive slope and one with a negative slope) can be correct depending on whether we are dealing with a lens or a mirror. Therefore, the correct options are the graphs that represent these relationships.
Similar Questions
The distance v of the real image formed by a convex lens is measured for various object distance u. A graph is poltted between v and u, which one of the following graphs is correct
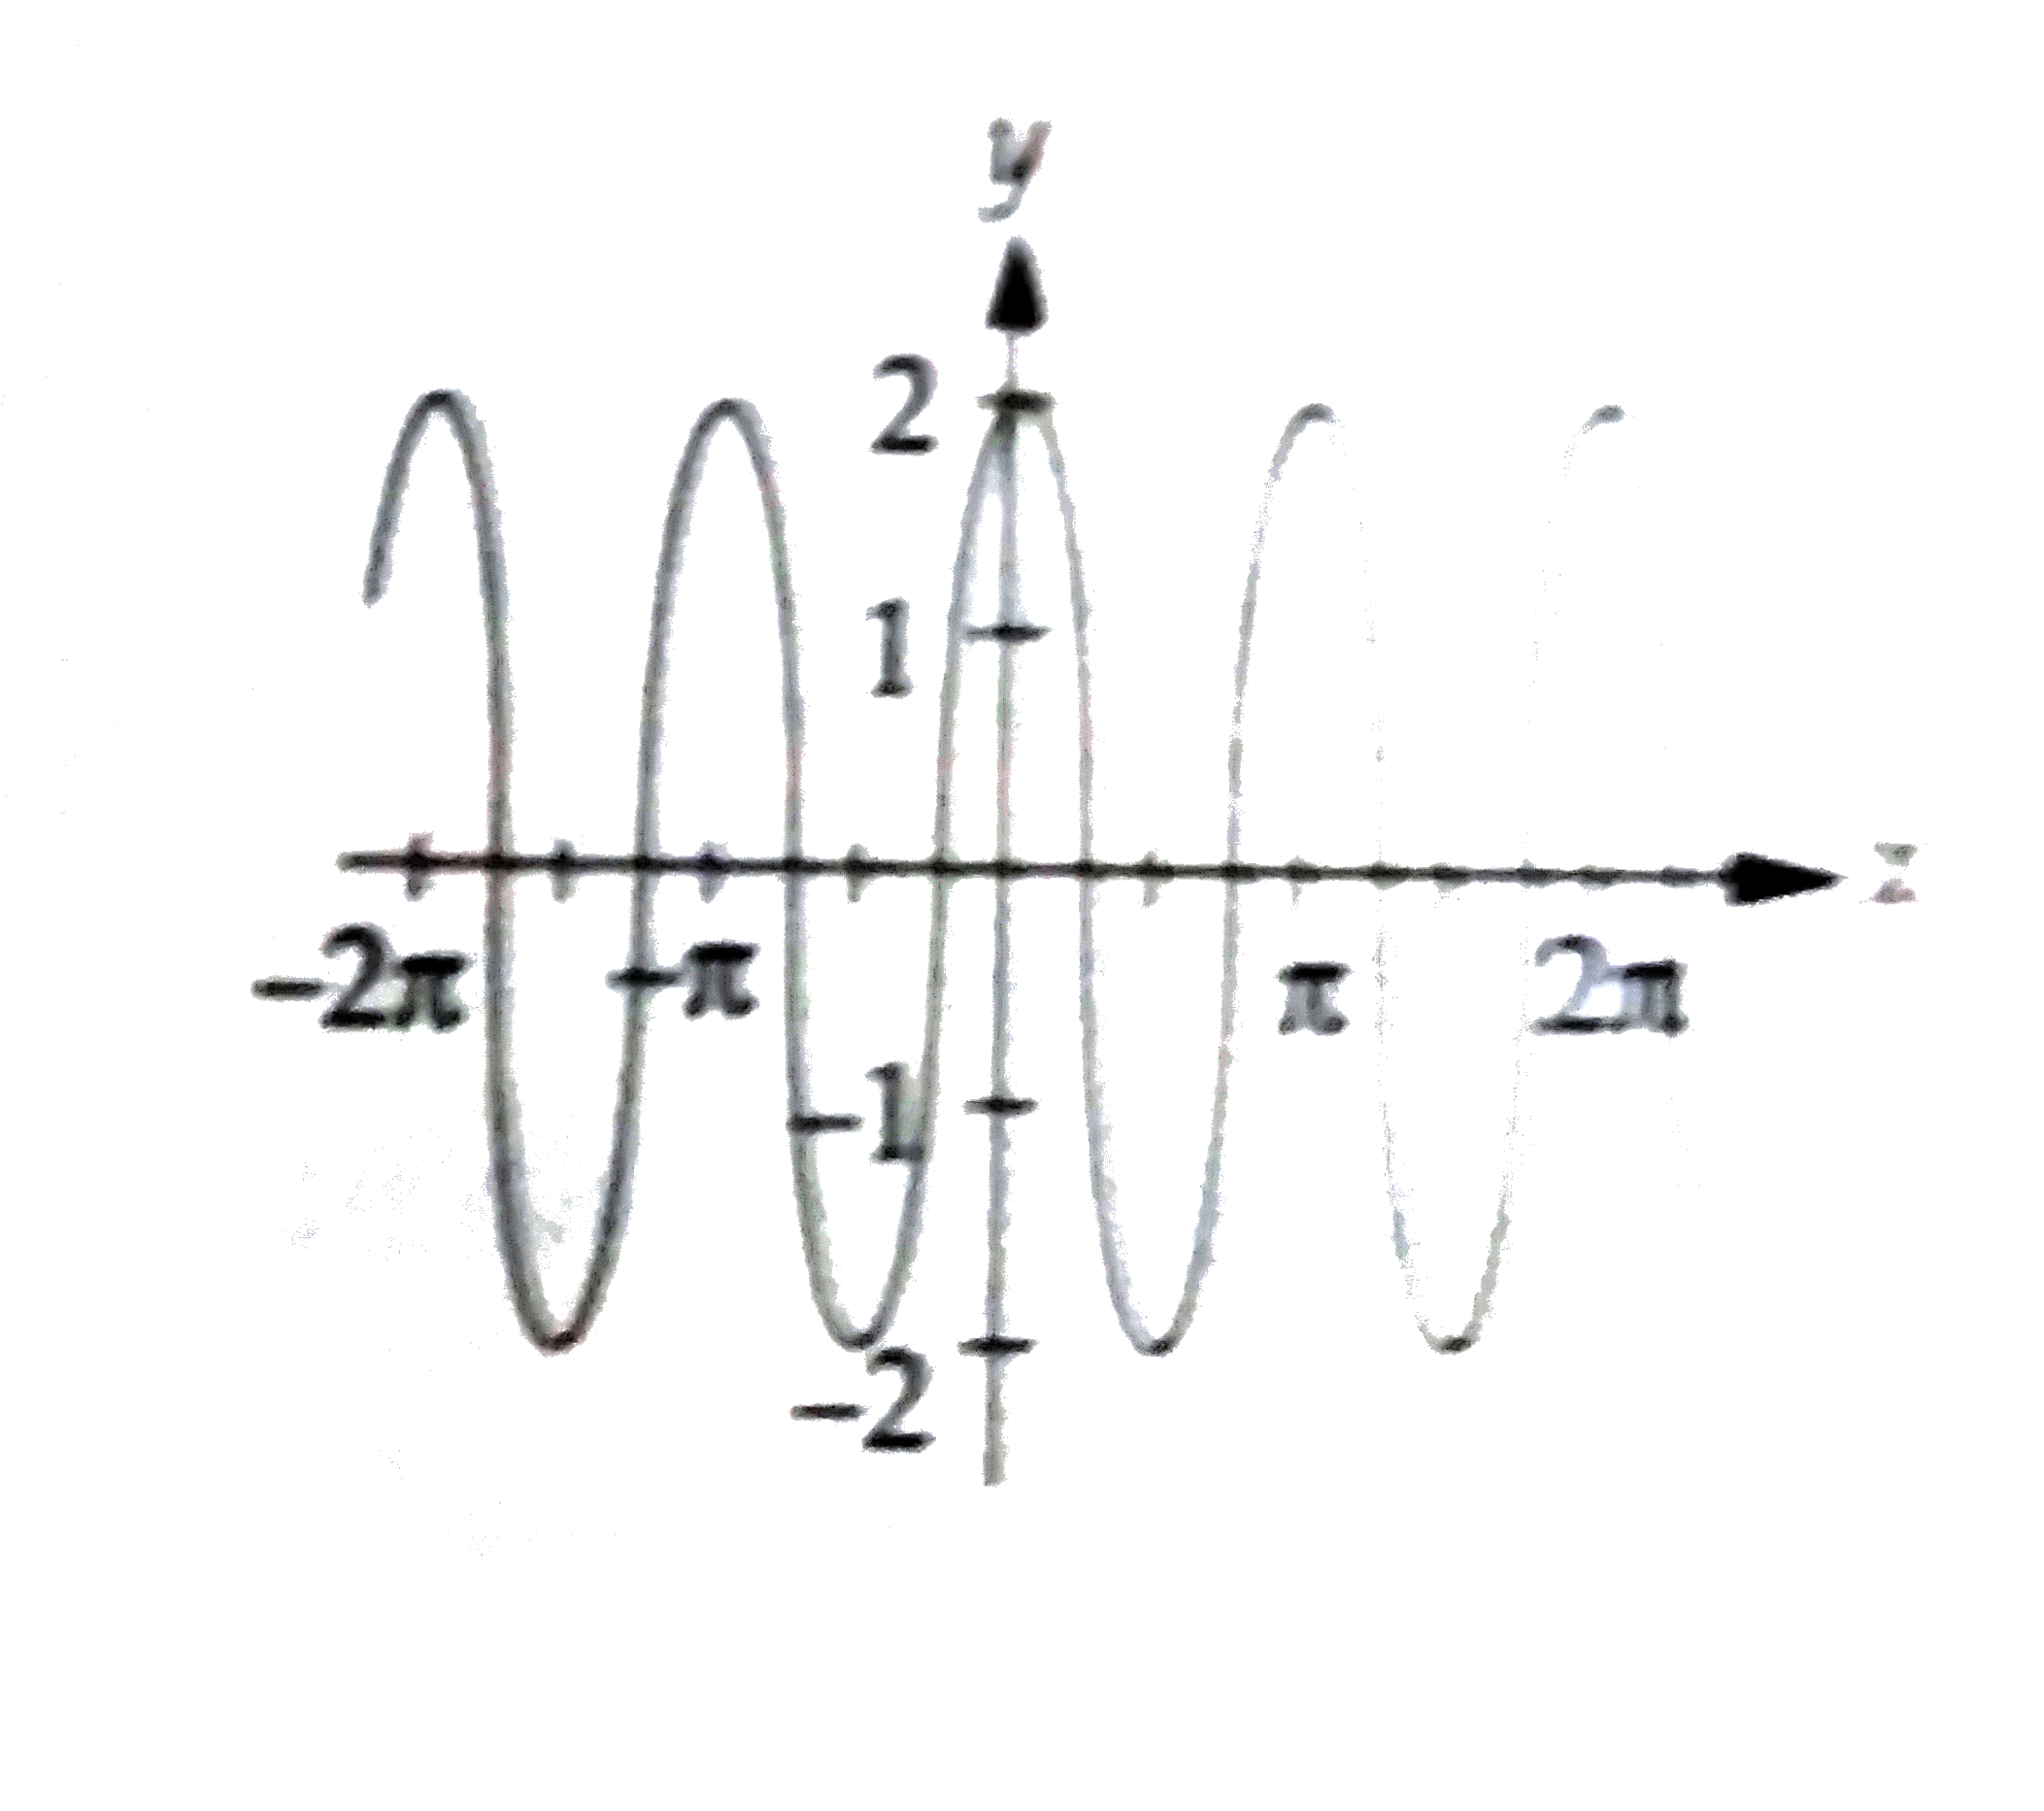
View SolutionWhich of the following is an equation of the graph shown in Figure
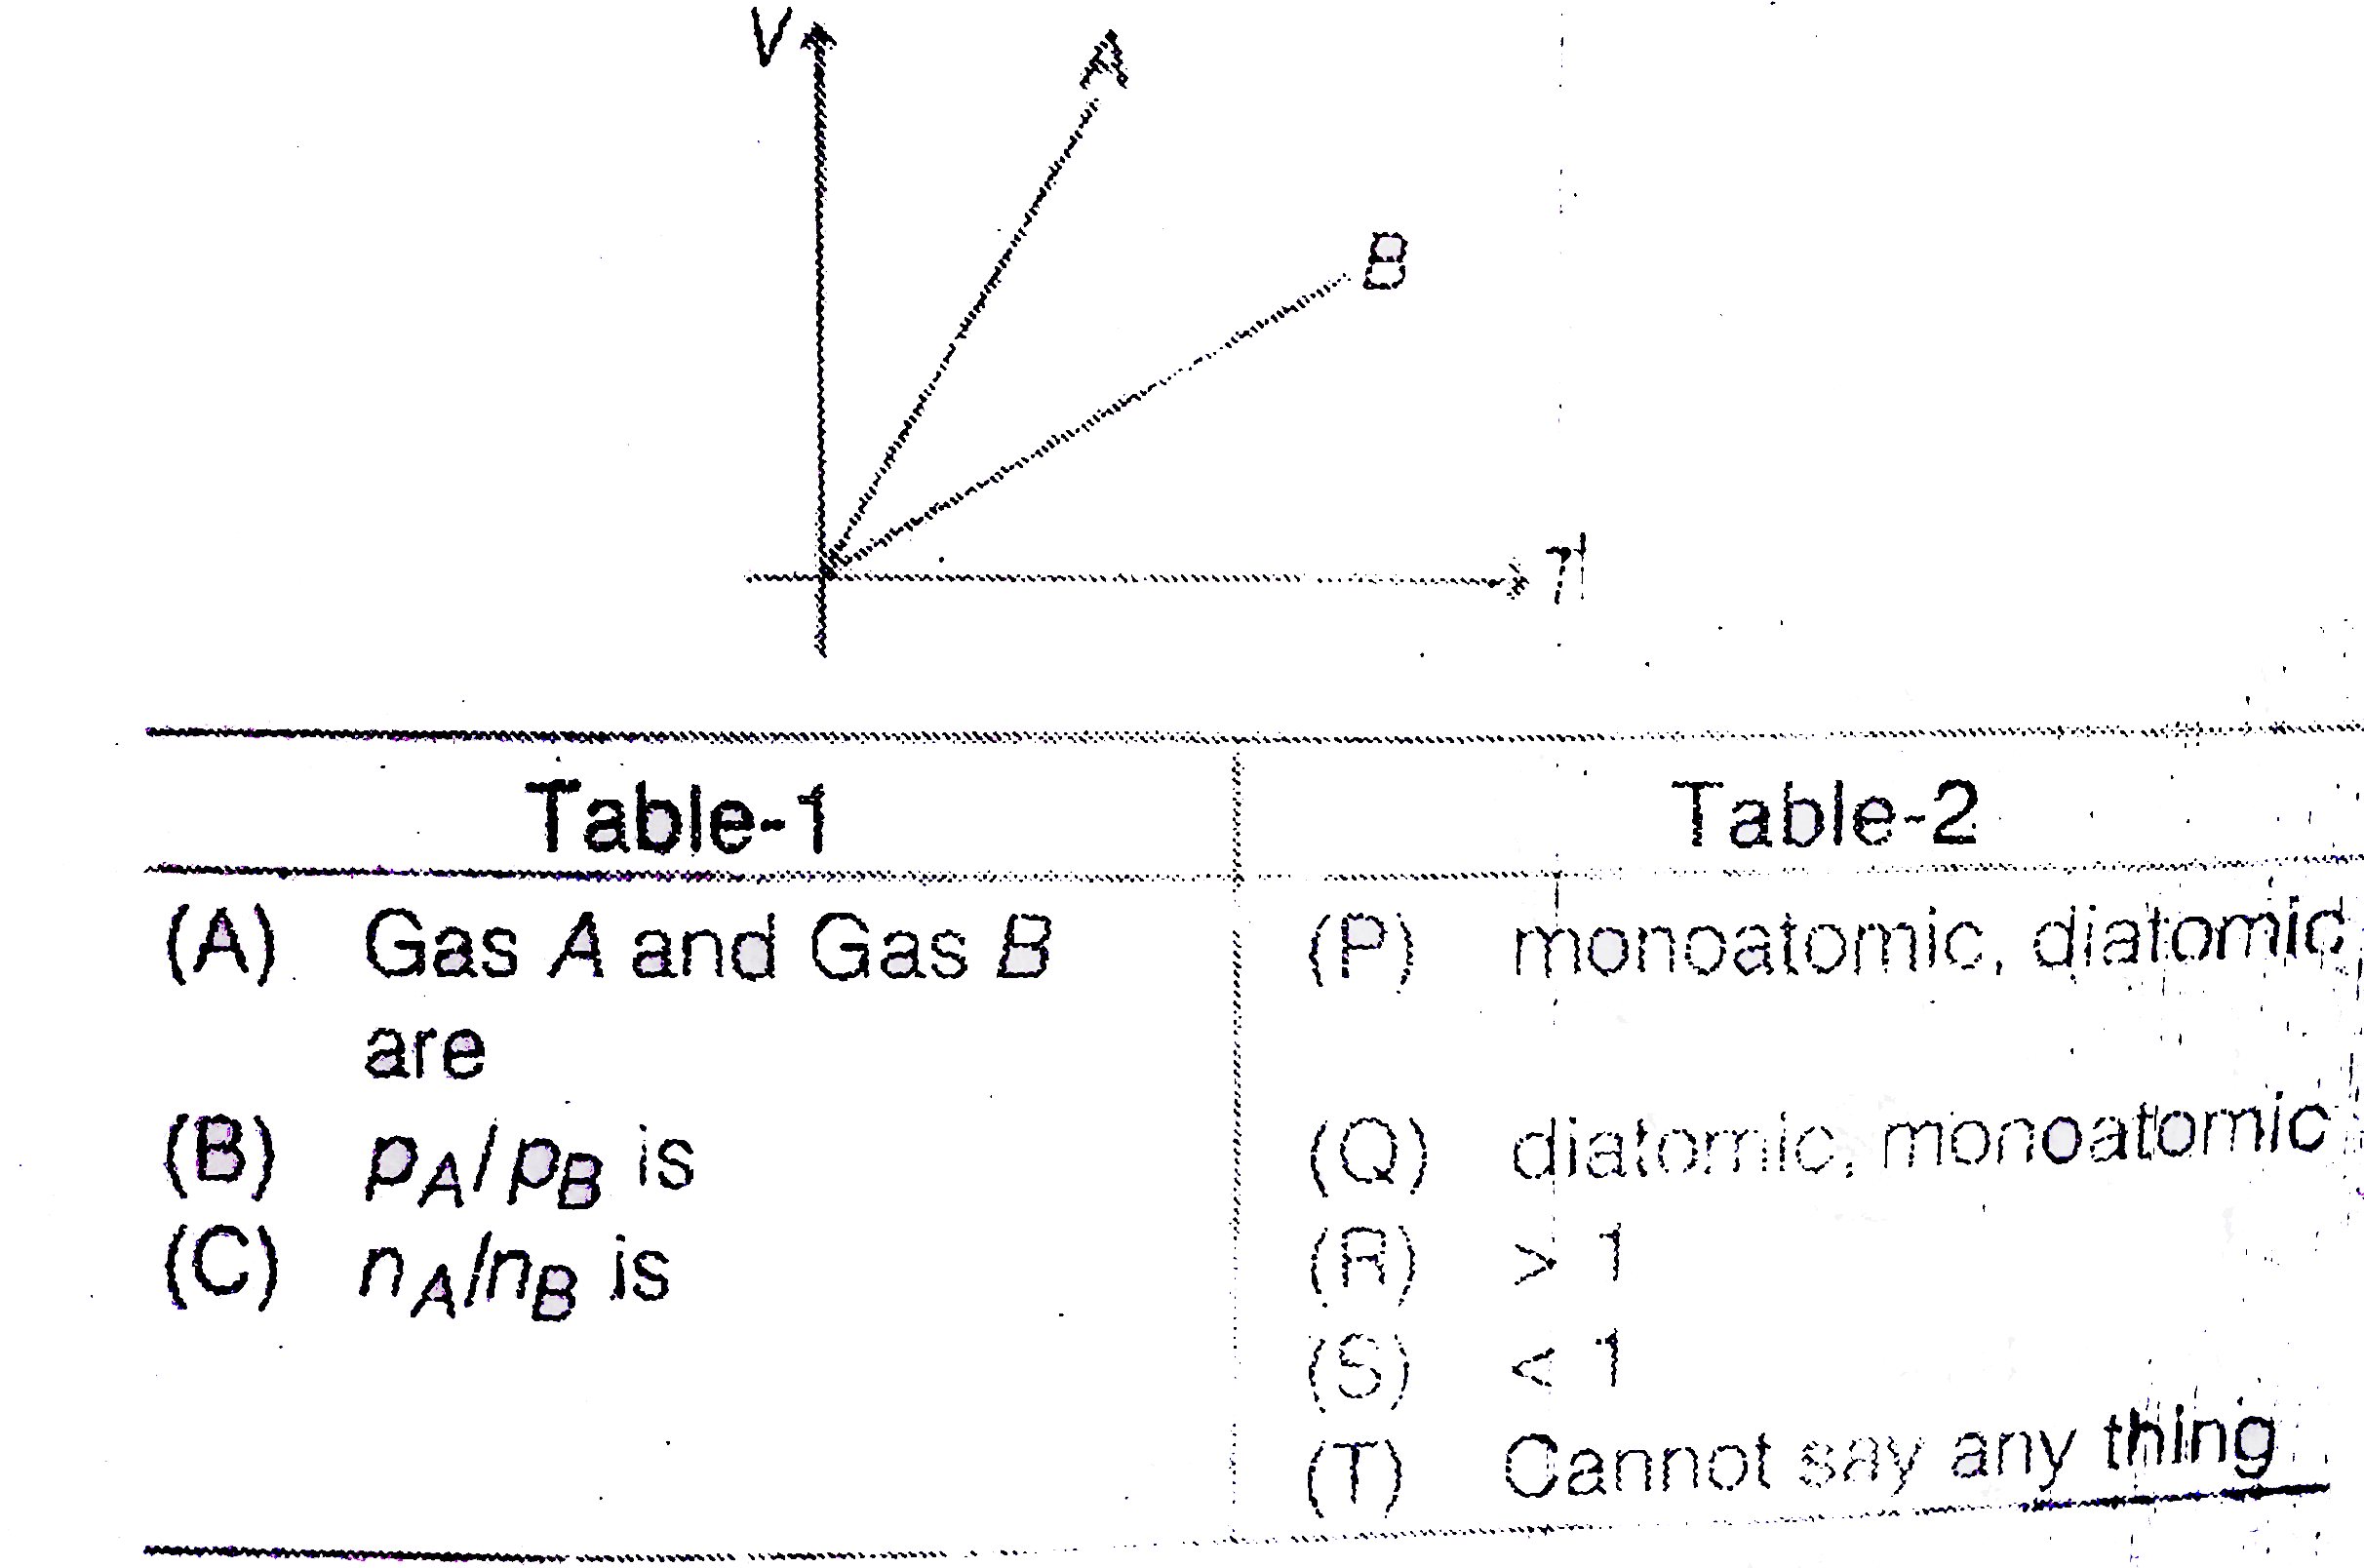
View SolutionIn the V-T graph shown in figure match the following.
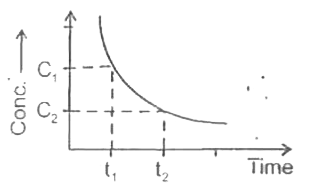
View SolutionThe graph plotted between concentration versus time
View SolutionIn Searl's experiment a graph is plotted between
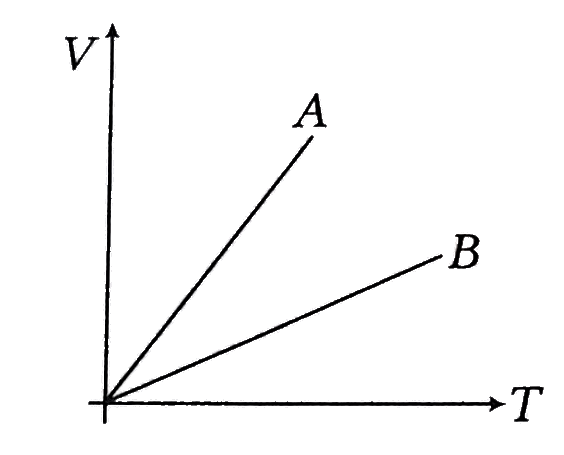
View SolutionIn the V-T graph shown in the figure match the following columns.
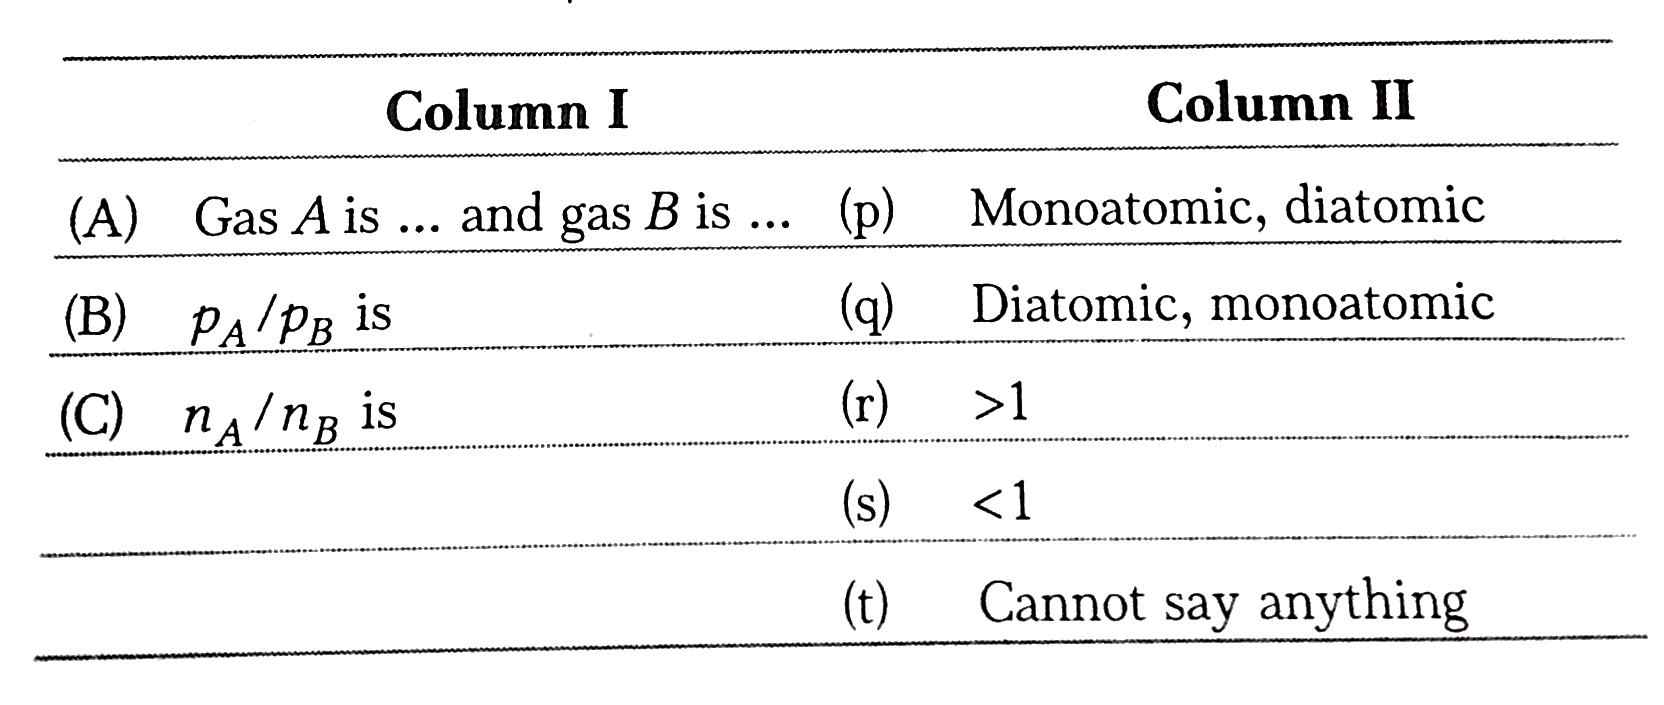
View SolutionA projectile is projected with a velocity u at an angle θ with the horizontal. For a fixed θ, which of the graphs shown in the following figure shows the variation of range R versus u?
View SolutionThe graph in figure shows the velocity v versus time t for a body. Which of the graphs shown in figure represents the correesponding acceleration versus time graphs ?
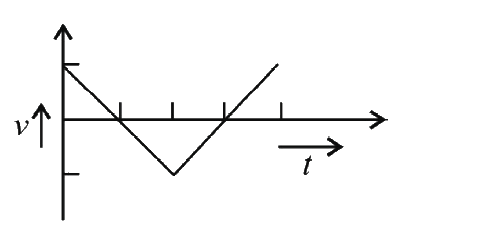
View SolutionThe displacement-time graph of a moving object is shown in figure. Which of the velocity-time graphs shown in figure could represent the motion of the same body ?
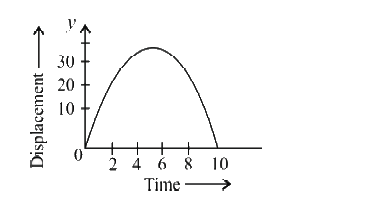
View SolutionWhen a plot between logk and 1/T is plotted we get the graph as shown.
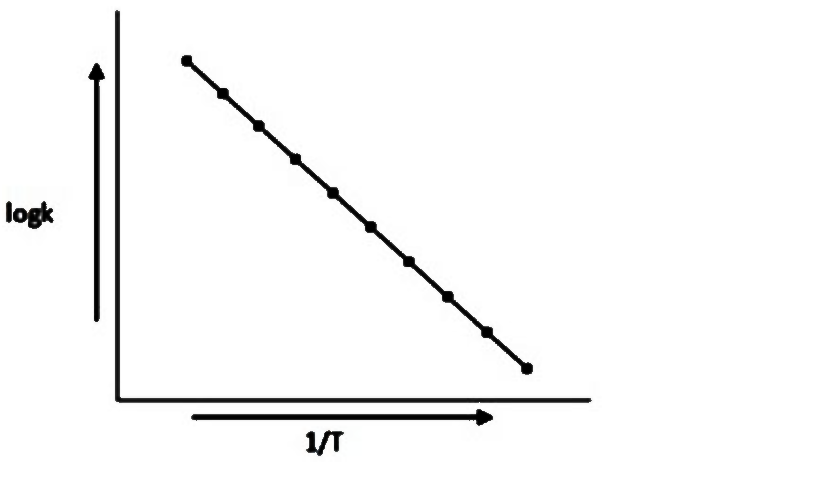
What is the value of slope in the graph?
View Solution
