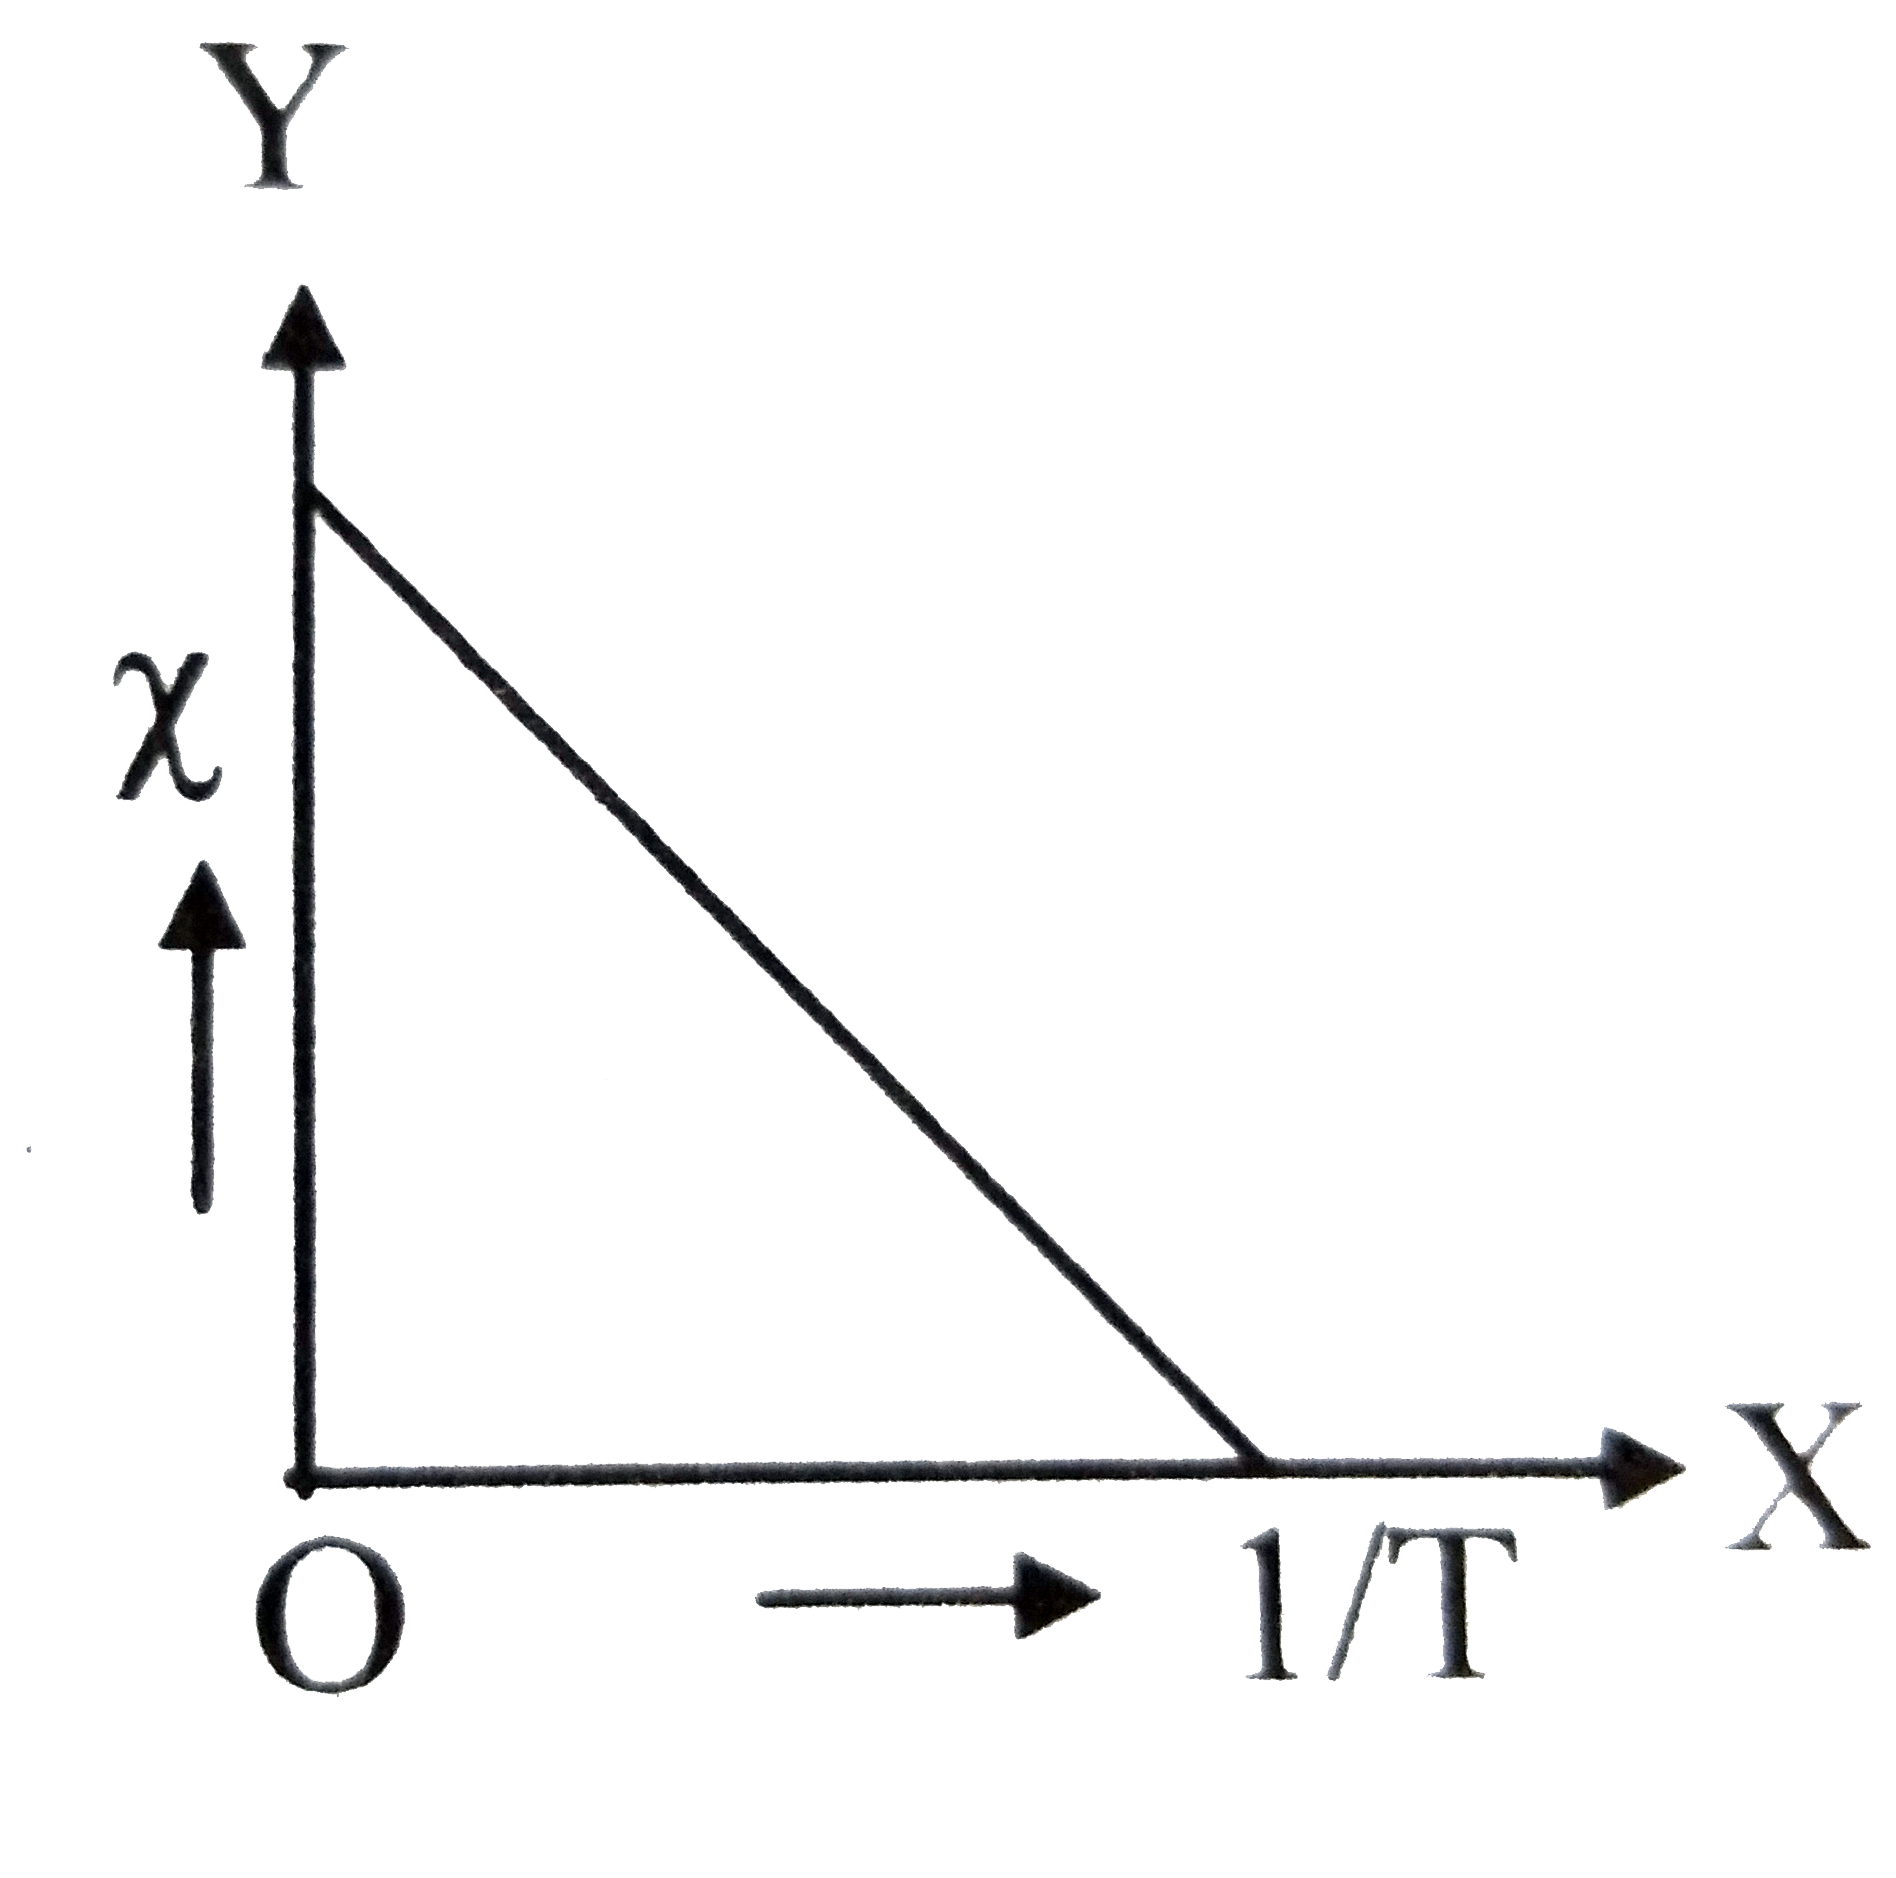
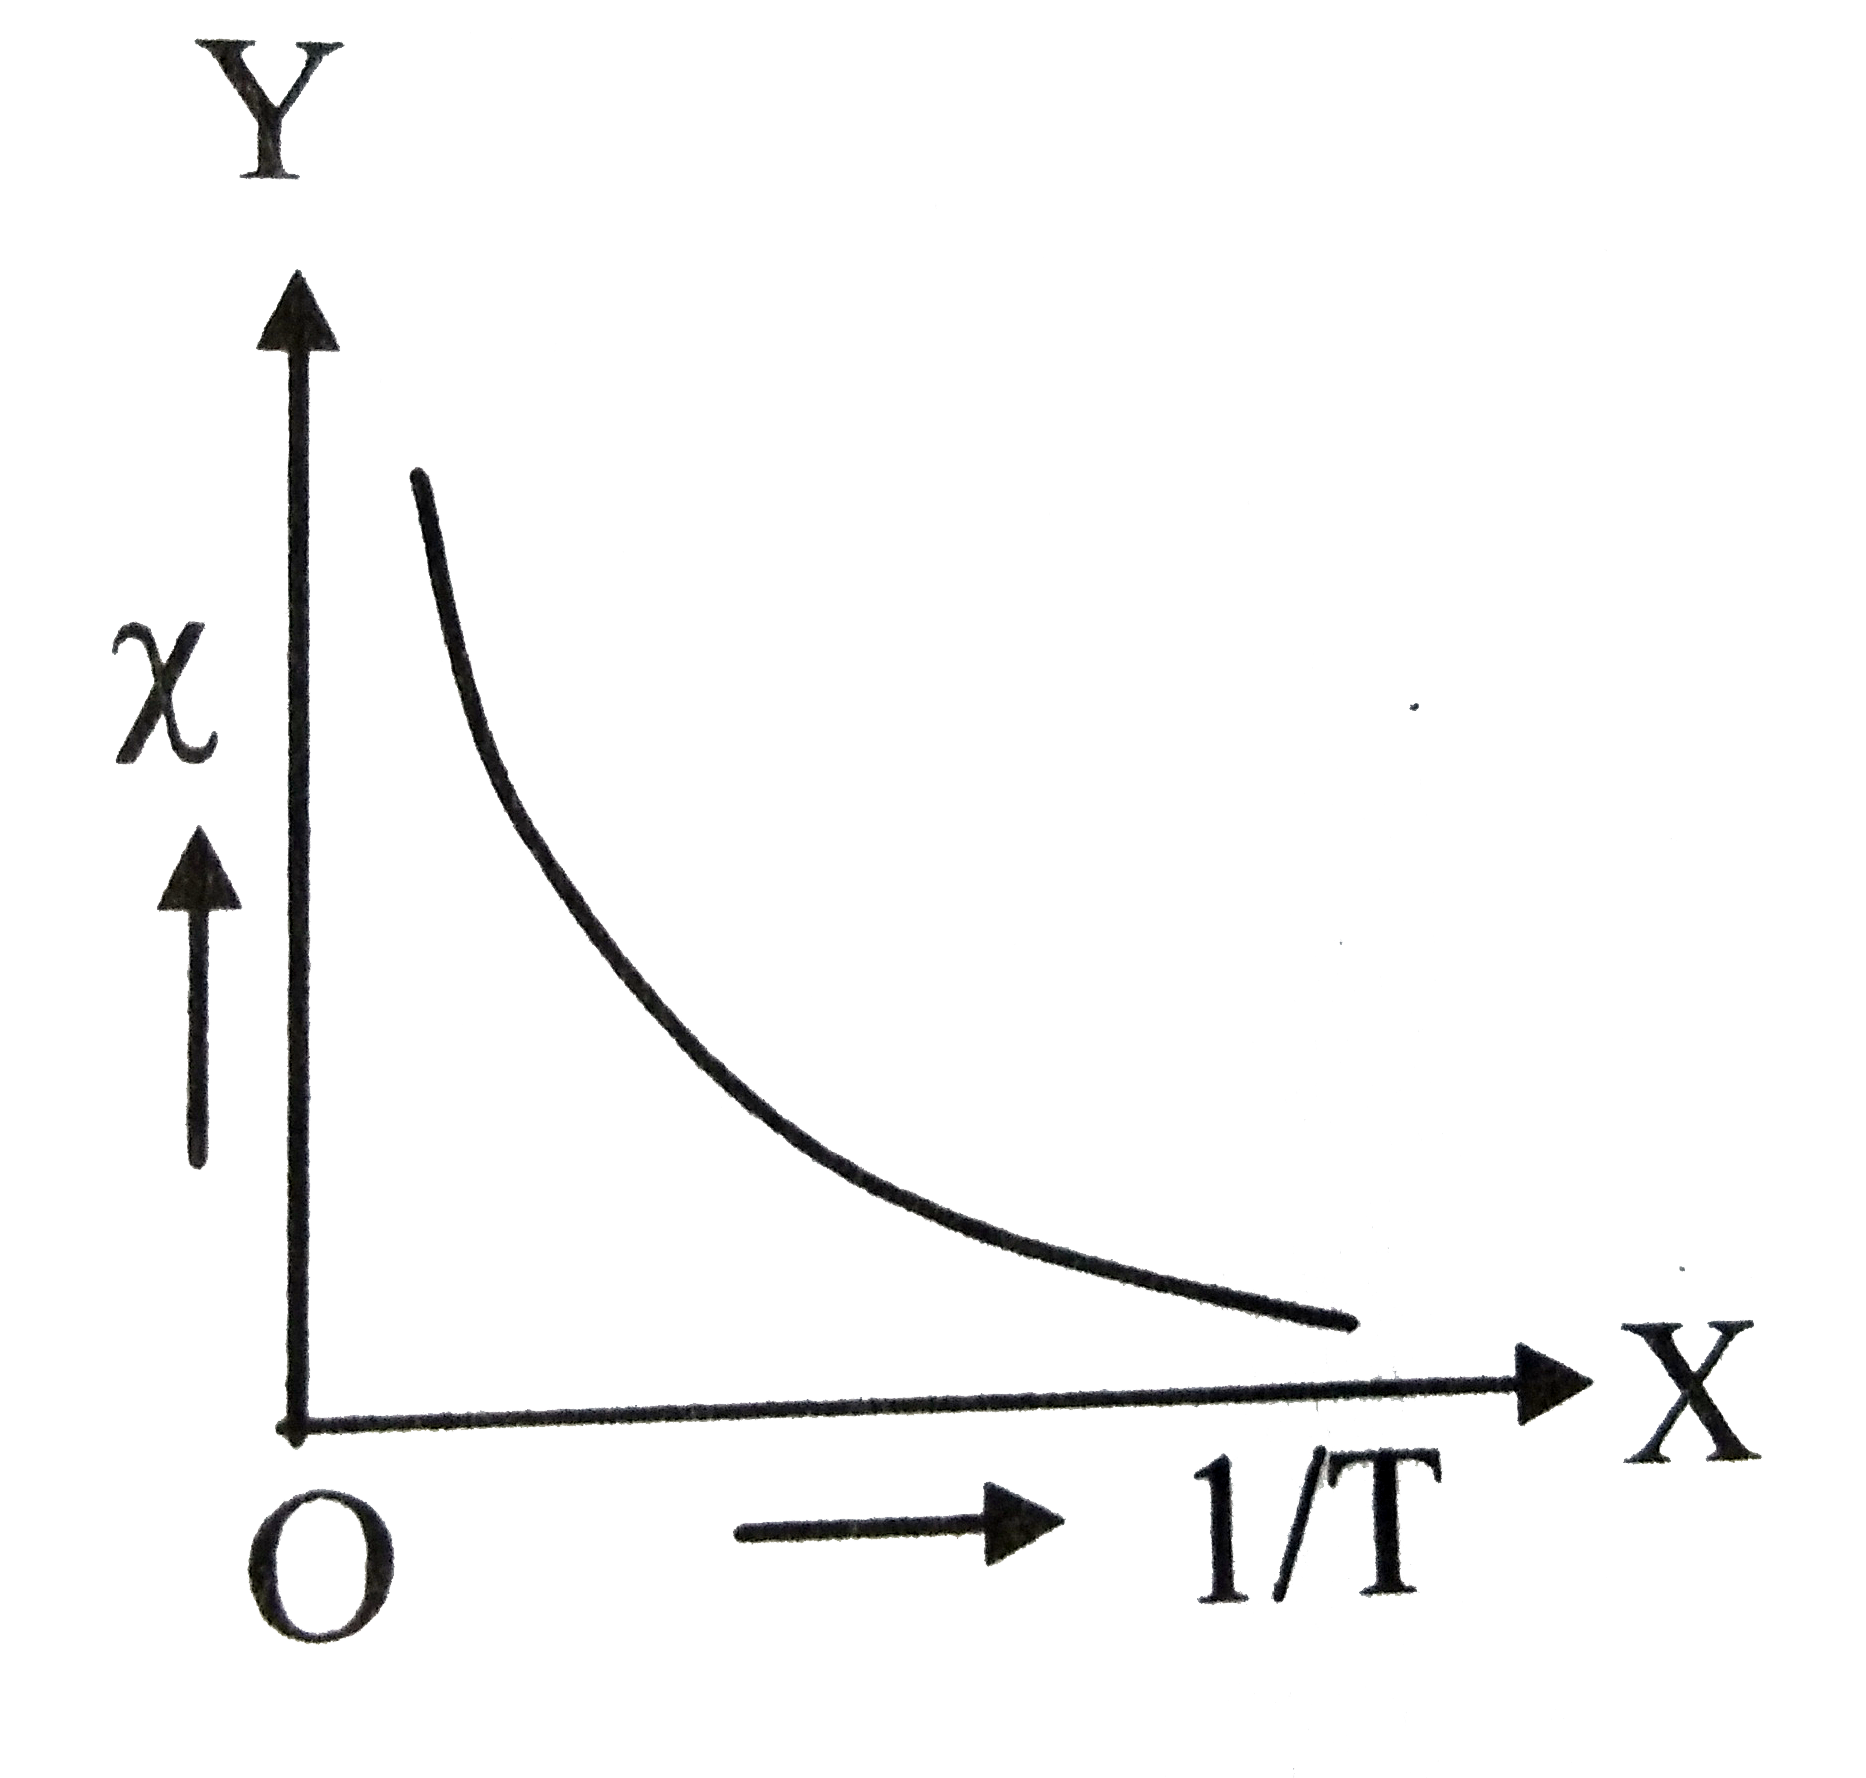
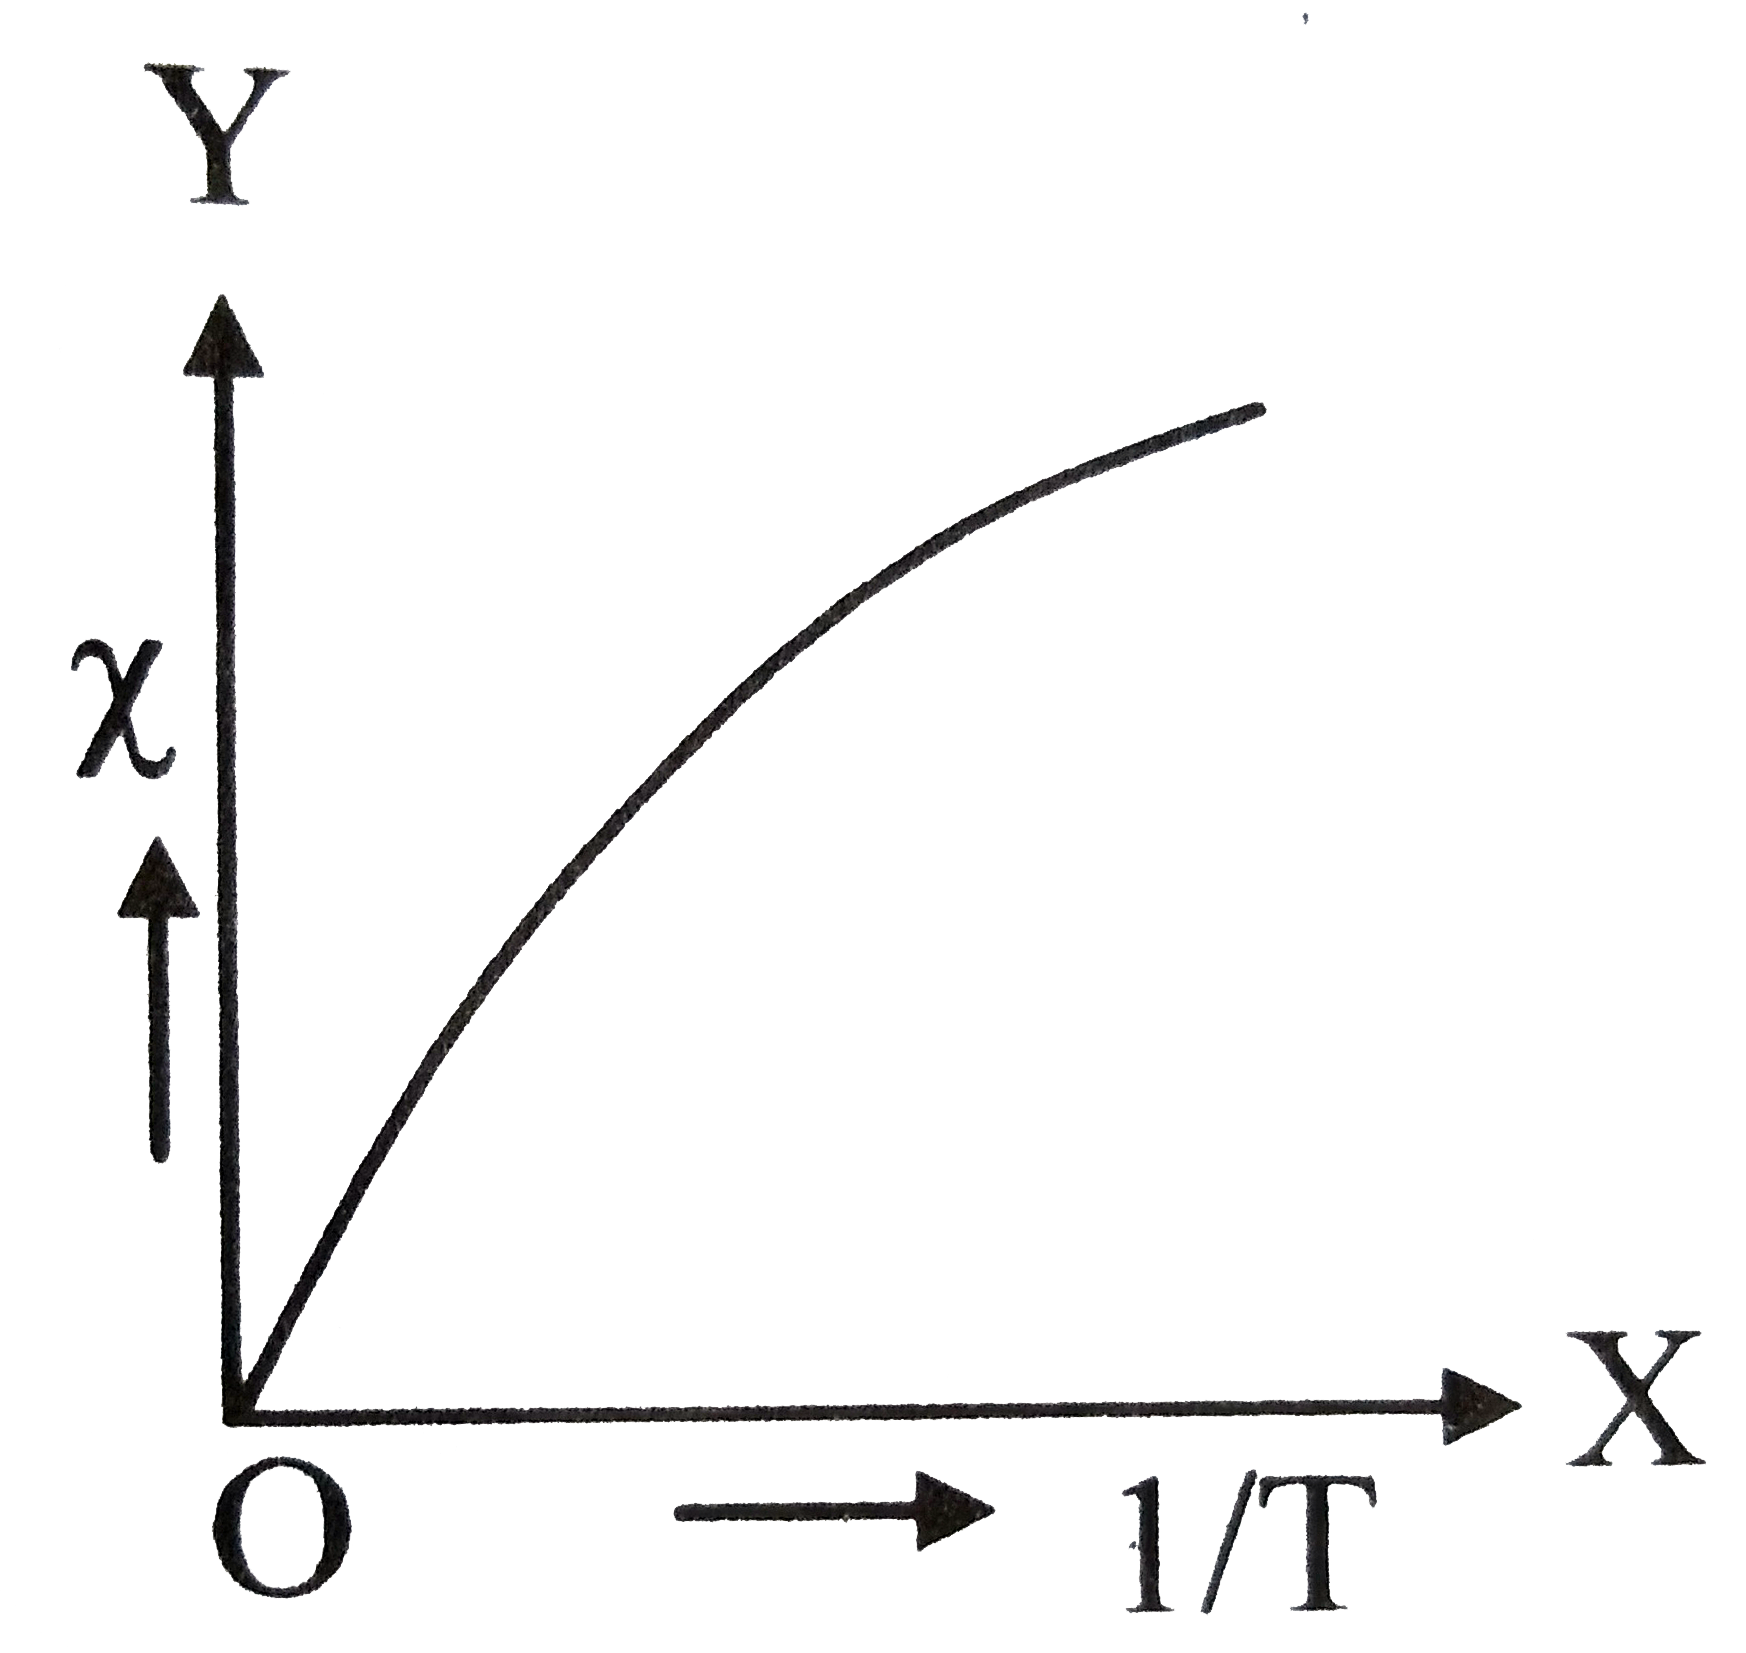
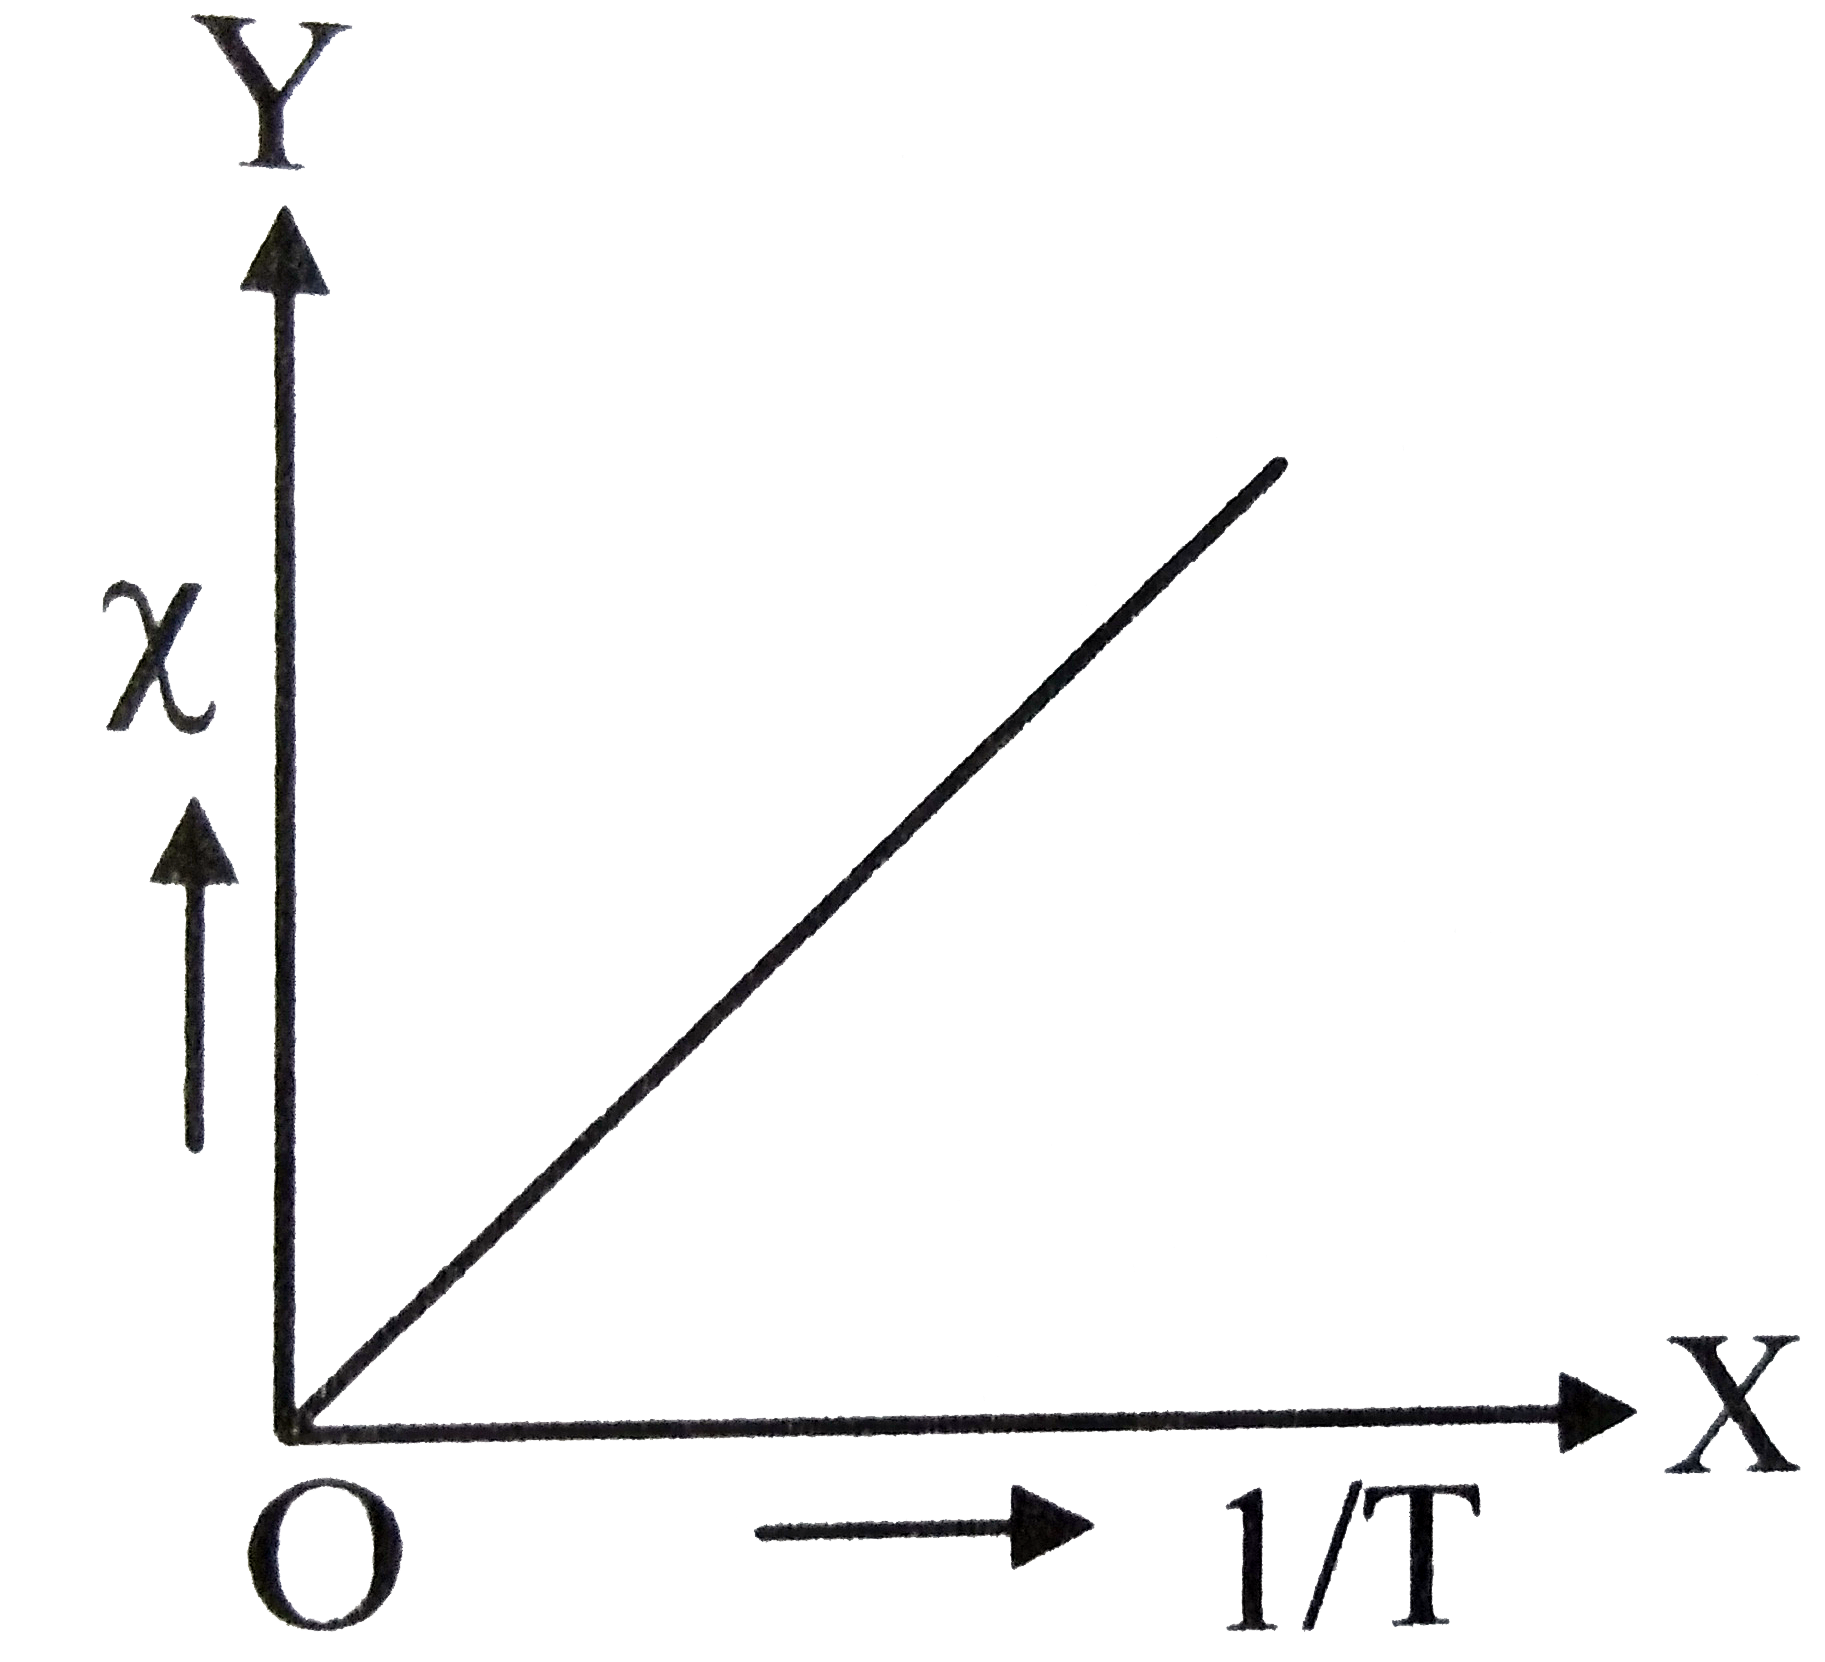
The graph between χ and 1/T for paramagnetic material will be represented by
The correct Answer is:D
To solve the question regarding the graph between susceptibility (χ) and 1/T for a paramagnetic material, we can follow these steps:
1. Understand the Concept:
- For paramagnetic materials, the susceptibility (χ) is related to temperature (T) through Curie's Law, which states that χ is inversely proportional to T.
2. Write the Equation:
- According to Curie's Law, we can express this relationship mathematically as:
χ=CT
- This can also be rewritten as:
χ=C⋅1T
- Here, C is Curie's constant.
3. Identify Variables:
- In this equation, we can identify:
- y-axis: χ (susceptibility)
- x-axis: 1T
4. Determine the Type of Graph:
- The equation χ=C⋅1T is in the form of y=mx, where m (slope) is equal to C.
- This indicates a linear relationship between χ and 1T.
5. Graph Characteristics:
- Since the equation is linear, the graph will be a straight line.
- The line will pass through the origin (0,0) because when T approaches infinity (1/T approaches 0), χ approaches 0.
6. Select the Correct Graph:
- From the options provided, we need to identify which graph is a straight line passing through the origin.
- After evaluating the options, we find that only option D represents a straight line that passes through the origin.
Conclusion:
- The correct answer is option D, which represents the graph of susceptibility (χ) versus 1T for a paramagnetic material.
- For paramagnetic materials, the susceptibility (χ) is related to temperature (T) through Curie's Law, which states that χ is inversely proportional to T.
- According to Curie's Law, we can express this relationship mathematically as:
χ=CT
- This can also be rewritten as:
χ=C⋅1T
- Here, C is Curie's constant.
- In this equation, we can identify:
- y-axis: χ (susceptibility)
- x-axis: 1T
- The equation χ=C⋅1T is in the form of y=mx, where m (slope) is equal to C.
- This indicates a linear relationship between χ and 1T.
- Since the equation is linear, the graph will be a straight line.
- The line will pass through the origin (0,0) because when T approaches infinity (1/T approaches 0), χ approaches 0.
- From the options provided, we need to identify which graph is a straight line passing through the origin.
- After evaluating the options, we find that only option D represents a straight line that passes through the origin.
- The correct answer is option D, which represents the graph of susceptibility (χ) versus 1T for a paramagnetic material.
Topper's Solved these Questions
- MAGNETISMBOOK - TARGET PUBLICATIONCHAPTER - MAGNETISMEXERCISE - COMPETITIVE THINKING
49 Videos
- MAGNETISMBOOK - TARGET PUBLICATIONCHAPTER - MAGNETISMEXERCISE - EVALUATION TEST
14 Videos
- MAGNETISMBOOK - TARGET PUBLICATIONCHAPTER - MAGNETISMEXERCISE - EVALUATION TEST
14 Videos
- MAGNETIC EFFECT OF ELECTRIC CURRENTBOOK - TARGET PUBLICATIONCHAPTER - MAGNETIC EFFECT OF ELECTRIC CURRENTEXERCISE - EVALUATION TEST
19 Videos
- MODEL QUESTION PAPER BOOK - TARGET PUBLICATIONCHAPTER - MODEL QUESTION PAPER EXERCISE - MODEL QUESTION PAPER -II
47 Videos
Similar Questions
Knowledge Check
The graph between χ and T for paramagnetic material will be represented by
A B
B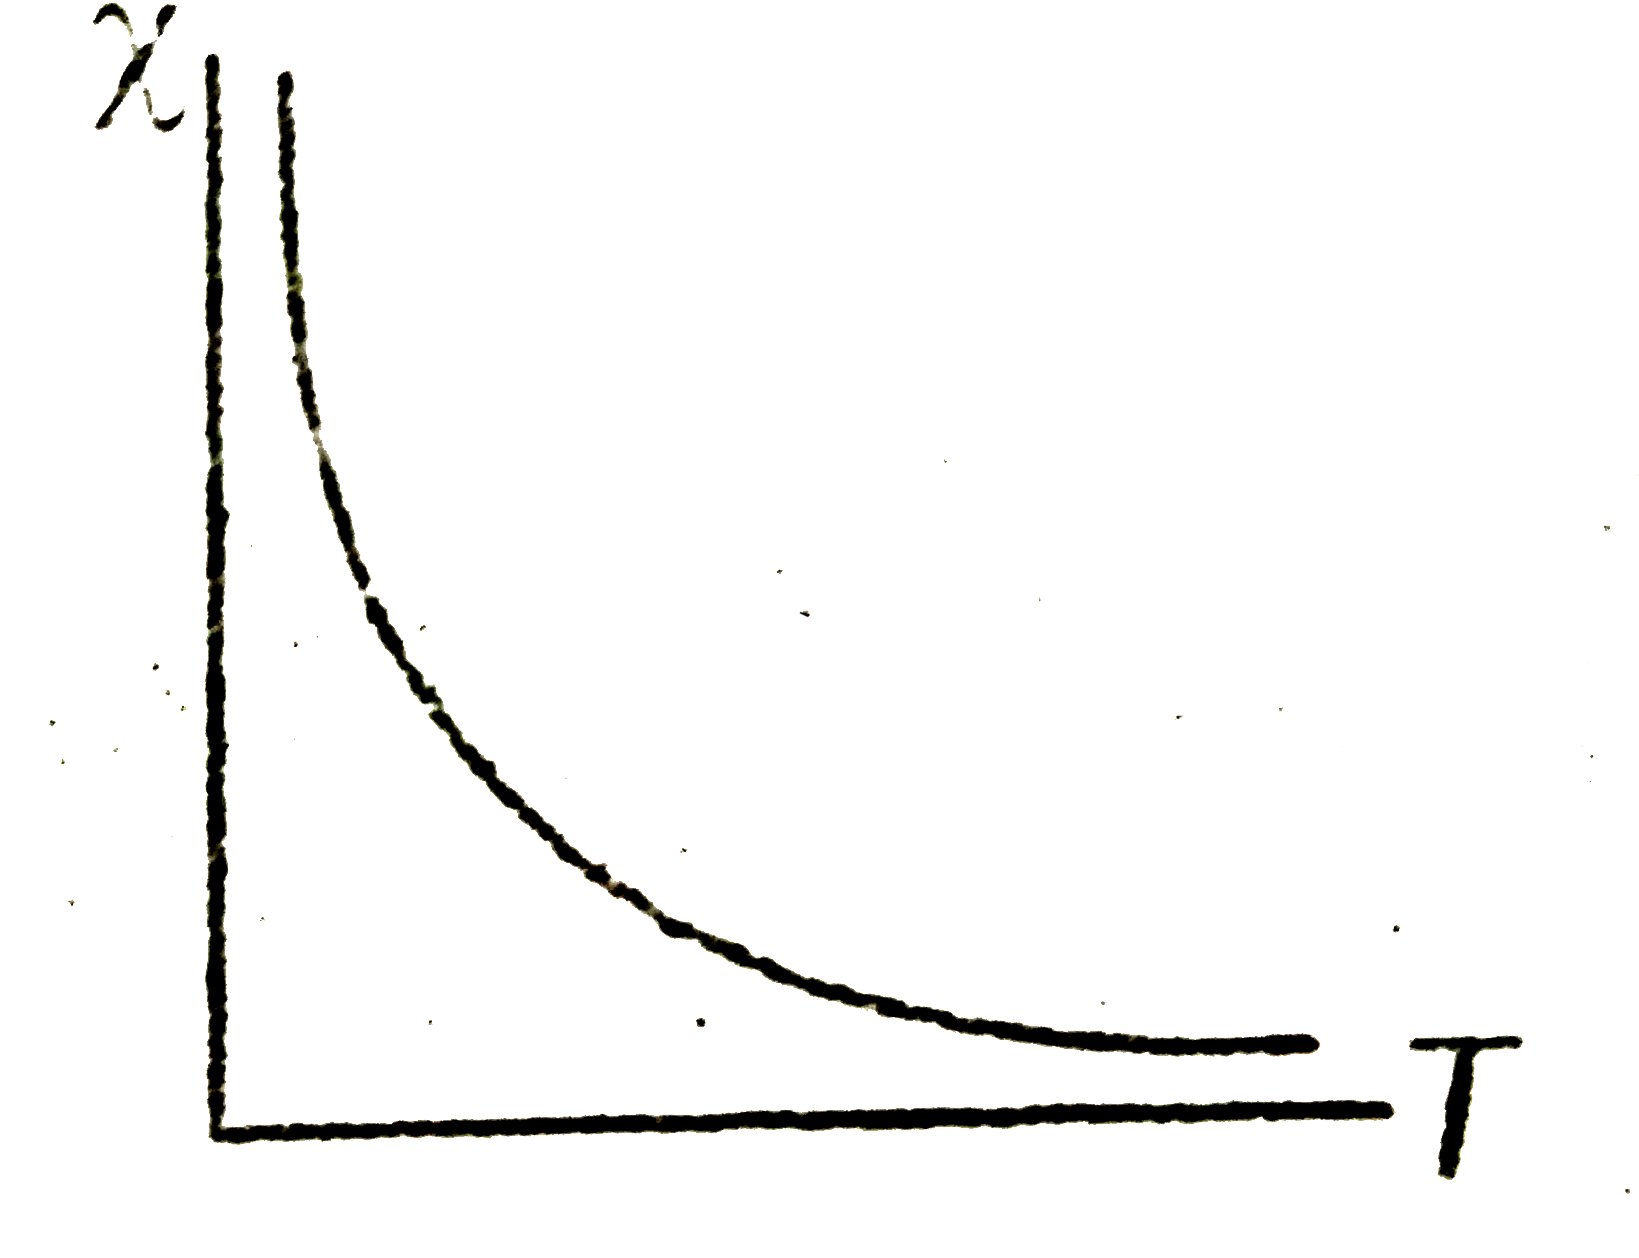 C
C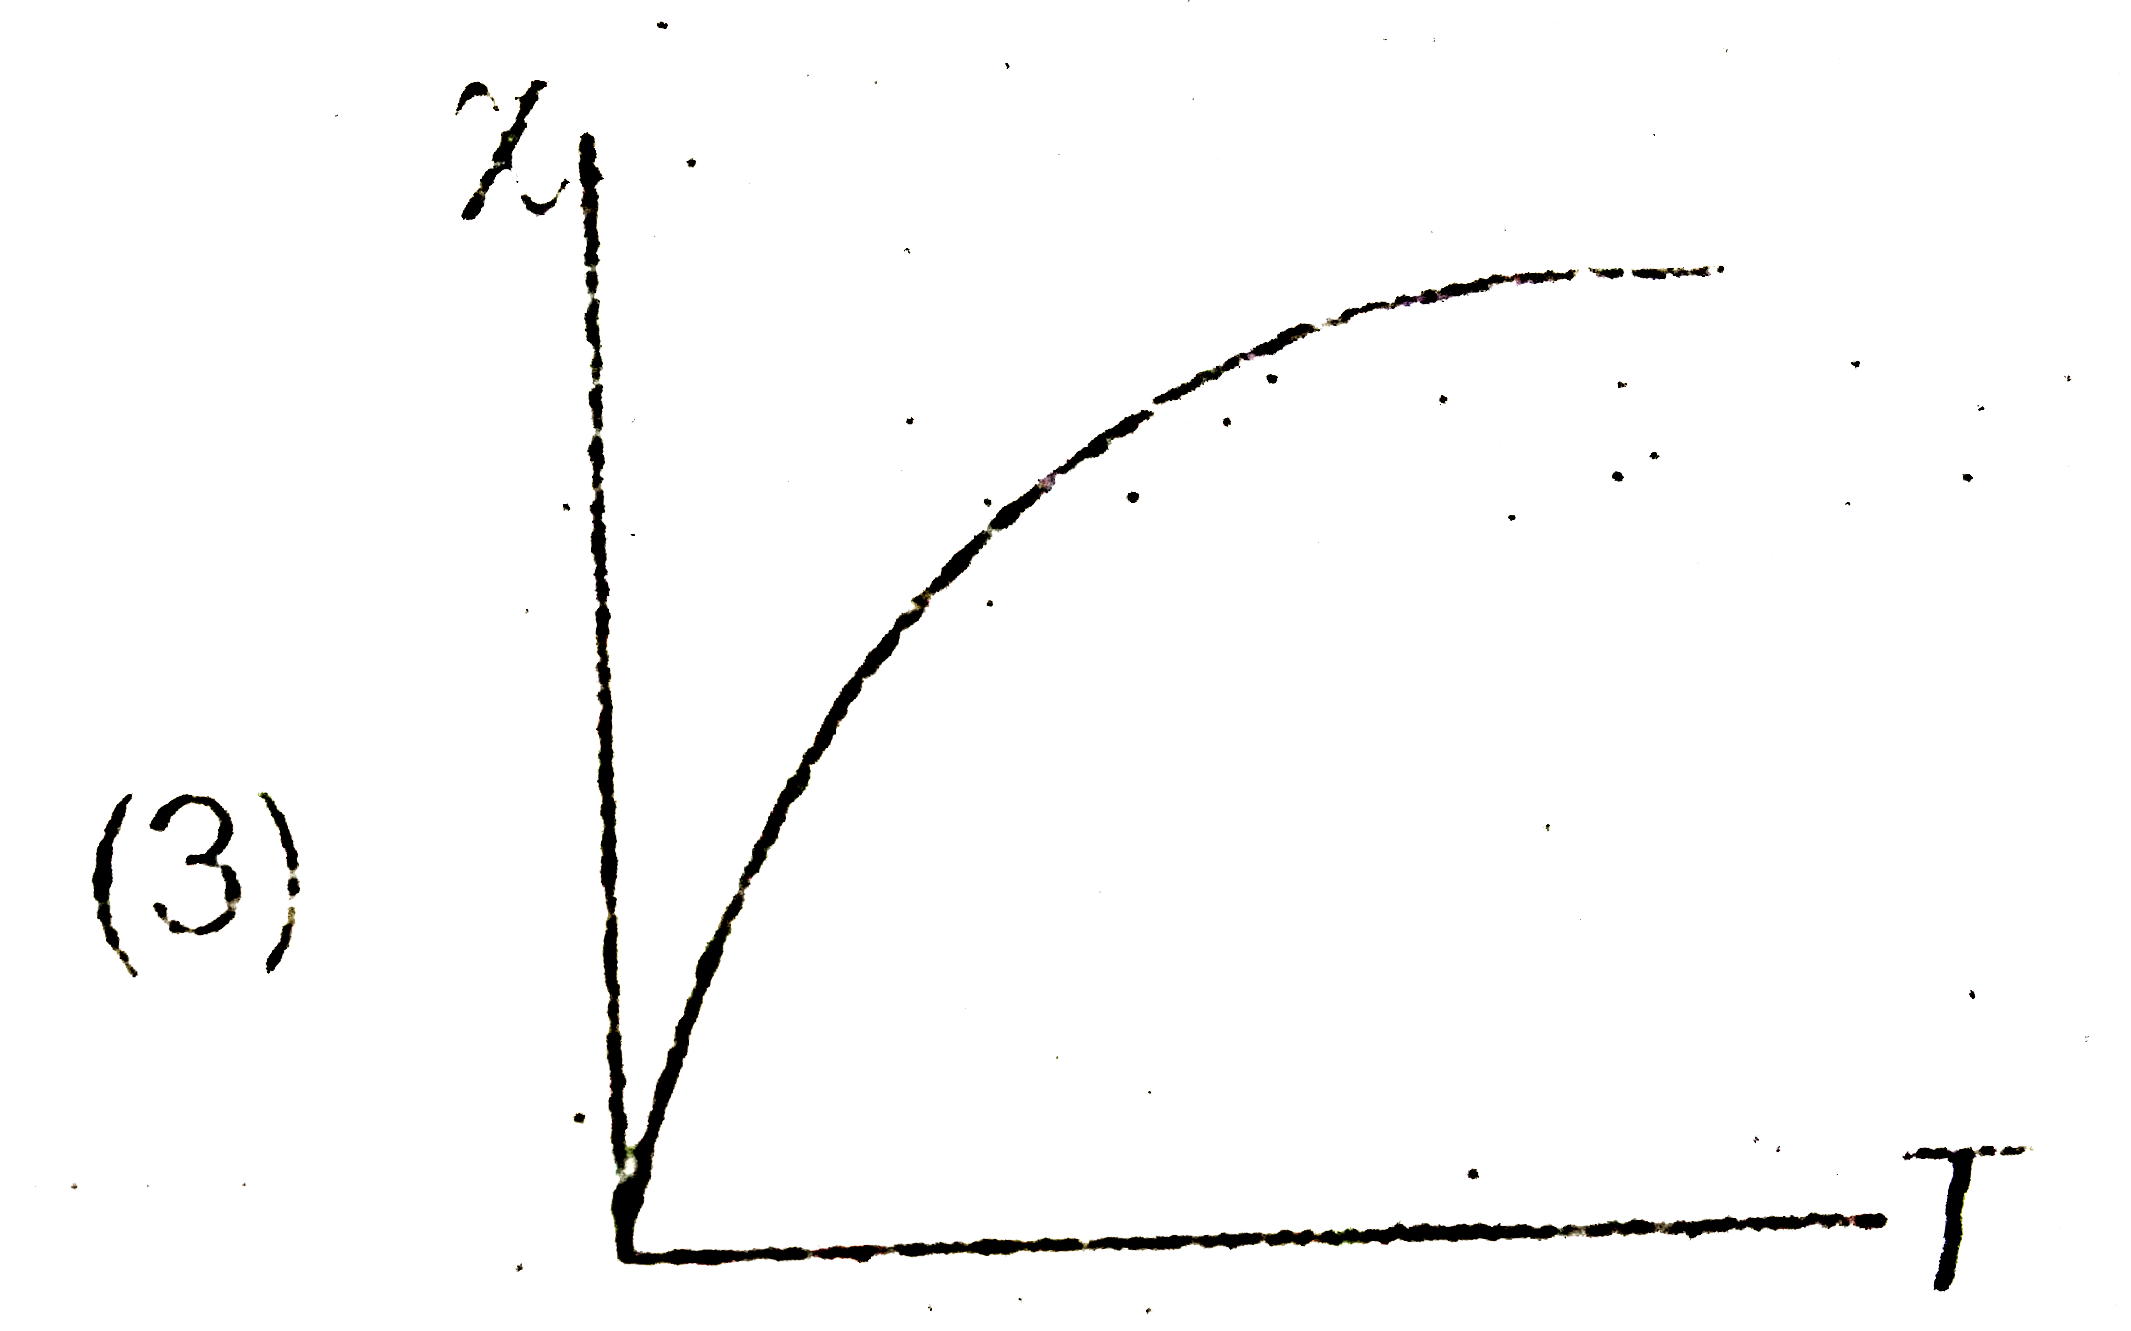 D
D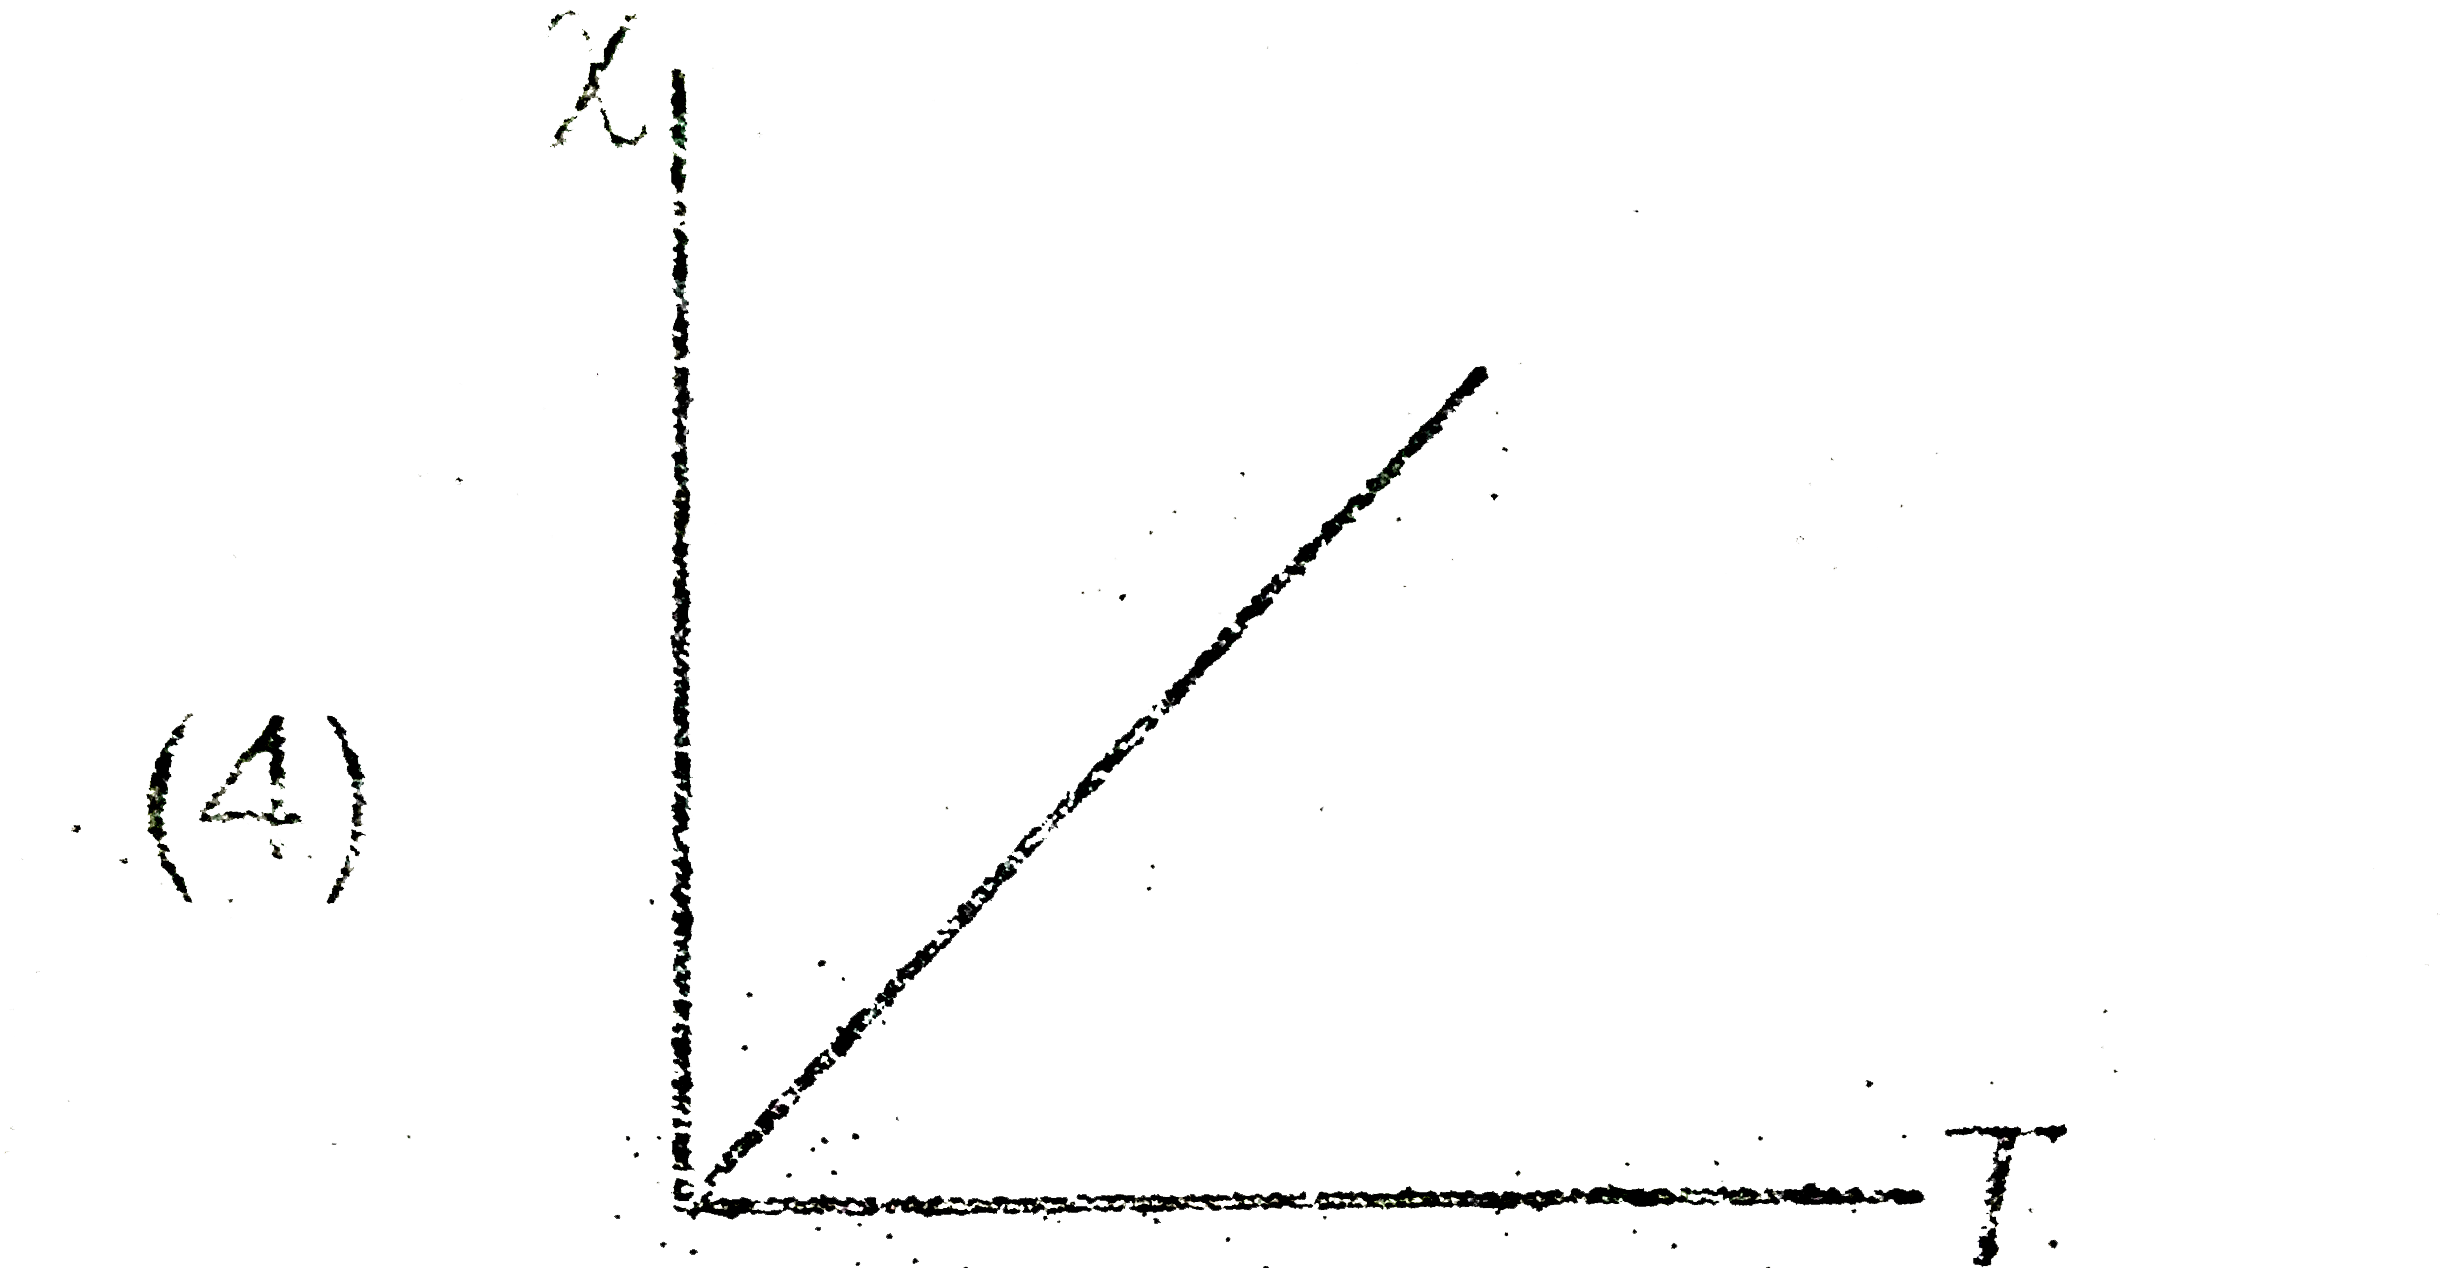
The graph between L and T2 is
A B
B C
C D
D
The graph between L and T2 is
A B
B C
C D
D
The intensity of magnetization of the magnetic fields graph for a diamagnetic material is best represented by.
View SolutionThe graph between (P/T) and T for a gas at constant volume will be:
View SolutionThe magnetic moment of paramagnetic material is
View SolutionThe variation of magnetic susceptibility (x) with temperature (T) for a diamagnetic material is best represented by
View SolutionThe correct I - H graph for a paramagnetic material will look like .
View Solution
