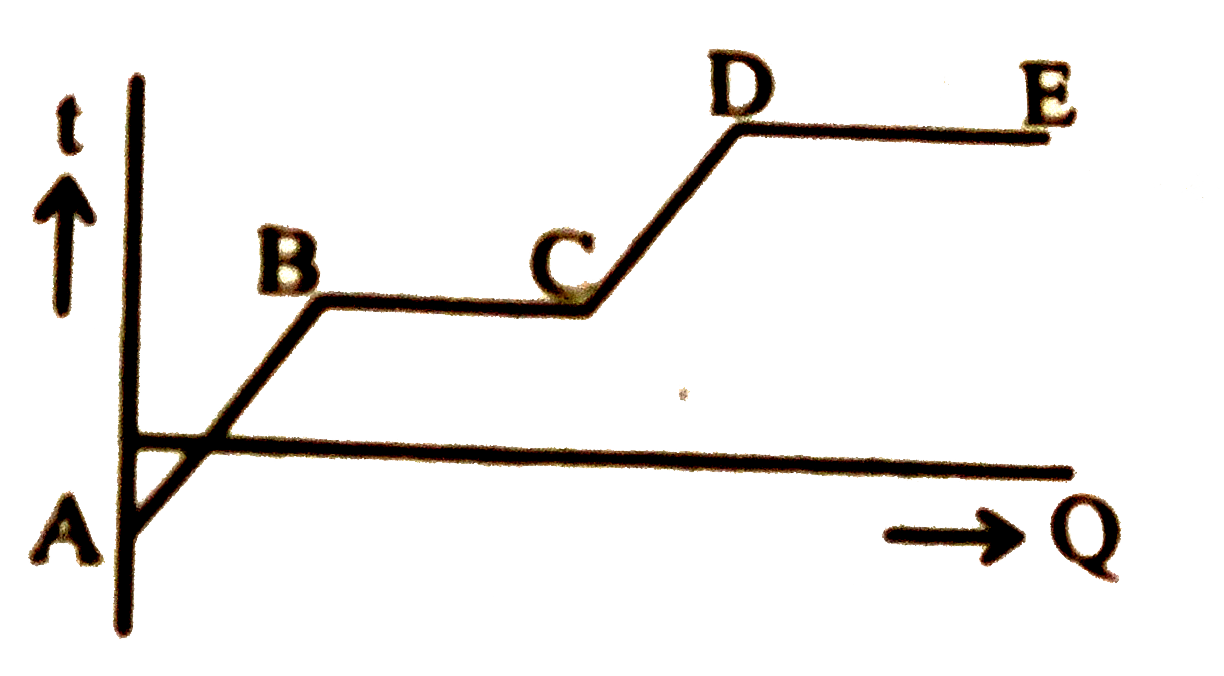
The graph given above indicates change in temperature (Δt) when heat (Q) was given to a substance. Which among the following parts of the graph correctly depict the latent heat of the substance?
AB and BC
Bc and DE
CD and DE
DE and AB
The correct Answer is:B
Latent heat is the heat released or absorbed by a body or a thermodynamic system during a constant- temperature process. A typical example is a change of state of matter, meaning a phase transition such as the melting ofice or the boiling of water.
Topper's Solved these Questions
Similar Questions
20 g of a substance is melted when 500 J of heat is added. What is the specific latent heat of fusion of the substance?
View Solution100 g of ice at −15∘––C was heated ,the rise in termperature of ice was plotted against the heat given to ice .Which of the following graphs correctly depicts this behaviour ?
View Solution
Knowledge Check
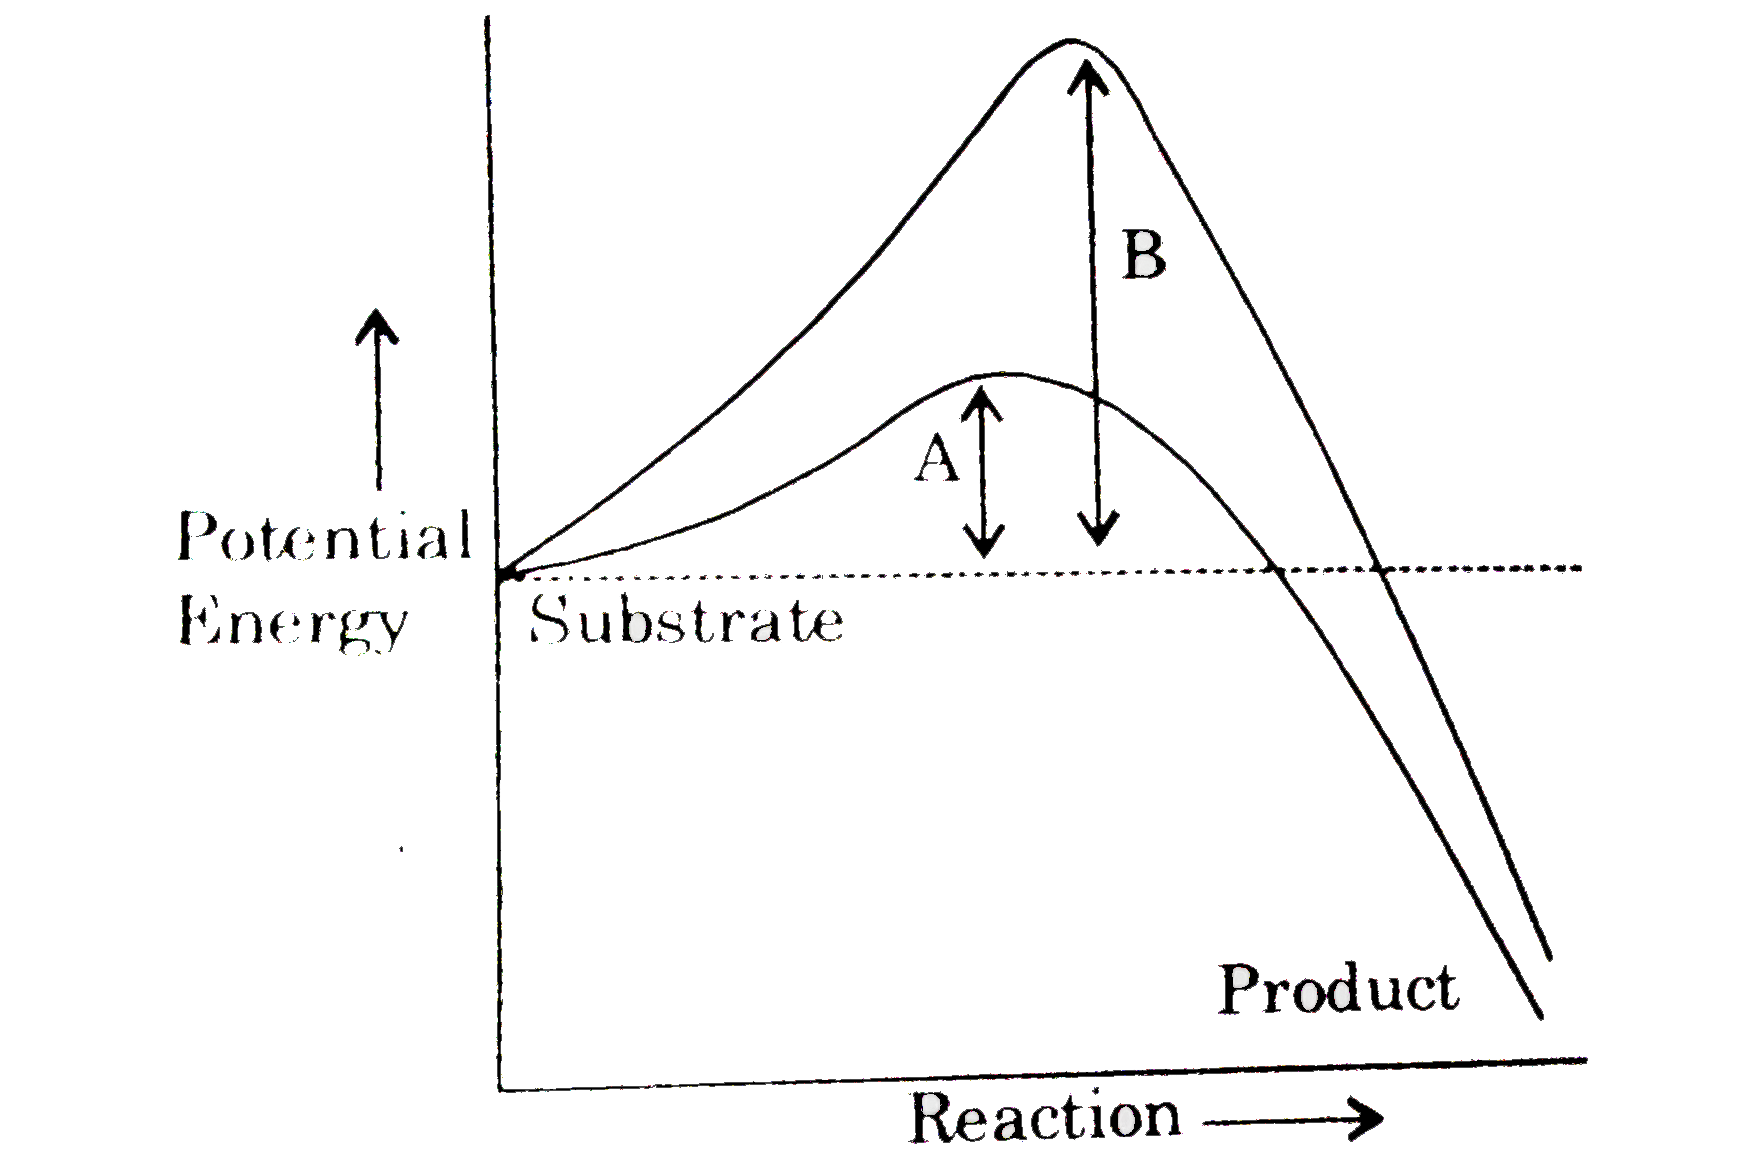
Which of the following describes the given graph correctly?
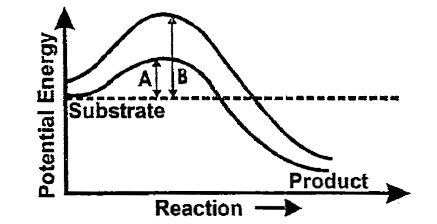 AEndothermic reaction with energy A in absence of enzyme and B in presence of enzymeBExothermic reaction with energy A in absence of enzyme and B in presence of enzymeCEndothermic reaction with energy A in presence of enzyme and B in absence of enzymeDExothermic reaction with energy A in presence of enzyme and B in absence of enzyme
Which of the following describes the given graph correctly?
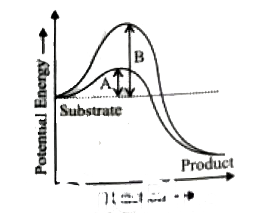 AEndothermic reaction with energy A in absence of enzyme and B in presence of enzymeBExothermic reaction with energy A in abserce of enryme and B in presence of enzymeCEndothermic reaction with energy A in presethce of enzyme and B in absence of enzymeDExothermic reaction with energy A in presence of enzyme and B in absence of enzyme
Heat given (H) to a substance was plotted against rise in temperature (θ). Which of the following parts of the graph (Fig. 6.3), most correctly depicts the latent heat of the substance?
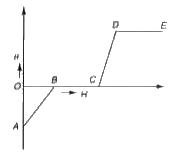 AABBBC onlyCCDDBC and DE
on heating substance of the following physical quantities change(s)?
View SolutionWhich one decribes the given graph correctly
View SolutionWhich of the following graphs best depicts the changes in one cycle of PCR ?
View Solution100 g of ice at −15∘C was heated. The rise in temperature of ice was plotted against the heat given to ice. Which of the following graphs (Fig. 6.2) correctly depicts this behaviour?
View SolutionWhich of the following graphs correctly depicts the rate of photosynthesis of sun plant (P) and shade plant (Q)?
View Solution
