The graph of Fig. shows the variation of photoelectric current with collector plate potential for different frequencies of incident radiations.
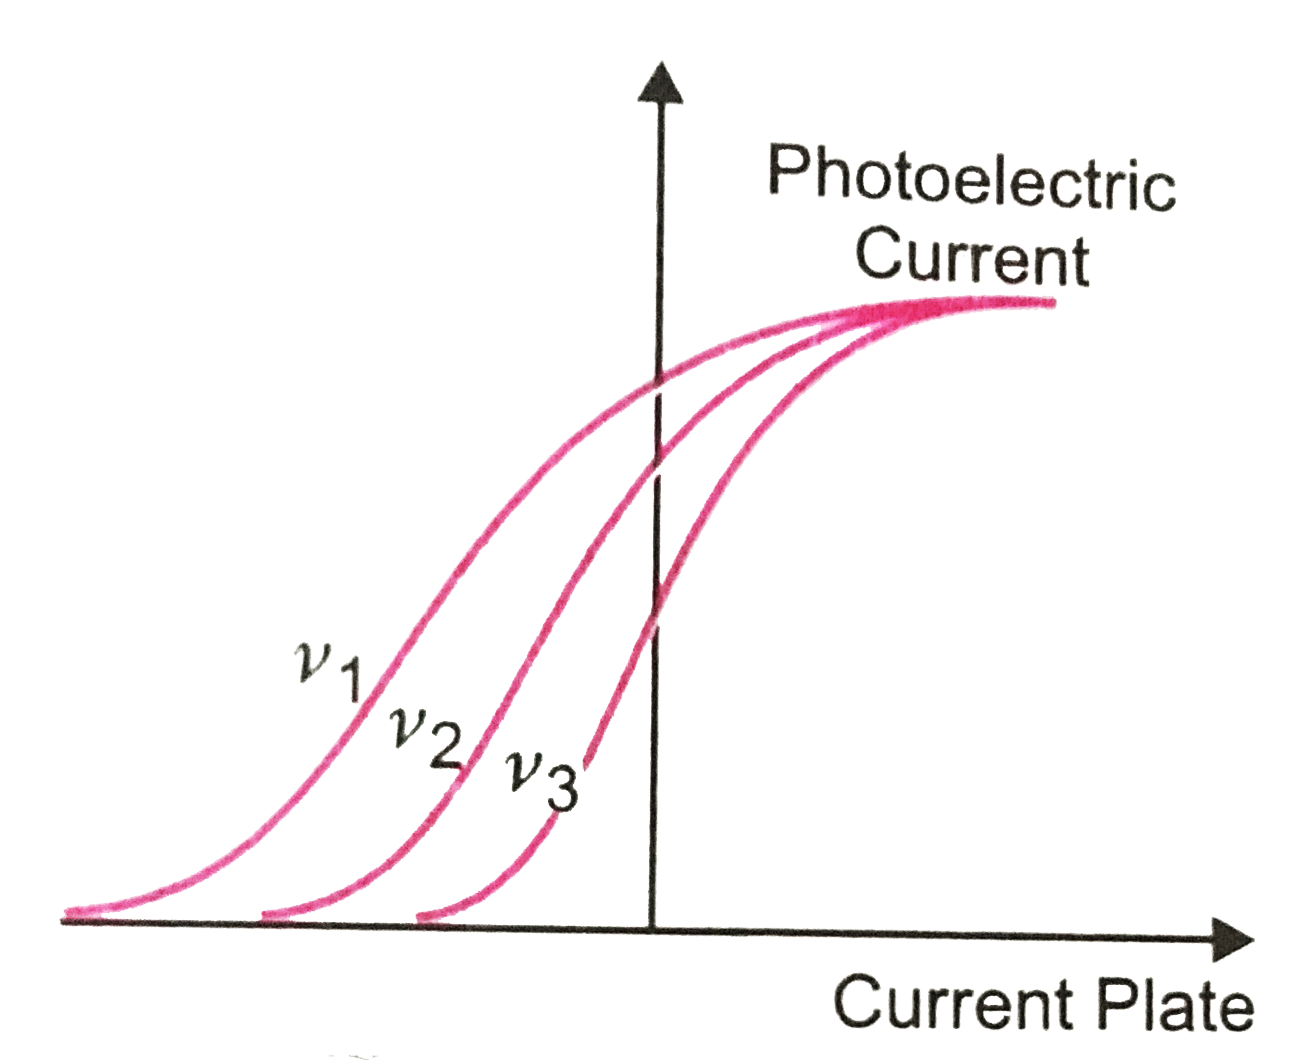
(i) Which physical parameter is kept constant for the three curves?
(ii) Which frequency (v1,v2orv3) is the highest?
(i) Since the saturation current is same for all the three curves, so the intensity of the incident radiation is same for all the three radiation.
(ii) From graph, the value of stopping potential is highest for the radiation of frequency v1, so the frequency v1 is highest.
Topper's Solved these Questions
- DUAL NATURE OF RADIATION AND MATTERBOOK - PRADEEPCHAPTER - DUAL NATURE OF RADIATION AND MATTEREXERCISE - NCERT Exerciese question
1 Videos
- DUAL NATURE OF RADIATION AND MATTERBOOK - PRADEEPCHAPTER - DUAL NATURE OF RADIATION AND MATTEREXERCISE - Short answer
1 Videos
- CURRENT ELECTRICITYBOOK - PRADEEPCHAPTER - CURRENT ELECTRICITYEXERCISE - Problems for Practice (B)
2 Videos
- ELECTROMAGNETIC INDUCTION & ALTERNATING CURRENTBOOK - PRADEEPCHAPTER - ELECTROMAGNETIC INDUCTION & ALTERNATING CURRENTEXERCISE - Multiple Choice Questions
1 Videos
Similar Questions
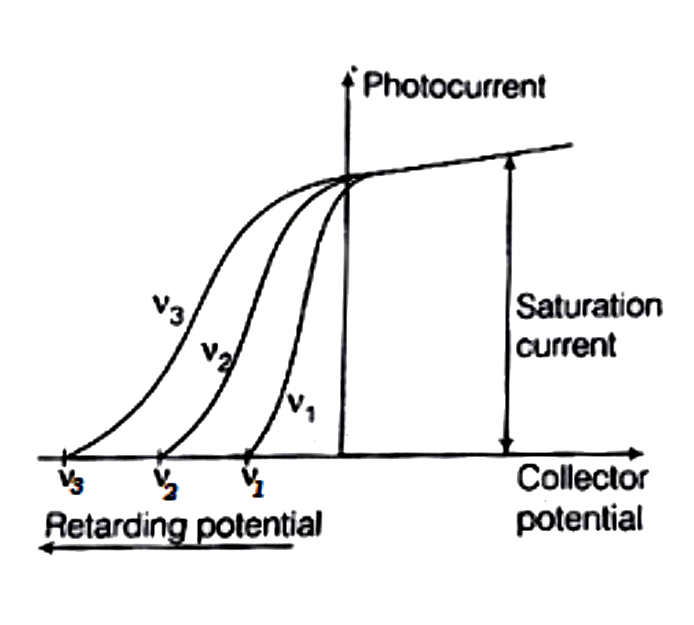
The variation of photocurrent with collector potential for different frequencies of incident radiation v1,v2,v3 is as shown in the the graph , then
View SolutionDraw a plot showing the variation of photoelectric current with collector plate potential for two different frequencies, v1>v2 of incident radiation having the same intensity. In which case will the stopping potential be higher? Justify your answer.
View Solution
Knowledge Check
In photoelectric effect , the curve between photoelectric current and anode potential V (for different frequencies ) is shown in figure , then
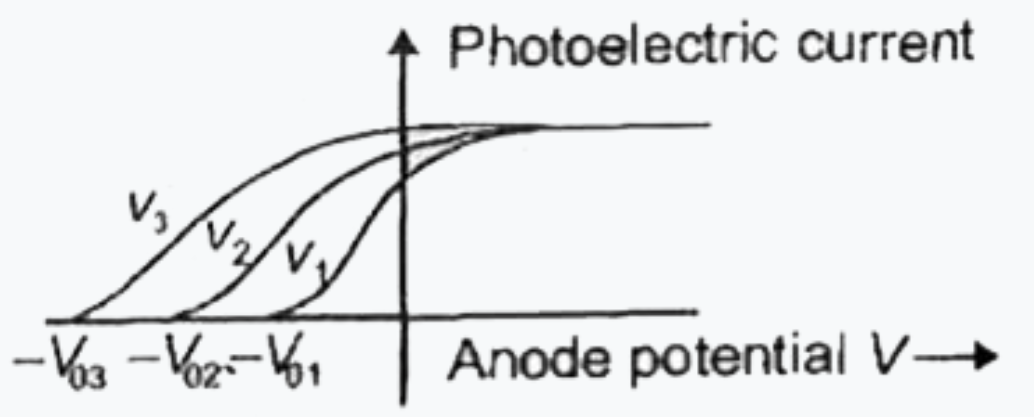 Av1>v2>v3Bv1<v2<v3Cv1=v2=v3Dv1>v2<v3
Which one of the following graphs in figure shows the variation of photoelectric current (I) with voltage (V) between the electrodes in a photoelectric cell?
A B
B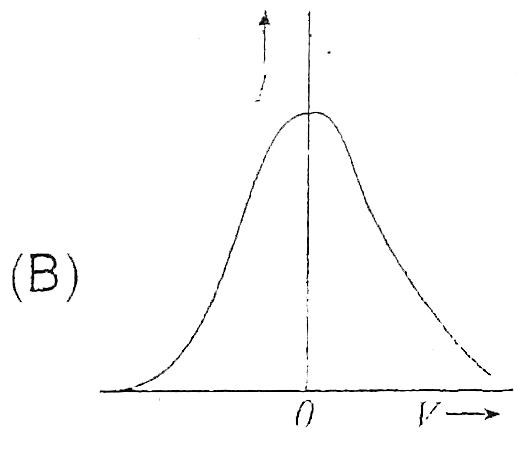 C
C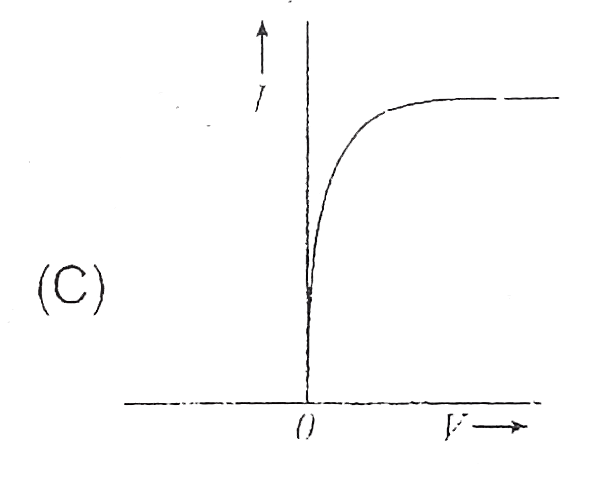 D
D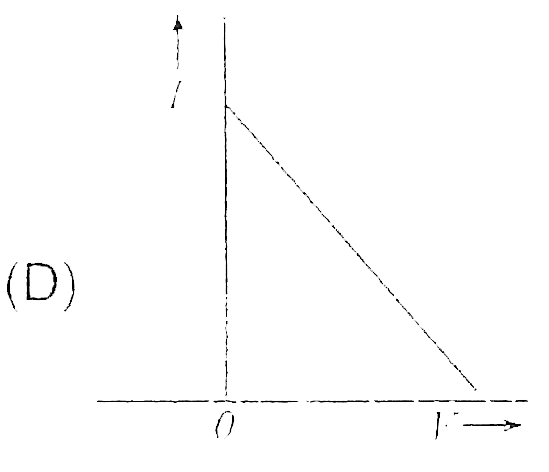
Draw a plot showing the variation of photoelectric current with collector plate potential for two different frequencies, v1>v2, of incident radiation having the same intensity. In which case will the stopping potential be higher ? Justify your answer.
View SolutionDraw a plot showing the variation of photoelectric current with collector plate potential for two different frequenciesv1andv2(v1>v2) of incident radiation having the same intensity. In which case will the stopping potential be higher? Justify your answer.
View SolutionDraw suitable graphs to show the variation of photoelectric current with collector plate potential for
(i) a fixed frequency but different intensities I1>I2>I3 of radiation.
(ii) a fixed intensity but different frequencies v1>v2>v3 of radiation.
View SolutionThe graph of Fig. shows the variation of photoelectric current (I) versus applied voltage (V) for the two different photosensitive materials for two different intensities of the incident radiation. Identify the pairs of curves that correspond to different materials but same intensity of incident radiation.
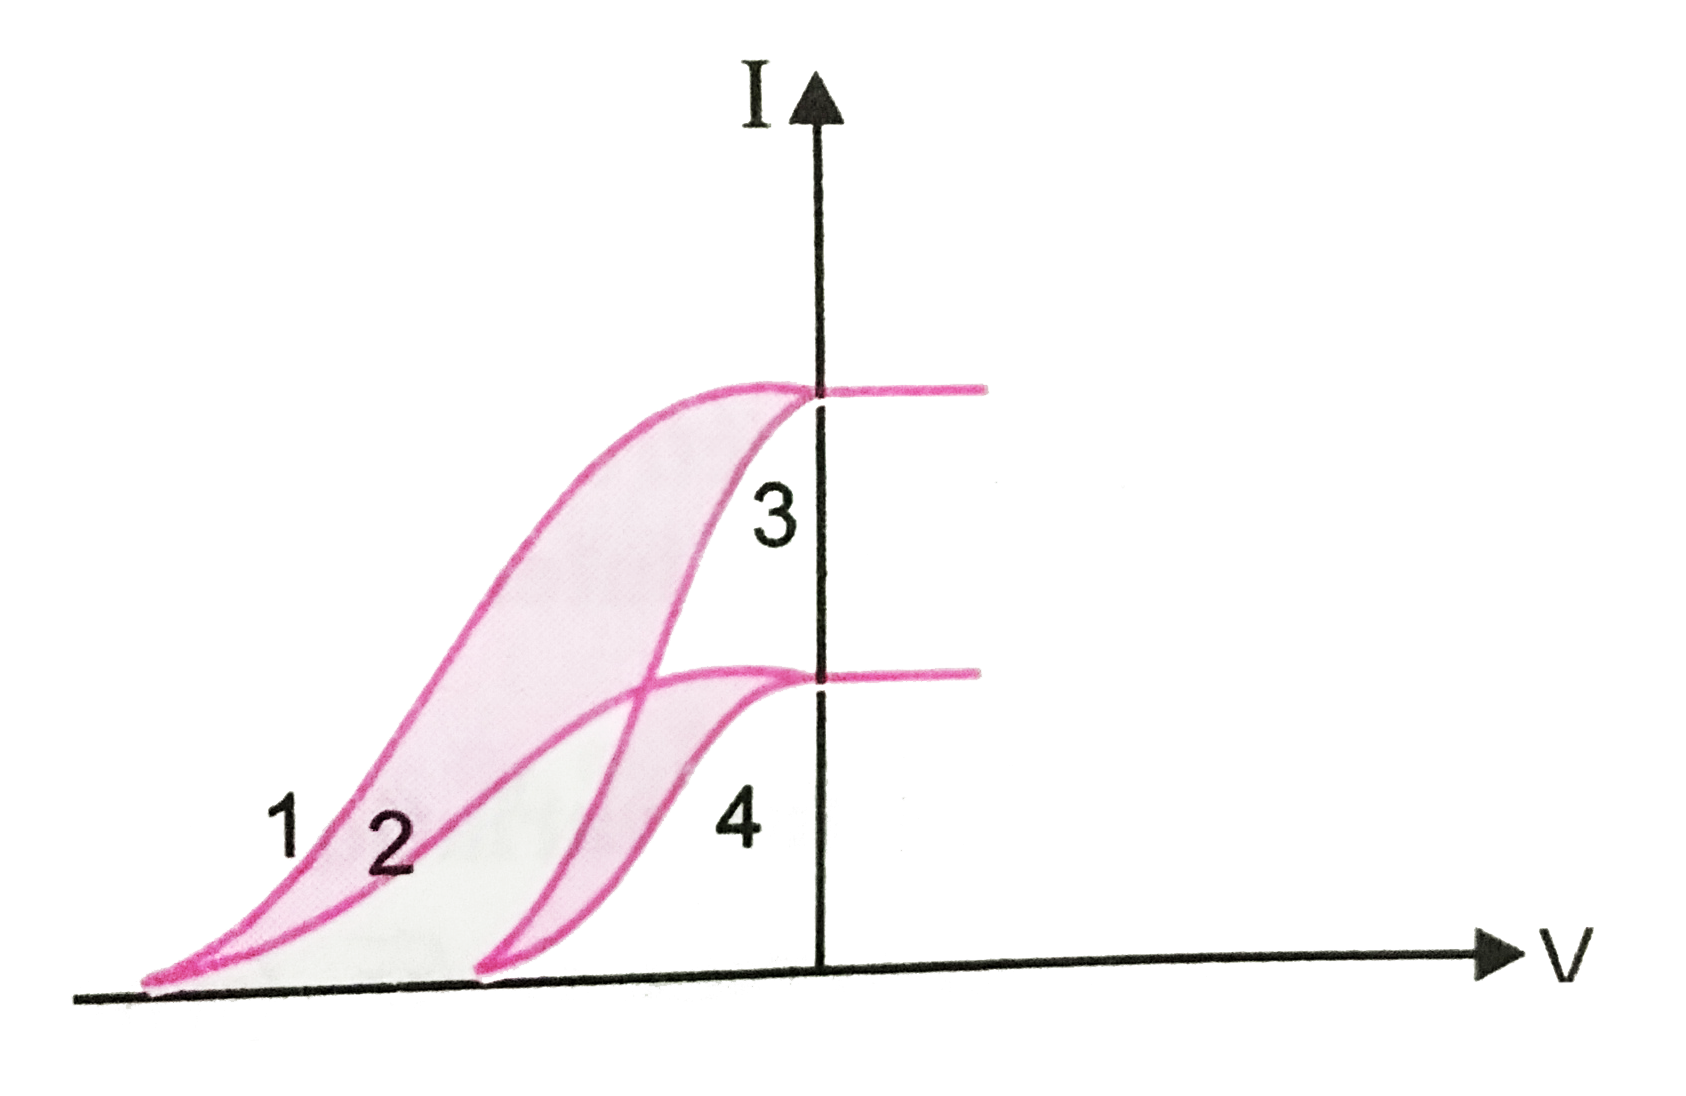
View SolutionDefine photoelectric effect. Draw a graph to show the variation of stopping potential with frequency of incident radiation on a metal plate.
View SolutionDraw graphs showing variation of photoelectric current with applied voltage for three incident radiations of equal frequency and different intensities. Mark the graph for the radiation of higher intensity.
View Solution
