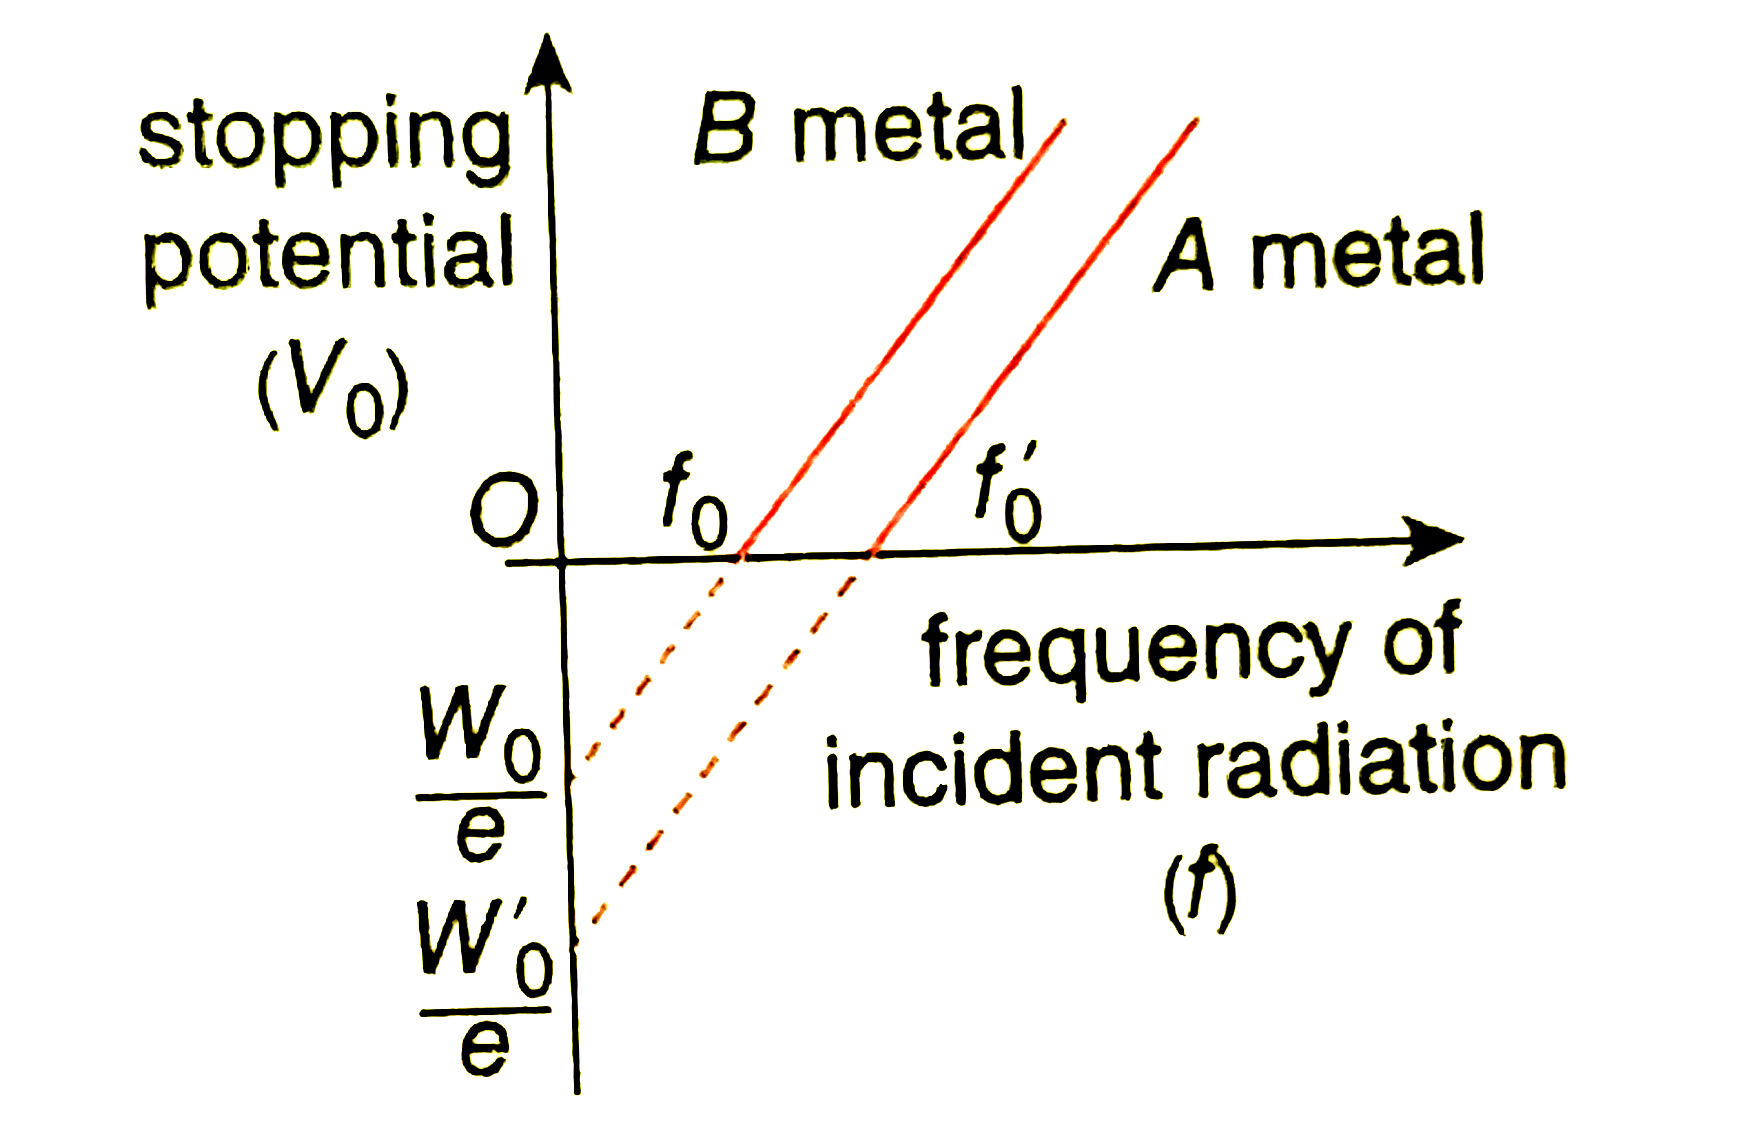
The graph shows the variation of stopping potential with frequency of incident radiation for two photosensitive metal A and B. Which one of the two has higher value of work function? Justify your answer.

For metal A, W'0=hf'0, For metal B, W0=hf0
As f'0>f0 ∴W'0>W0
So, work function for metal A is greater than that of metal B
Topper's Solved these Questions
- QUANTUM THEORYBOOK - CHHAYA PUBLICATIONCHAPTER - QUANTUM THEORYEXERCISE - Examination Archive with solutions
39 Videos
- OPTICAL INSTRUMENTSBOOK - CHHAYA PUBLICATIONCHAPTER - OPTICAL INSTRUMENTSEXERCISE - CBSE SCANNER
8 Videos
- QUESTION PAPER OF NEET 2017BOOK - CHHAYA PUBLICATIONCHAPTER - QUESTION PAPER OF NEET 2017EXERCISE - QUESTION PAPERS OF (NEET) (2017)
39 Videos
Similar Questions
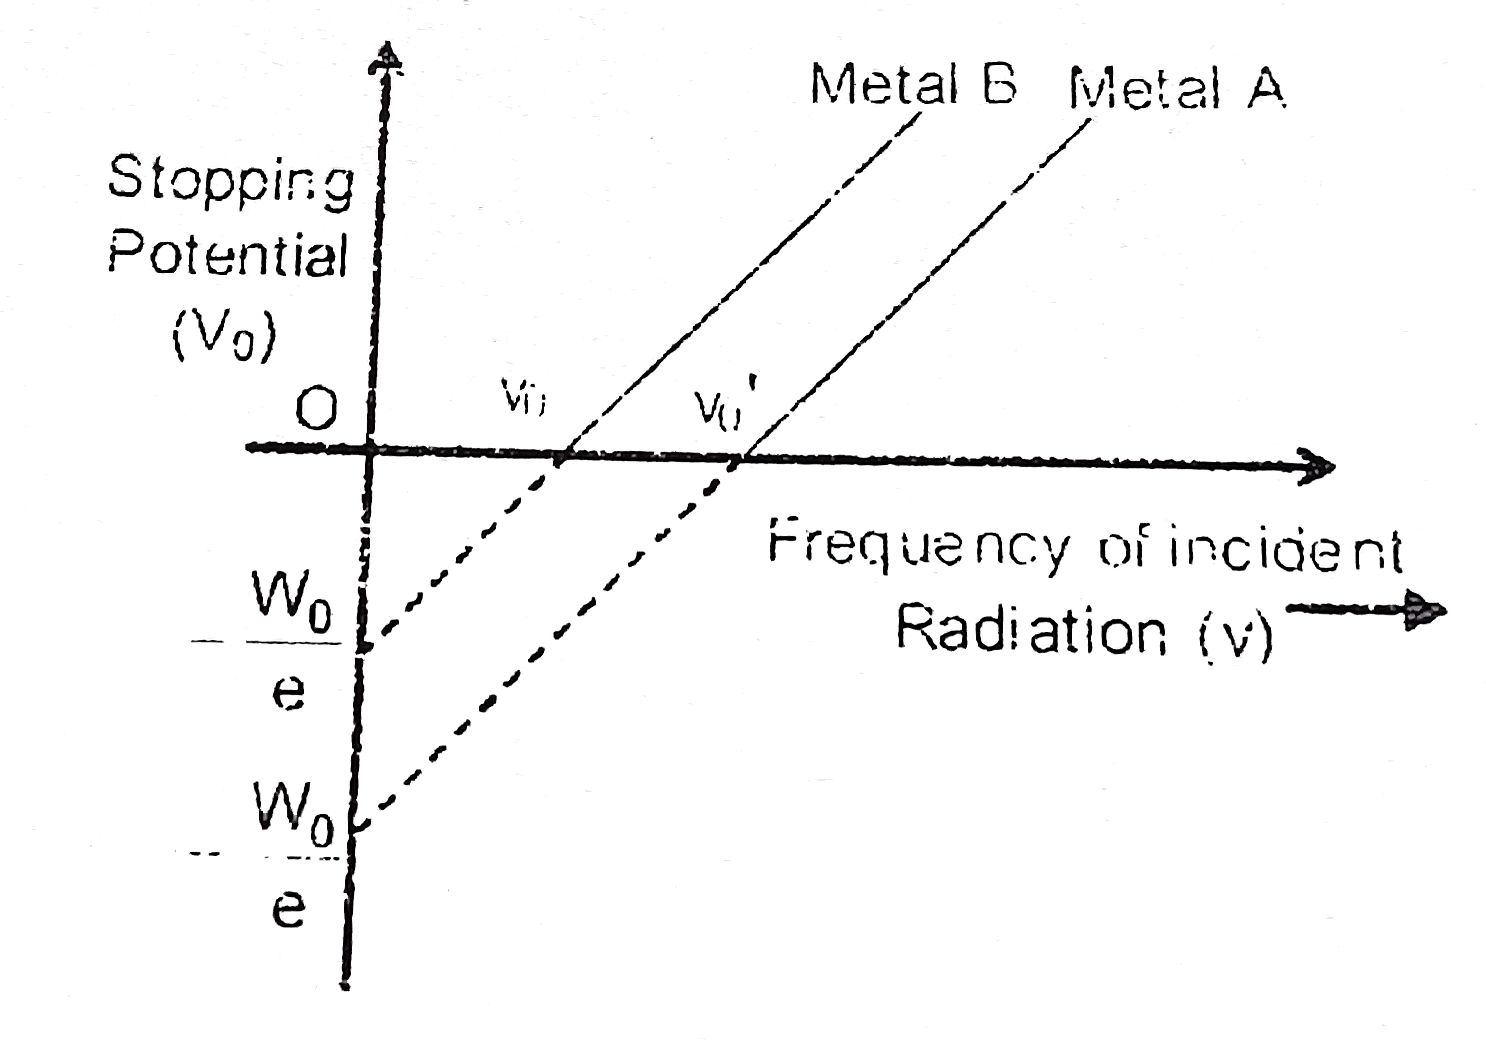
The graph shows variation of stopping potential V0 versus frequency of incident radiation v for two photosensitive metals A and B. Which of two metals has higher threshold frequency and why?

View SolutionThe graph shows variation of stopping potential V0 versus frequency of incident radiation v for two photosensitive metals A and B. Which of two metals has higher threshold frequency and why?

View Solution
Knowledge Check
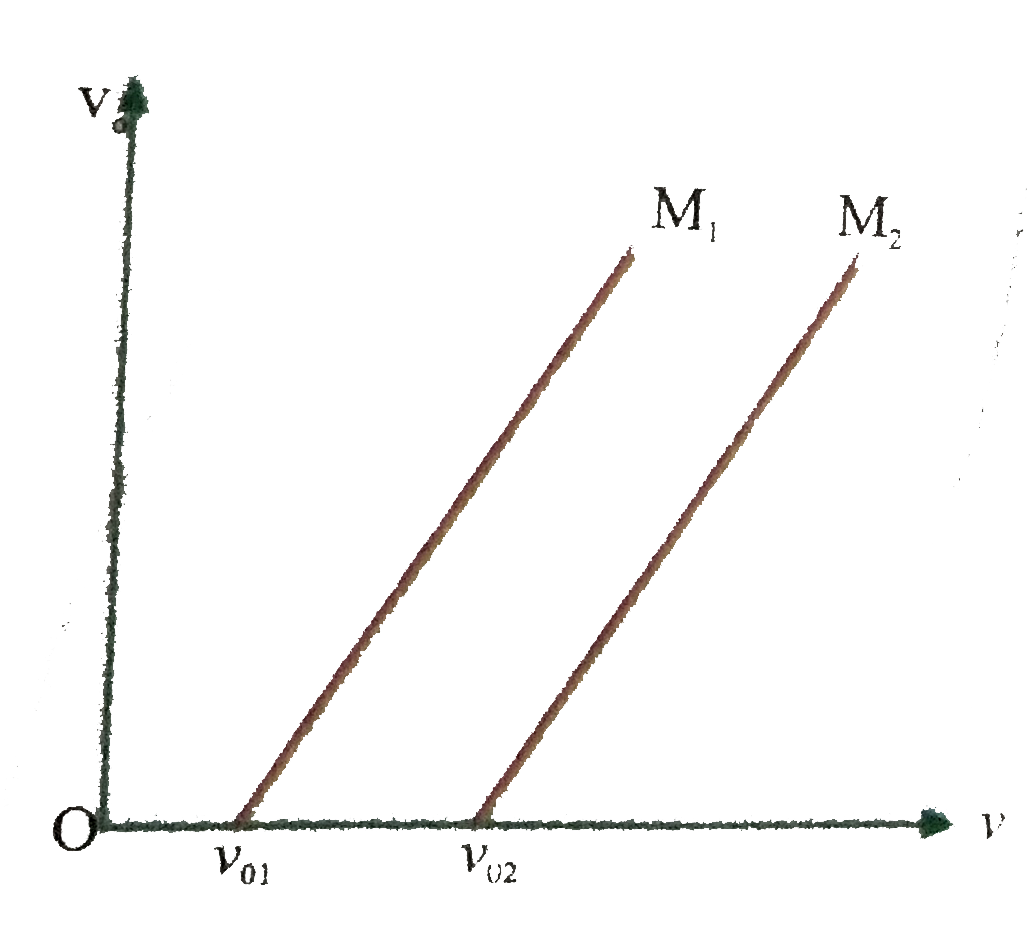
Figure show the variation of the stopping potential (V0) with the frequency (v) of the incident radiations for two different photosensitive matererial M1 and M2 What are the values of work functions for M1 and M2 respectively
 Ahv01,hv02Bhv02,hv01Chv01,hv01Dhv02,hv02
The figure shows the variation of stopping potential VQ with the frequency v of the incident radiations for two photosensitive metals P and
Which metal has smaller threshold wavelength ? Justify your answer.
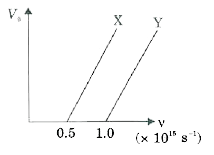
View SolutionThe following graph shows the variation of stopping potential V0 with the frequency v of the incident radiation for two photosensitive metals X and Y.
(i) Which metal has larger threshold wavelength ? Give reason.
(ii) Explain giving reason , which metal gives out electrons , having larger kinetic energy , for same wavelength of the incident radiation.
(iii) If the distance between the light source and metal X is halved , how will the kinetic energy of electrons emitted from it change ? Given reason.

View SolutionDraw and explain the graph showing the variation of stopping potential with frequency of incident radiation in relation to photoelectric effect.
View SolutionSketch the graphs, showing the variation of stopping potential Vs with frequency v of the incident radiations for two photosensitive materials A and B having threshold frequencies v0>v'0 respectively.
(i) which of the two metals A or B has higher work function?
(ii) What information do you get from the slope of the graphs?
(iii) What does the value of the intercept of graph A on the potential axis represent?
View SolutionThe slope of the graph drawn between stopping potential and frequency of incident radiation will be
View SolutionSketch the graphs showing variation of stopping potential with frequency of incident radiations for two photosensitive materials A and B having threshold frequencies vA>vB.
(i) In which case is the stopping materials A and B having threshold frequencies vA>VB.
(i) In which case is the stopping potential more and why?
(ii) Does the slope of the graph depend on the nature of the materials used ? Explain.
View Solution
