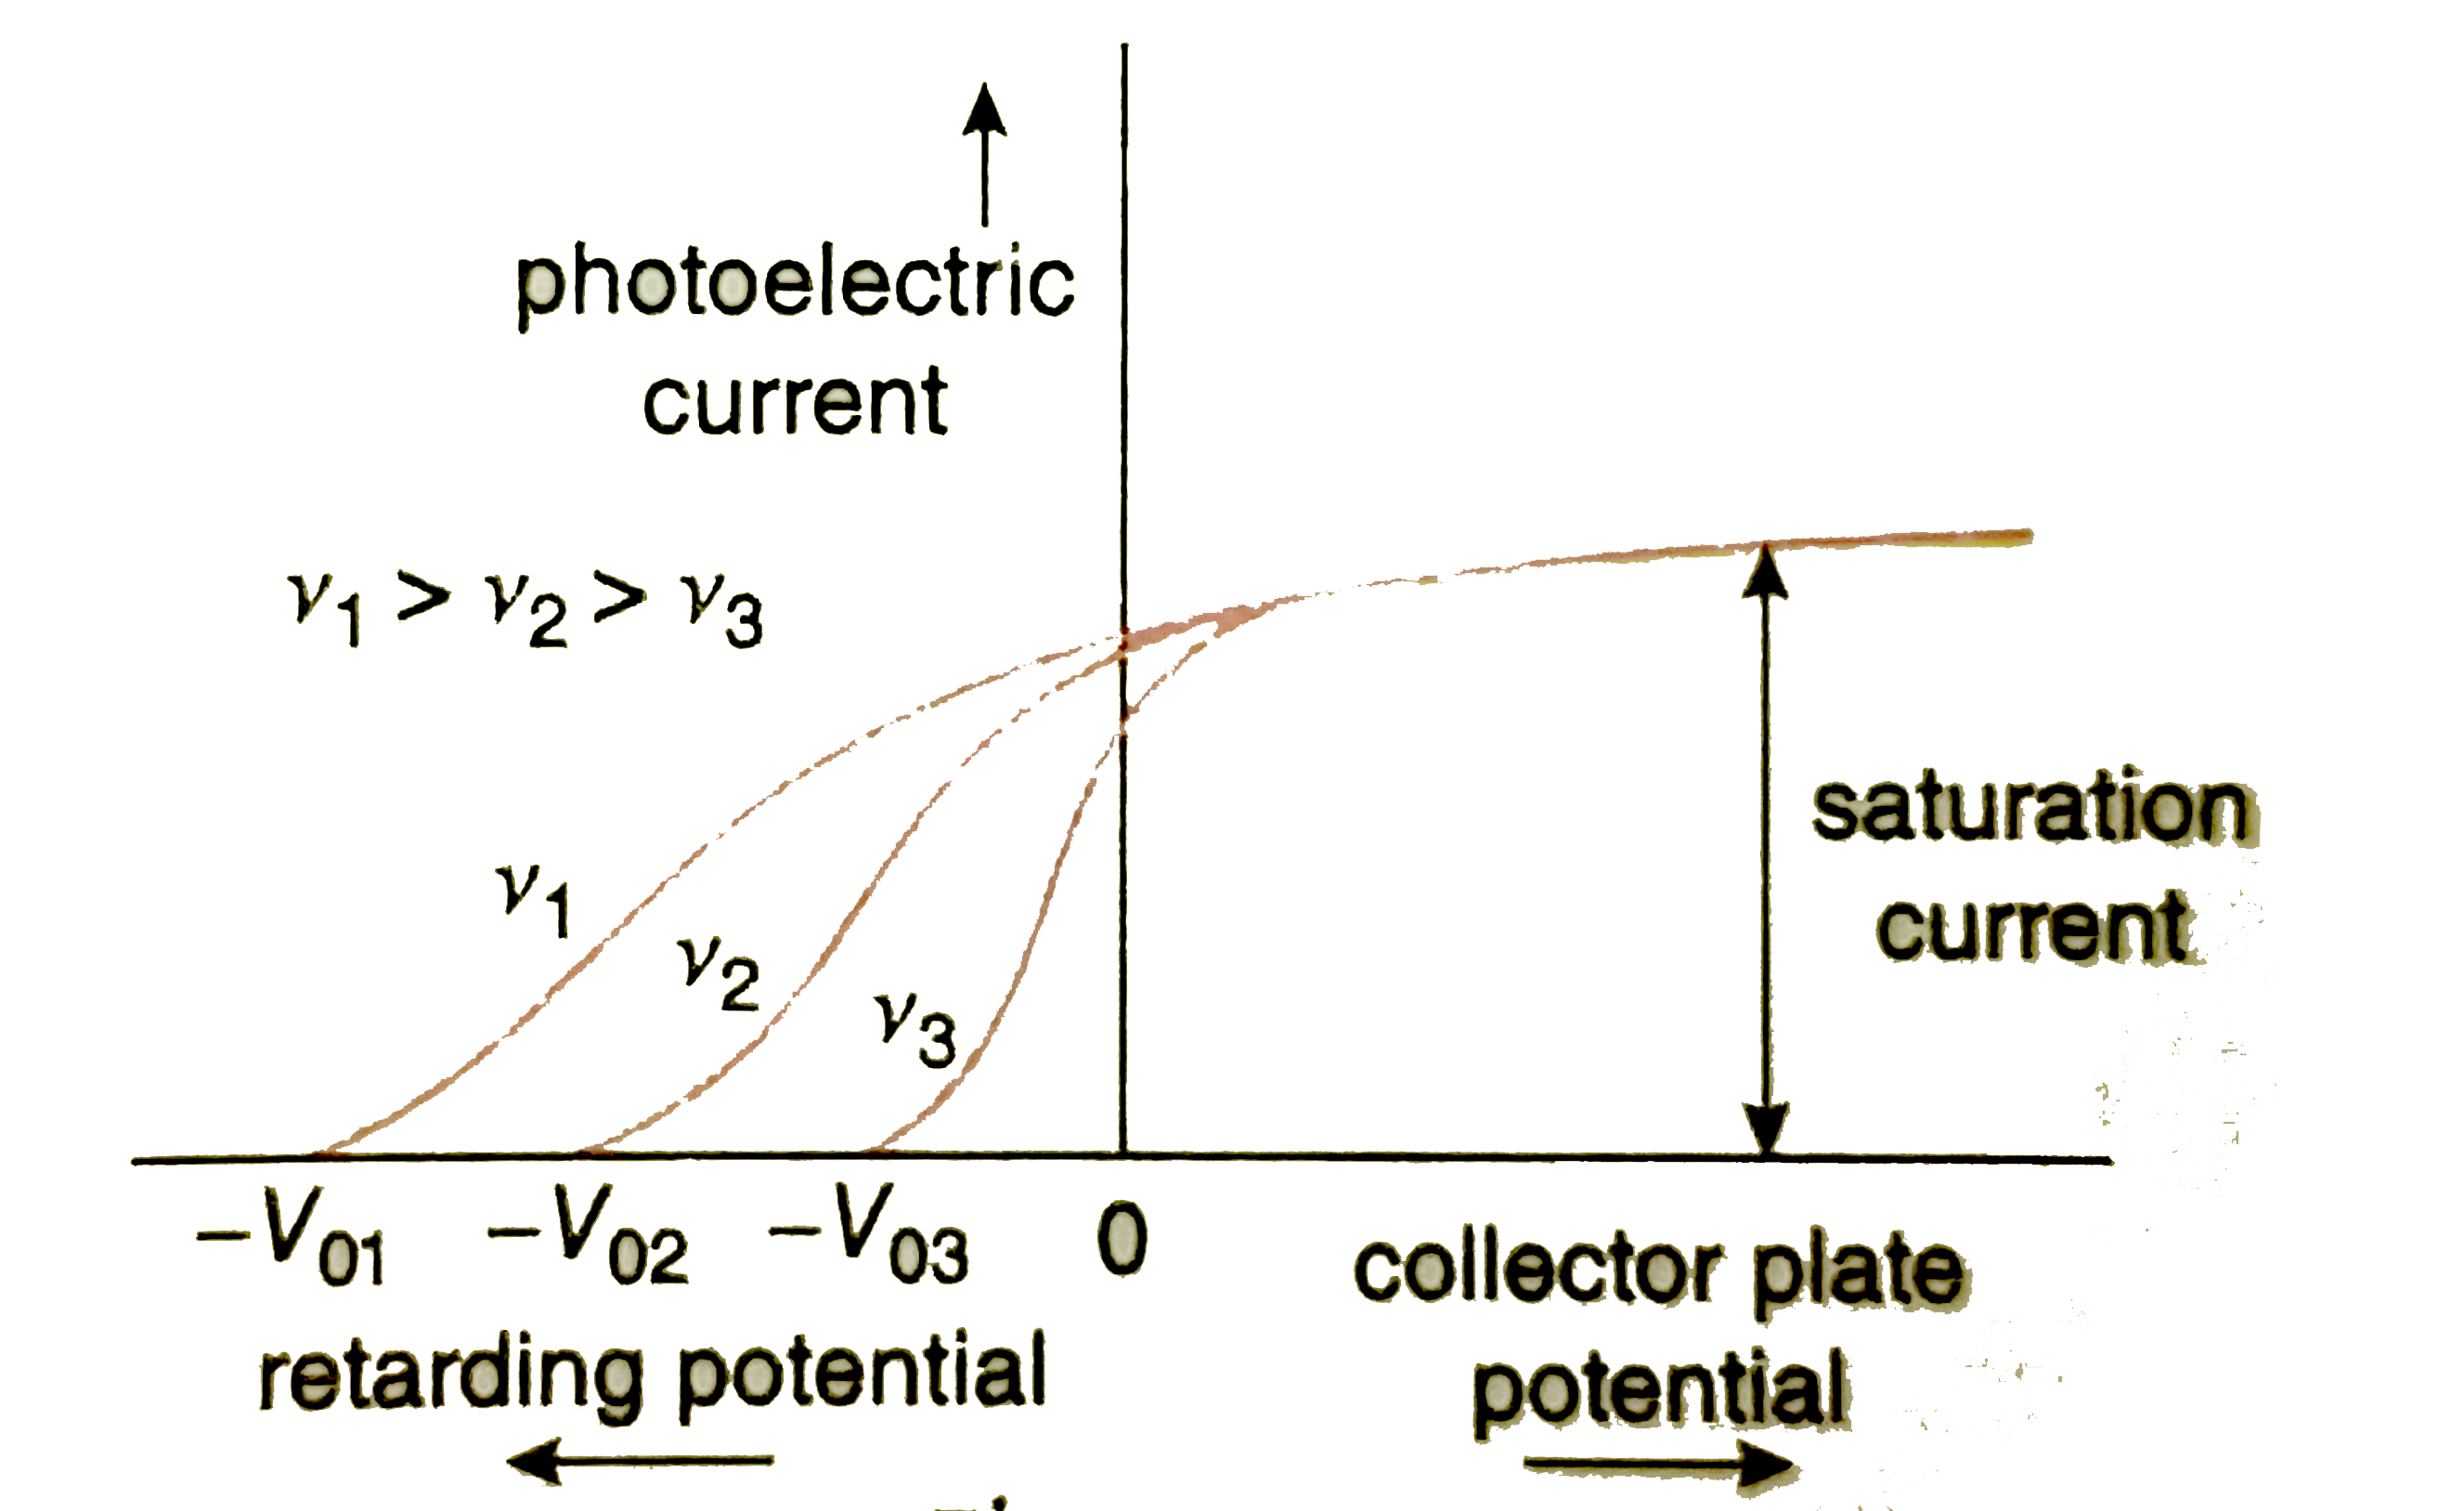
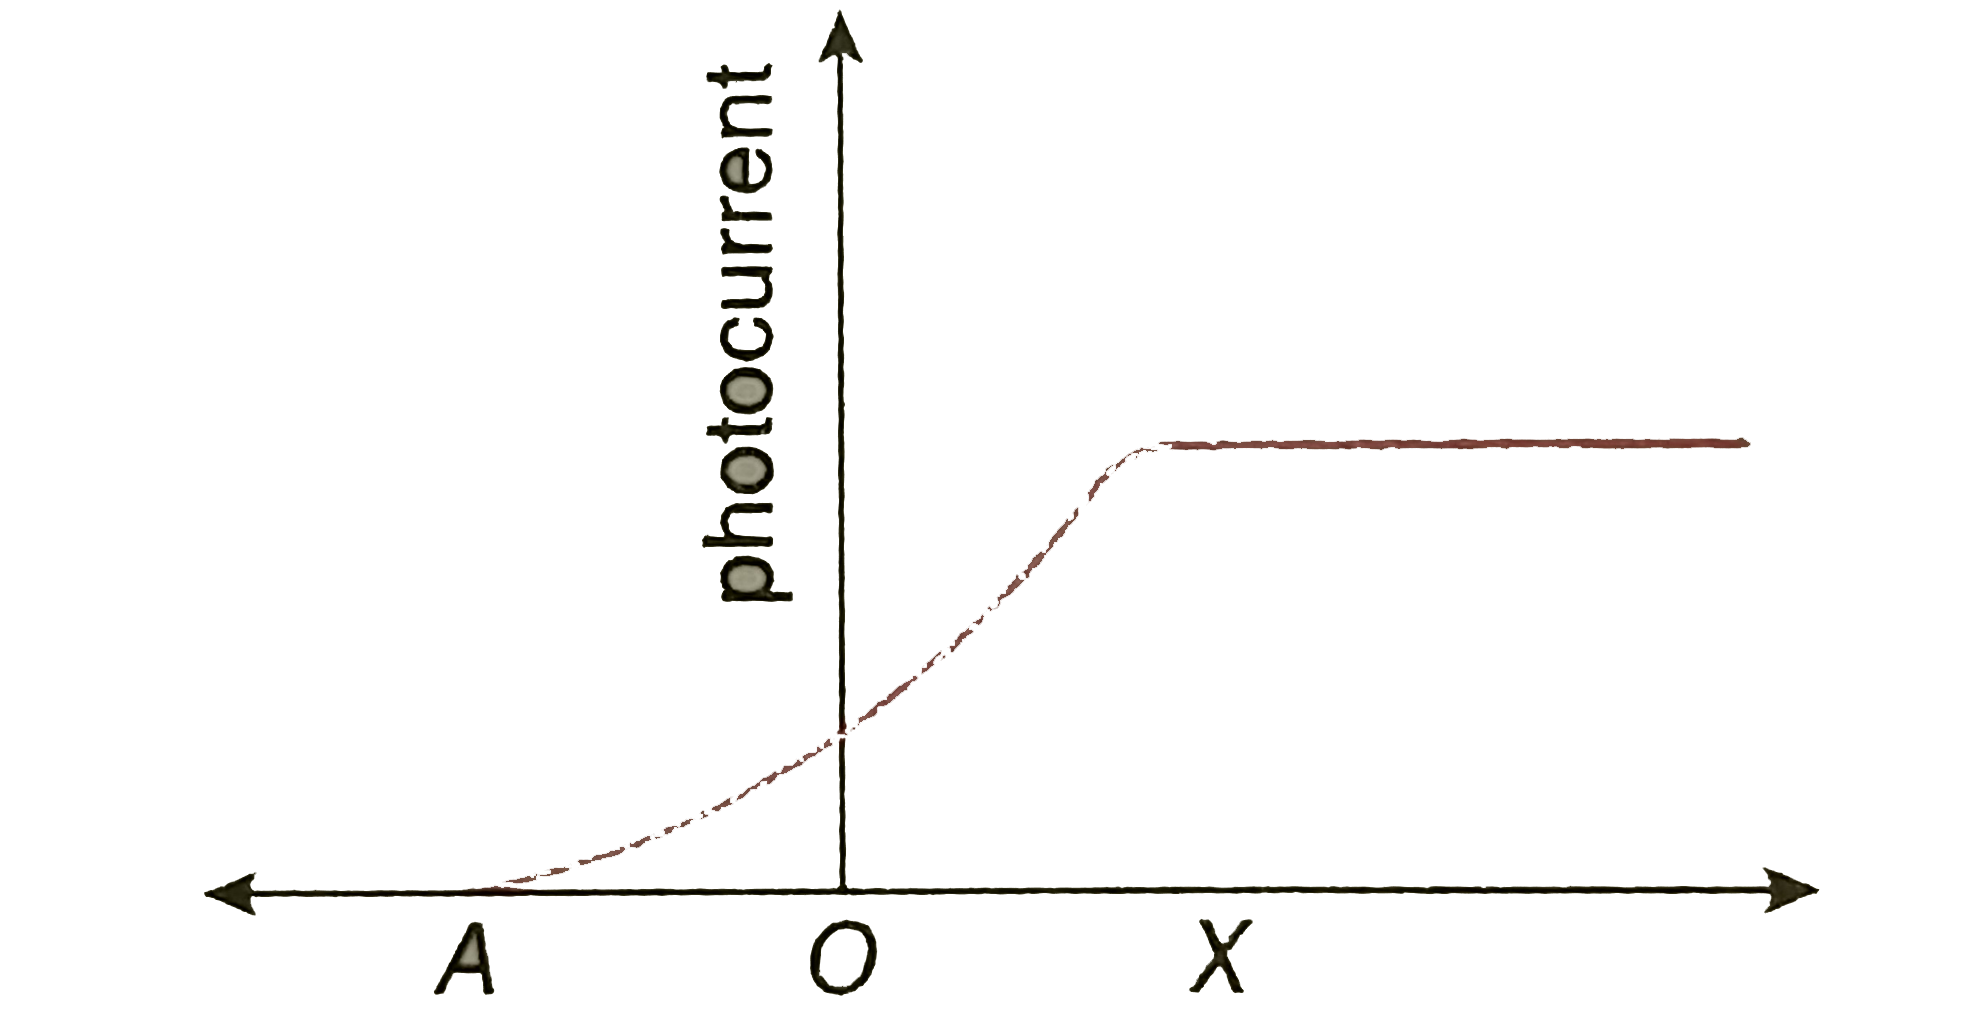
The following graph shows the variation of photocurrent for a photosensitive metal:
Draw this graph for three different values of frequencies of incident radiation v1,v2andv3(v1>v2>v3) for same intensity.
Topper's Solved these Questions
- QUANTUM THEORYBOOK - CHHAYA PUBLICATIONCHAPTER - QUANTUM THEORYEXERCISE - Examination Archive with solutions
39 Videos
- OPTICAL INSTRUMENTSBOOK - CHHAYA PUBLICATIONCHAPTER - OPTICAL INSTRUMENTSEXERCISE - CBSE SCANNER
8 Videos
- QUESTION PAPER OF NEET 2017BOOK - CHHAYA PUBLICATIONCHAPTER - QUESTION PAPER OF NEET 2017EXERCISE - QUESTION PAPERS OF (NEET) (2017)
39 Videos
Similar Questions
The following graph shows the variation of photoelectric current for a photosensitive metal .
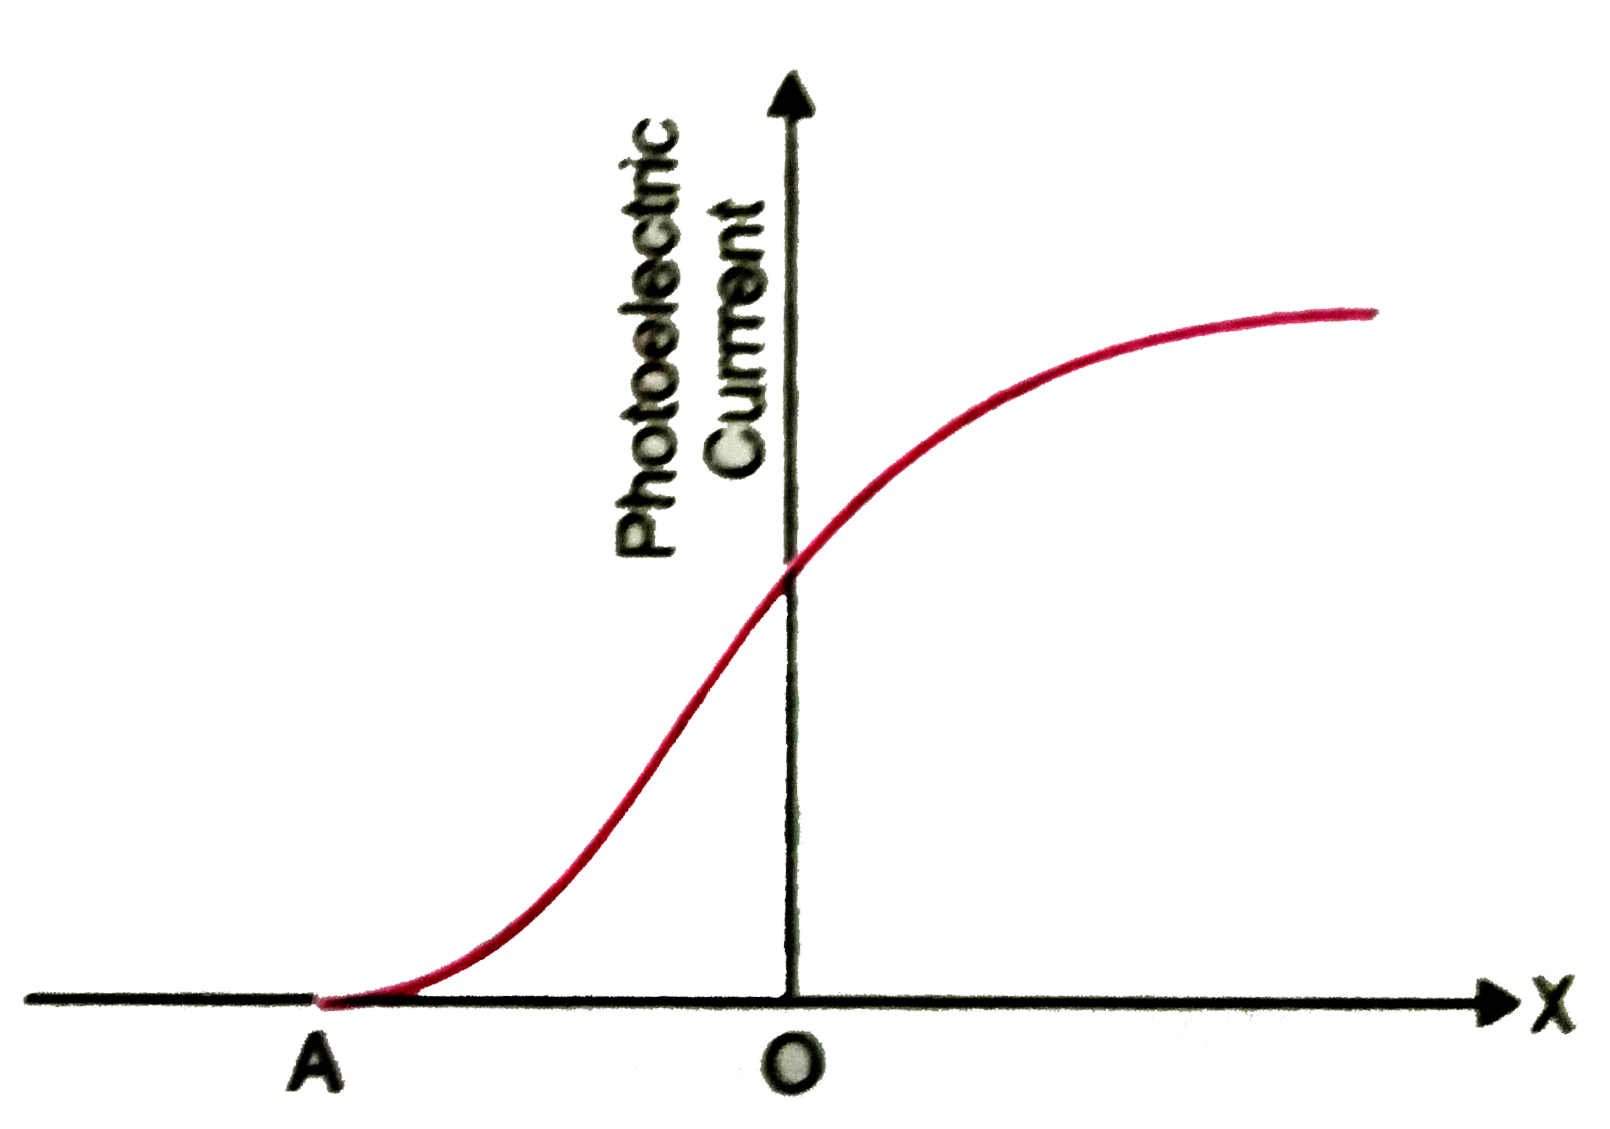
(a) Identify the variable X on the horizontal line.
(b) What does the point A on the horizontal axis represent?
(c) Draw this graph for three different values of frequencies of incident radiation v1,v2andv3(v1>v2>v3) for same intensity.
(d) Draw this graph for three different values of intensities of incident radiation I1,I2,I3(I1>I2>I3) having same frequency.
View SolutionThe variation of photocurrent with collector potential for different frequencies of incident radiation v1,v2,v3 is as shown in the the graph , then
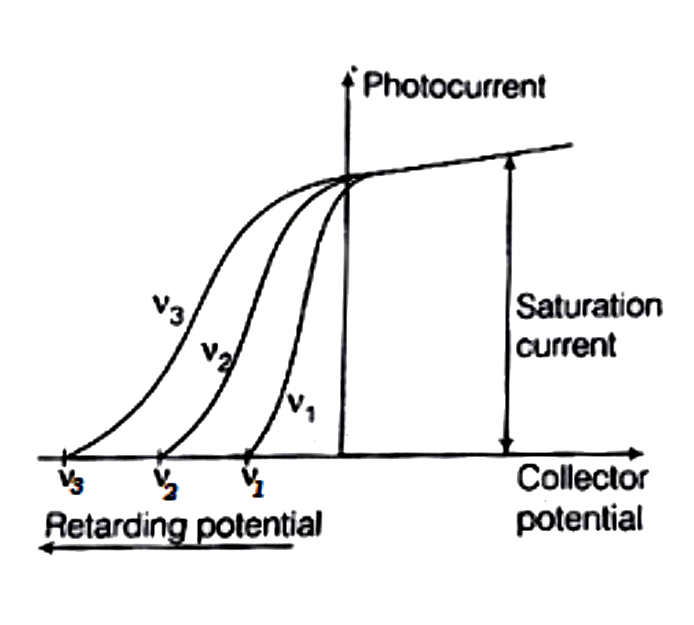
View SolutionThe variation of photocurrent with collector potential for different frequencies of incident radiation v1,v2,v3 is as shown in the the graph , then

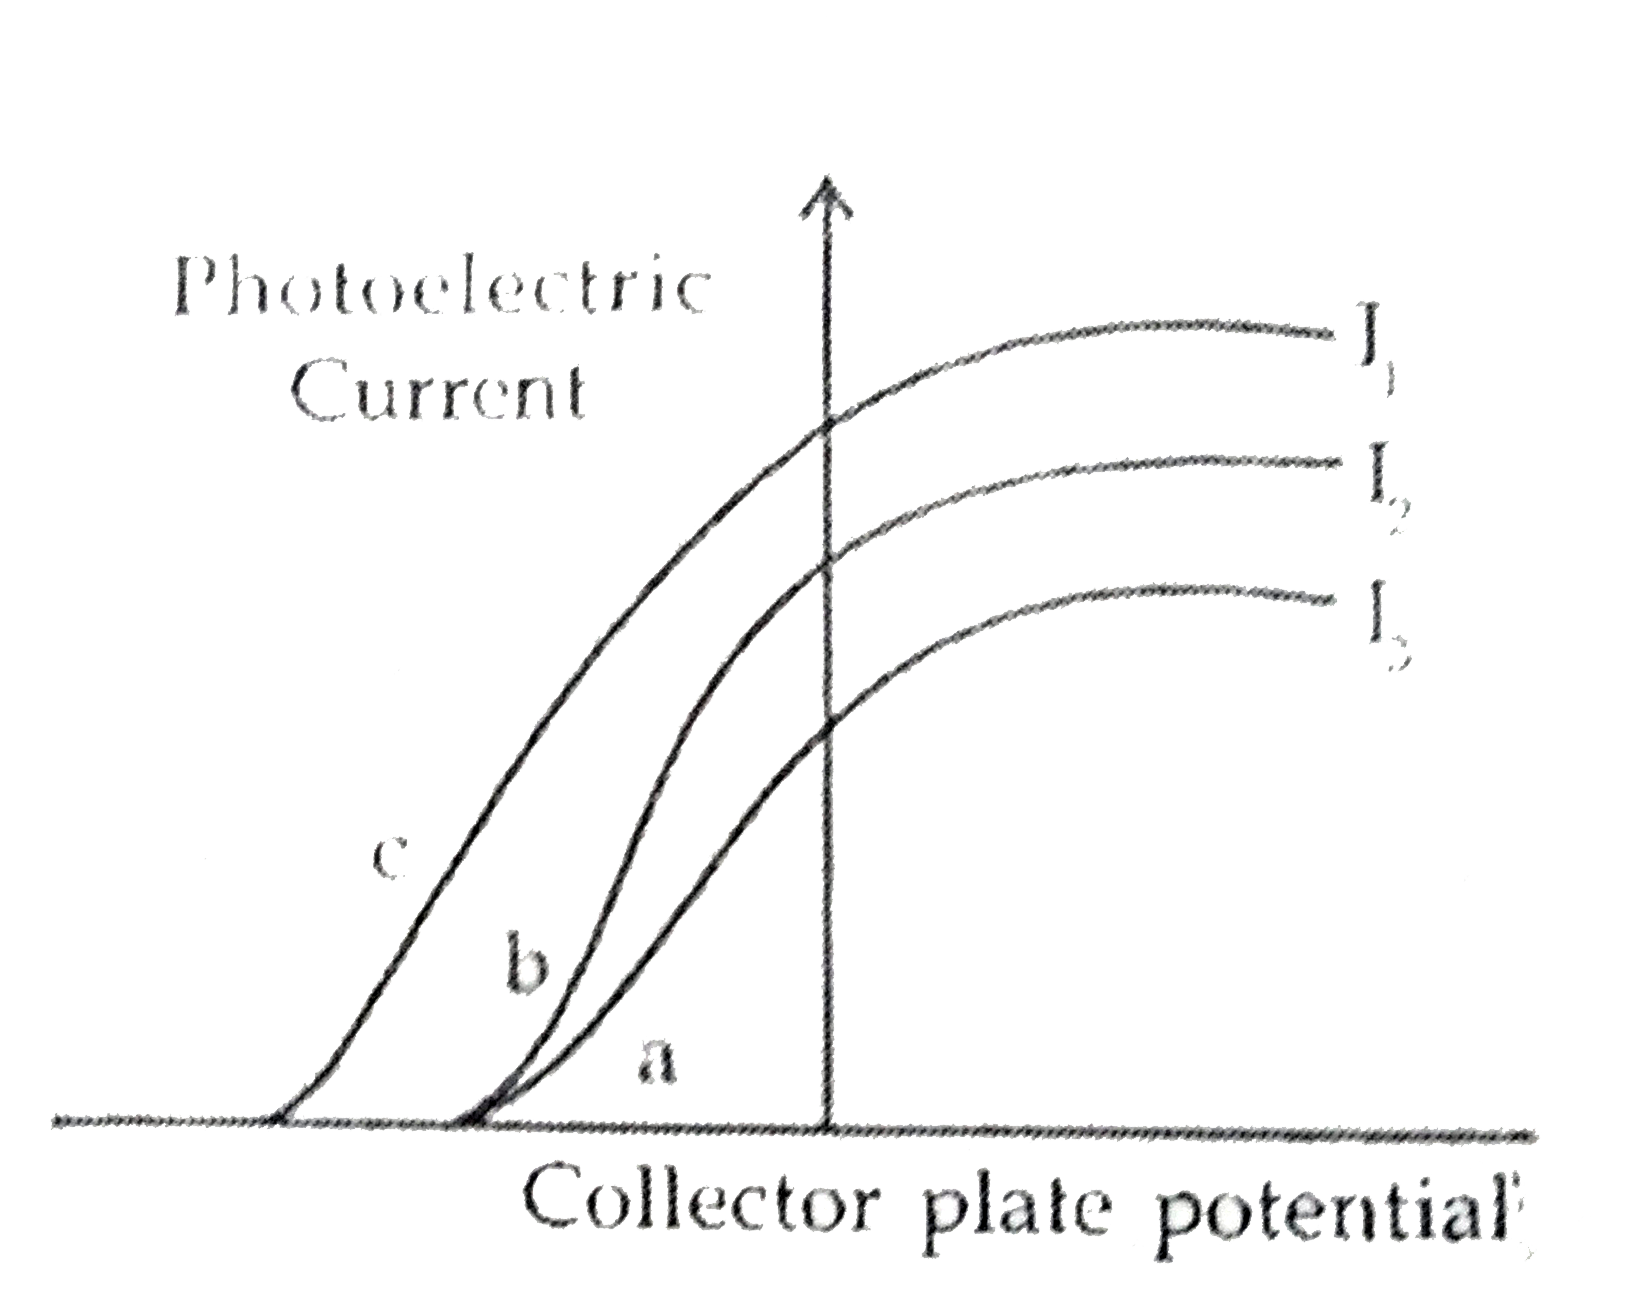
View SolutionThe figure shows a plot of three curves a, b, c, showing variation of photocurrent vs collector plate potential for three different intensities I1,I2andI3 having frequencies v1,v2andv3 respectively incident on a photosensitive surface.
Point out the two curves for which the incident radioations have same frequency but different intensities.
View SolutionThe graph of Fig. shows the variation of photoelectric current with collector plate potential for different frequencies of incident radiations.
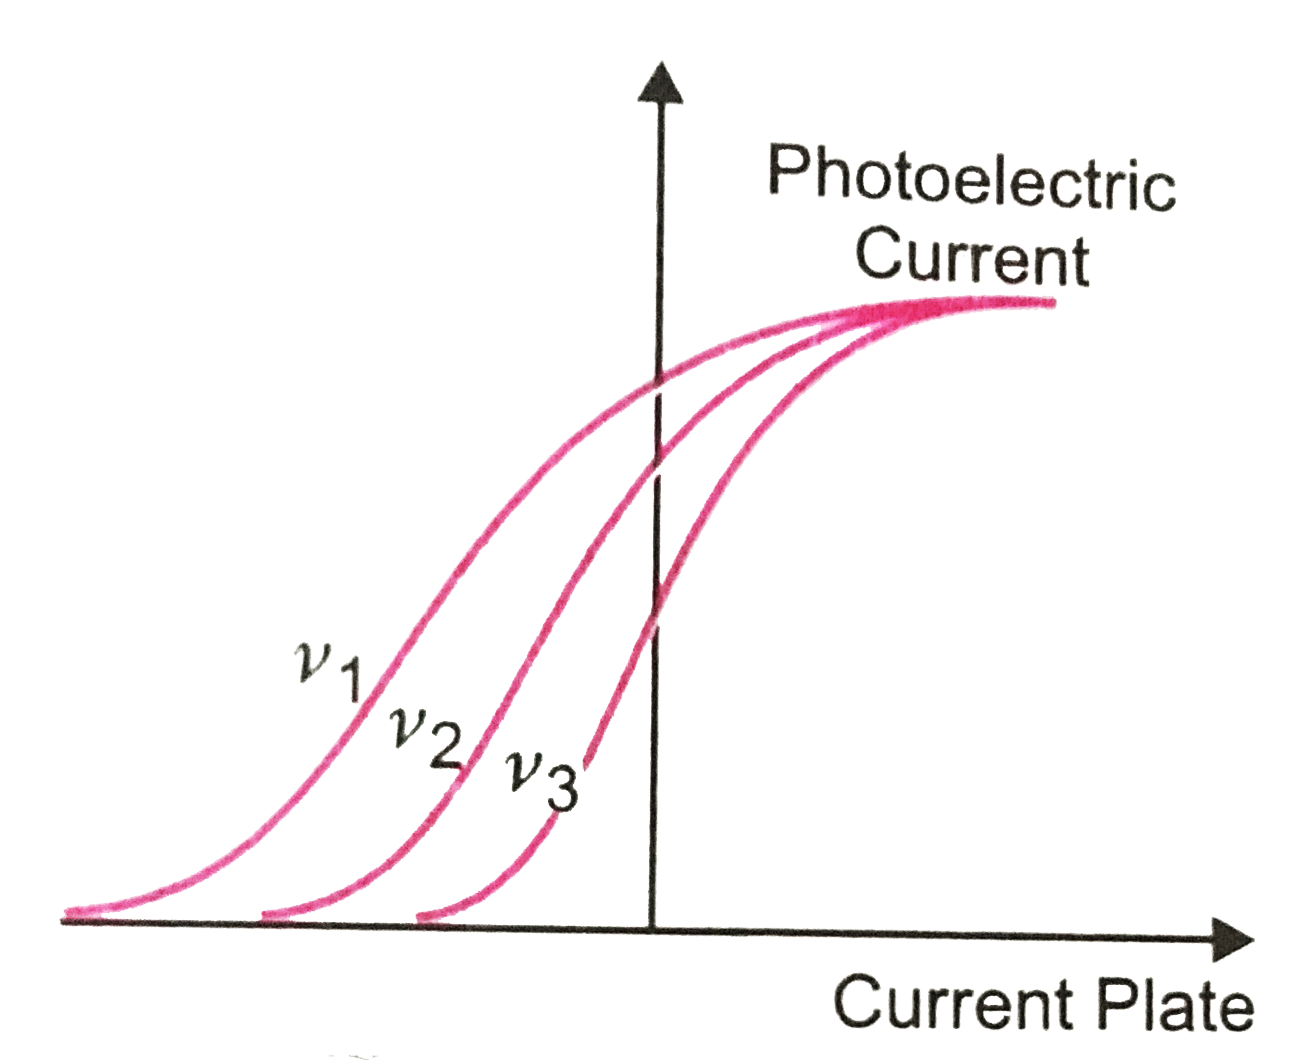
(i) Which physical parameter is kept constant for the three curves?
(ii) Which frequency (v1,v2orv3) is the highest?
View SolutionDraw suitable graphs to show the variation of photoelectric current with collector plate potential for
(i) a fixed frequency but different intensities I1>I2>I3 of radiation.
(ii) a fixed intensity but different frequencies v1>v2>v3 of radiation.
View SolutionDraw a plot showing the variation of photoelectric current with collector plate potential for two different frequencies, v1>v2, of incident radiation having the same intensity. In which case will the stopping potential be higher ? Justify your answer.
View SolutionDraw a plot showing the variation of photoelectric current with collector plate potential for two different frequenciesv1andv2(v1>v2) of incident radiation having the same intensity. In which case will the stopping potential be higher? Justify your answer.
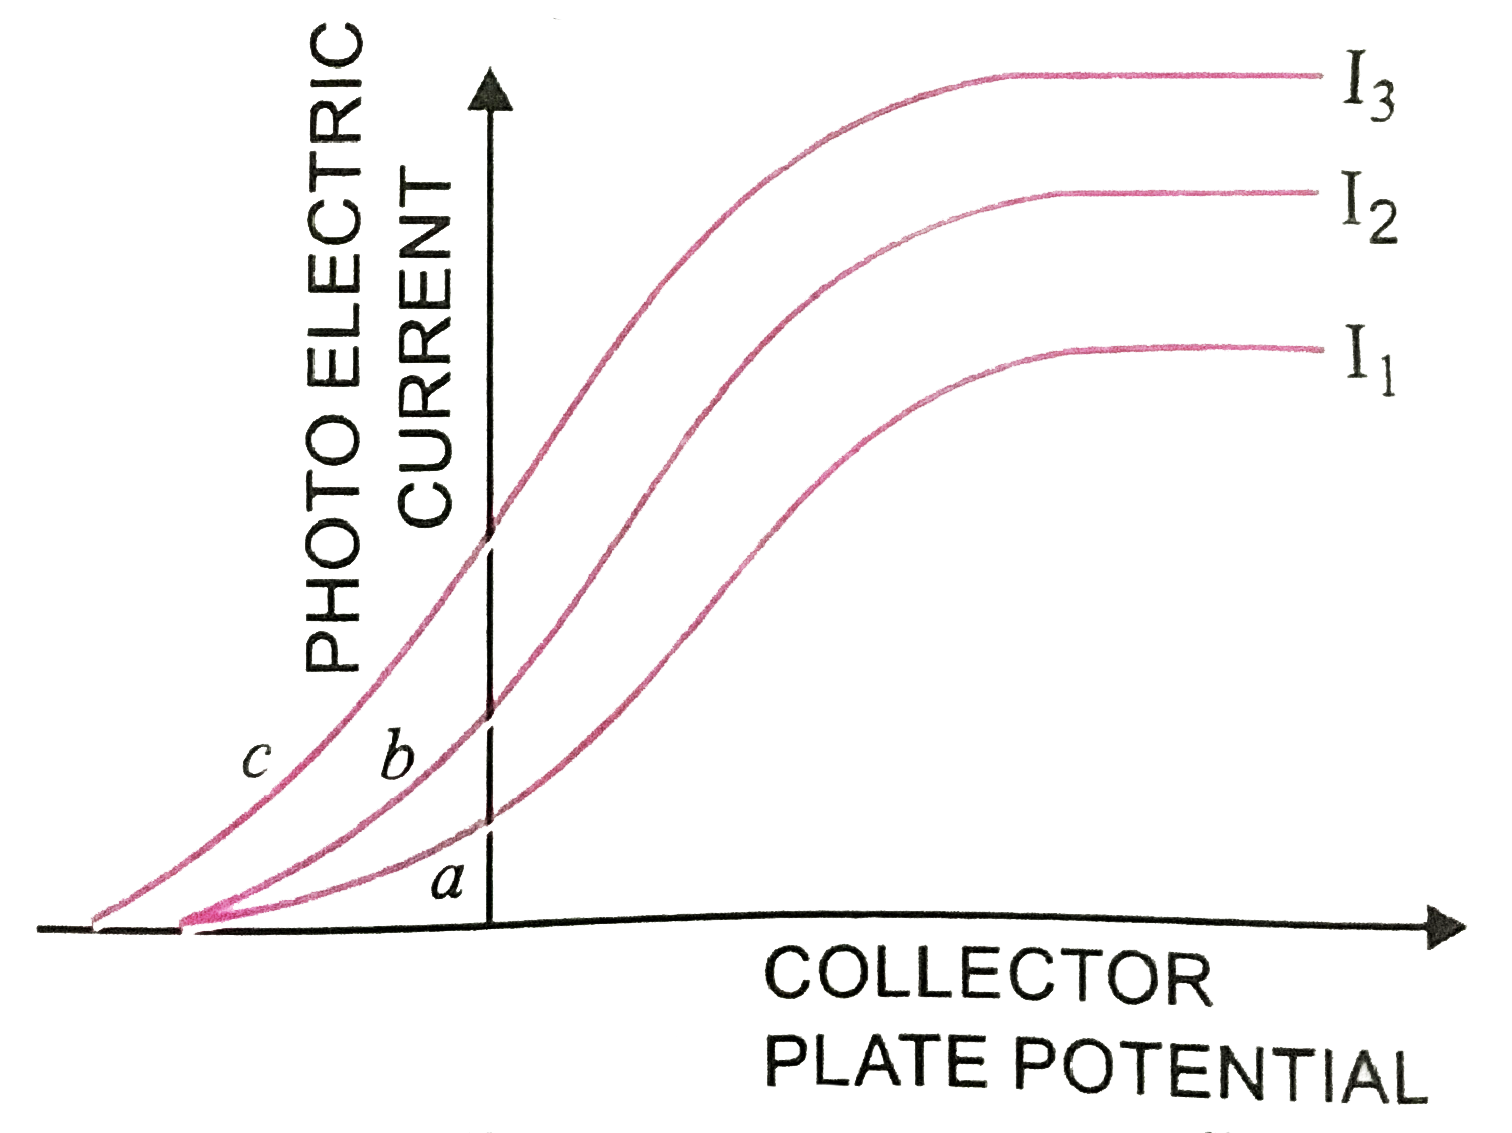
View SolutionThe Fig shows a plot of three curves a, b, c showing the variation of photocurrent versis collector plate potential for the different intensities I1,I2andI3 having frequencies v1,v2andv3 respectively, incident on a photosensitive surface. Point out the two curves for which the incident radiation have same frequency but different intensities.
View Solution(i) Plot a labelled graph of |Vs| where Vs is stopping potential versus frequency f of the incident radiation.
(ii) State how will you use this graph to determine the value of Planck.s constant.
View Solution
