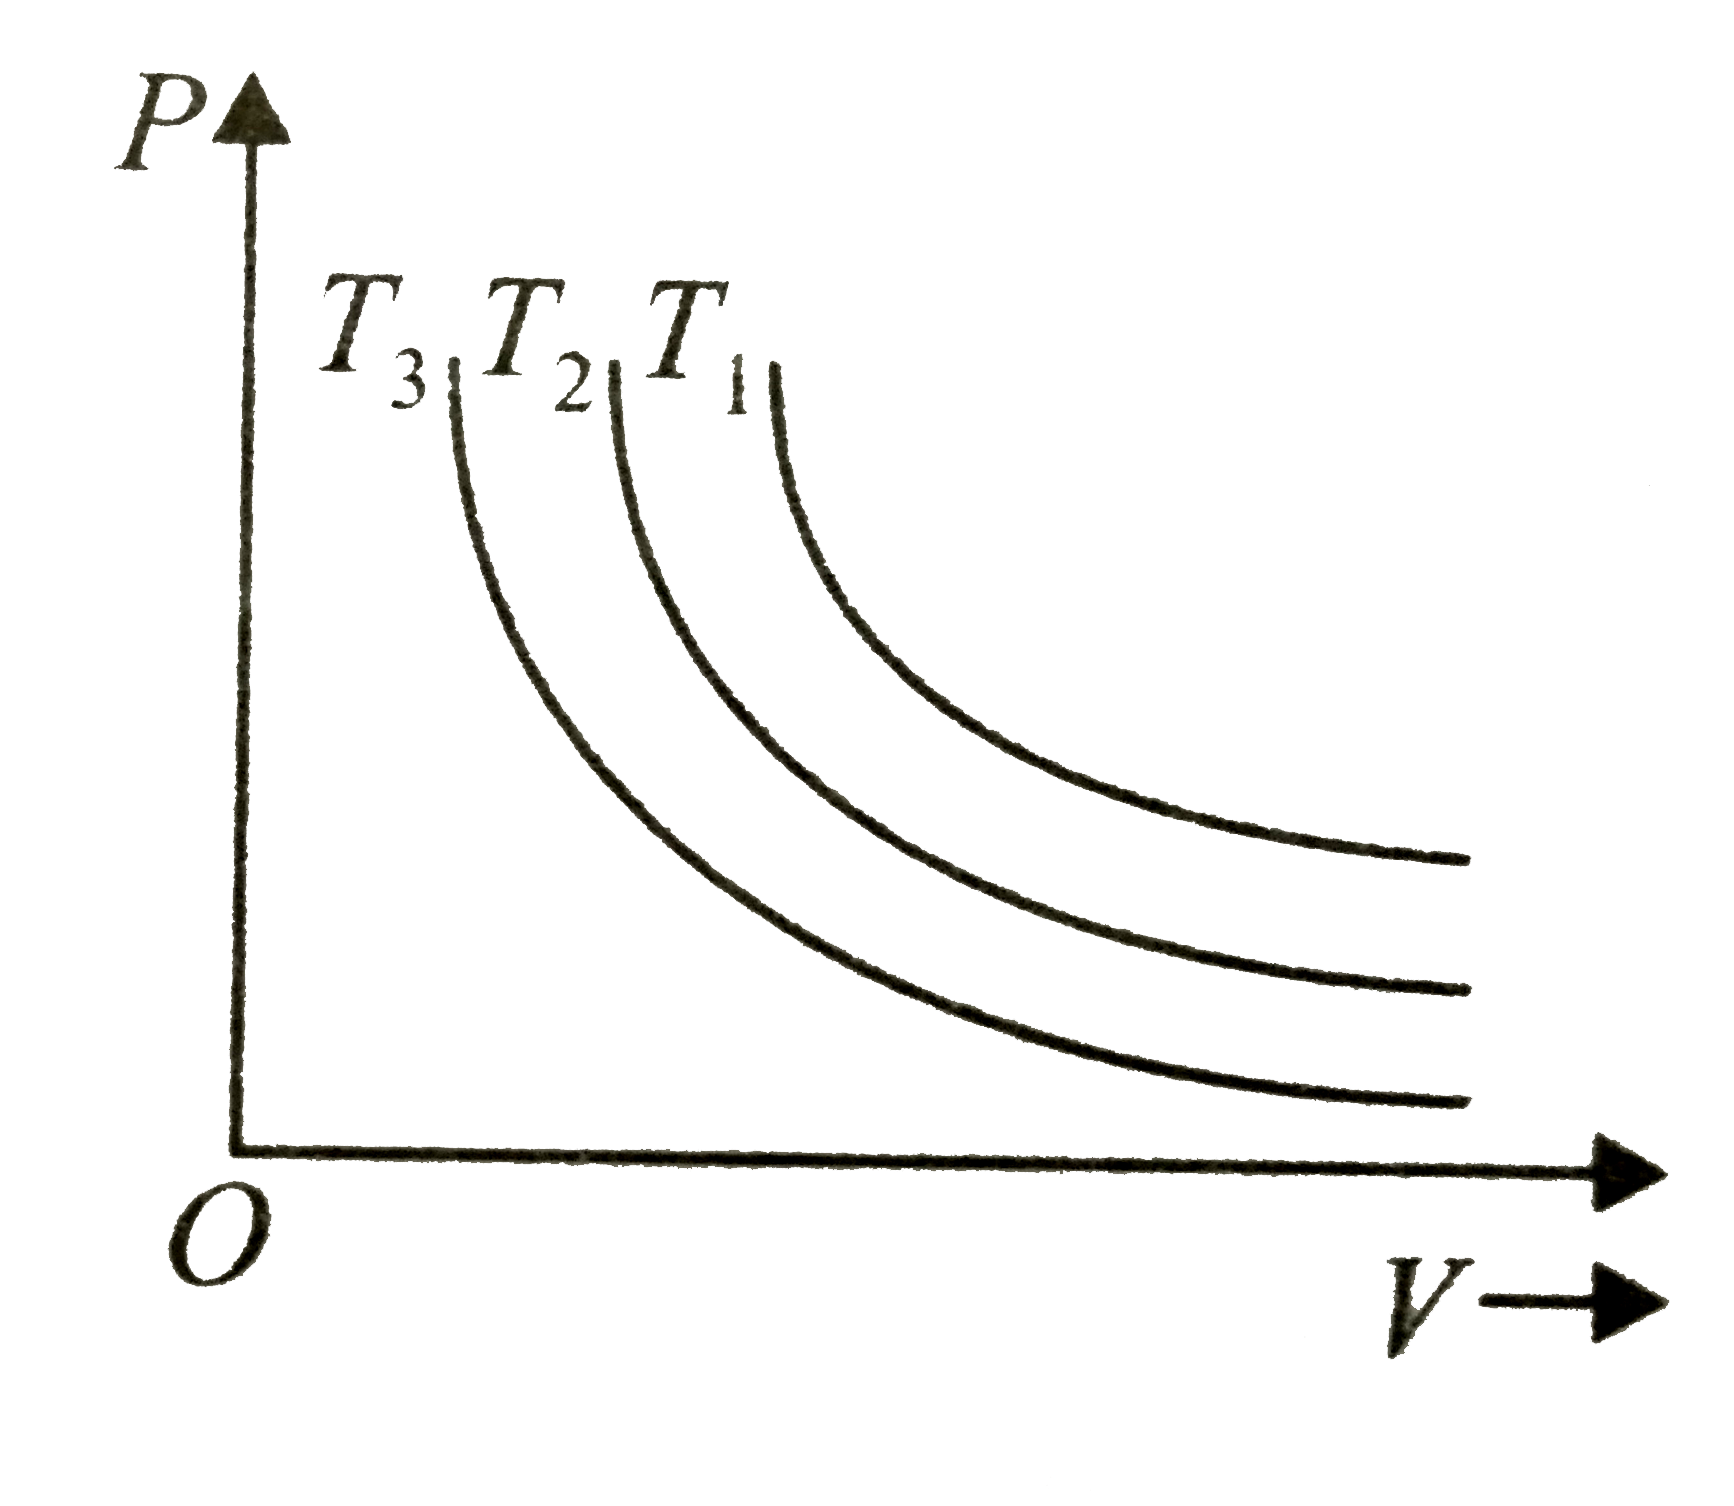
The isothermal diagram of a gas at three different temperatures T1,T2andT3, is show in the given figure .Then
a.T1<T2<T
b. T1<T2>T3
c.T1>T2>T3
d.T1>T2<T3
The correct Answer is:C
The given diagram shows that the curves move away from the origin at higher temperature.
Topper's Solved these Questions
- THERMODYNAMICSBOOK - NCERT FINGERTPS ENGLISHCHAPTER - THERMODYNAMICSEXERCISE - HOTs
8 Videos
- THERMODYNAMICSBOOK - NCERT FINGERTPS ENGLISHCHAPTER - THERMODYNAMICSEXERCISE - Assertion & Reason
15 Videos
- THERMAL PROPERTIES OF MATTERBOOK - NCERT FINGERTPS ENGLISHCHAPTER - THERMAL PROPERTIES OF MATTEREXERCISE - Assertion And Reason
10 Videos
- UNITS AND MEASUREMENTSBOOK - NCERT FINGERTPS ENGLISHCHAPTER - UNITS AND MEASUREMENTSEXERCISE - Assertion And Reason
15 Videos
Similar Questions
Knowledge Check
The voltage V and current I v graphs for a conductor at two different temperatures T1andT2 are shown in the figure. The relation between T1andT2 is
 AT1>T2BT1<T2CT1=T2DT1=1T2
Assertion : Current versus potential difference (i-V) graph for a conductor at two different temperatures T1 and T2 is shown in figure. Hence T1>T2.
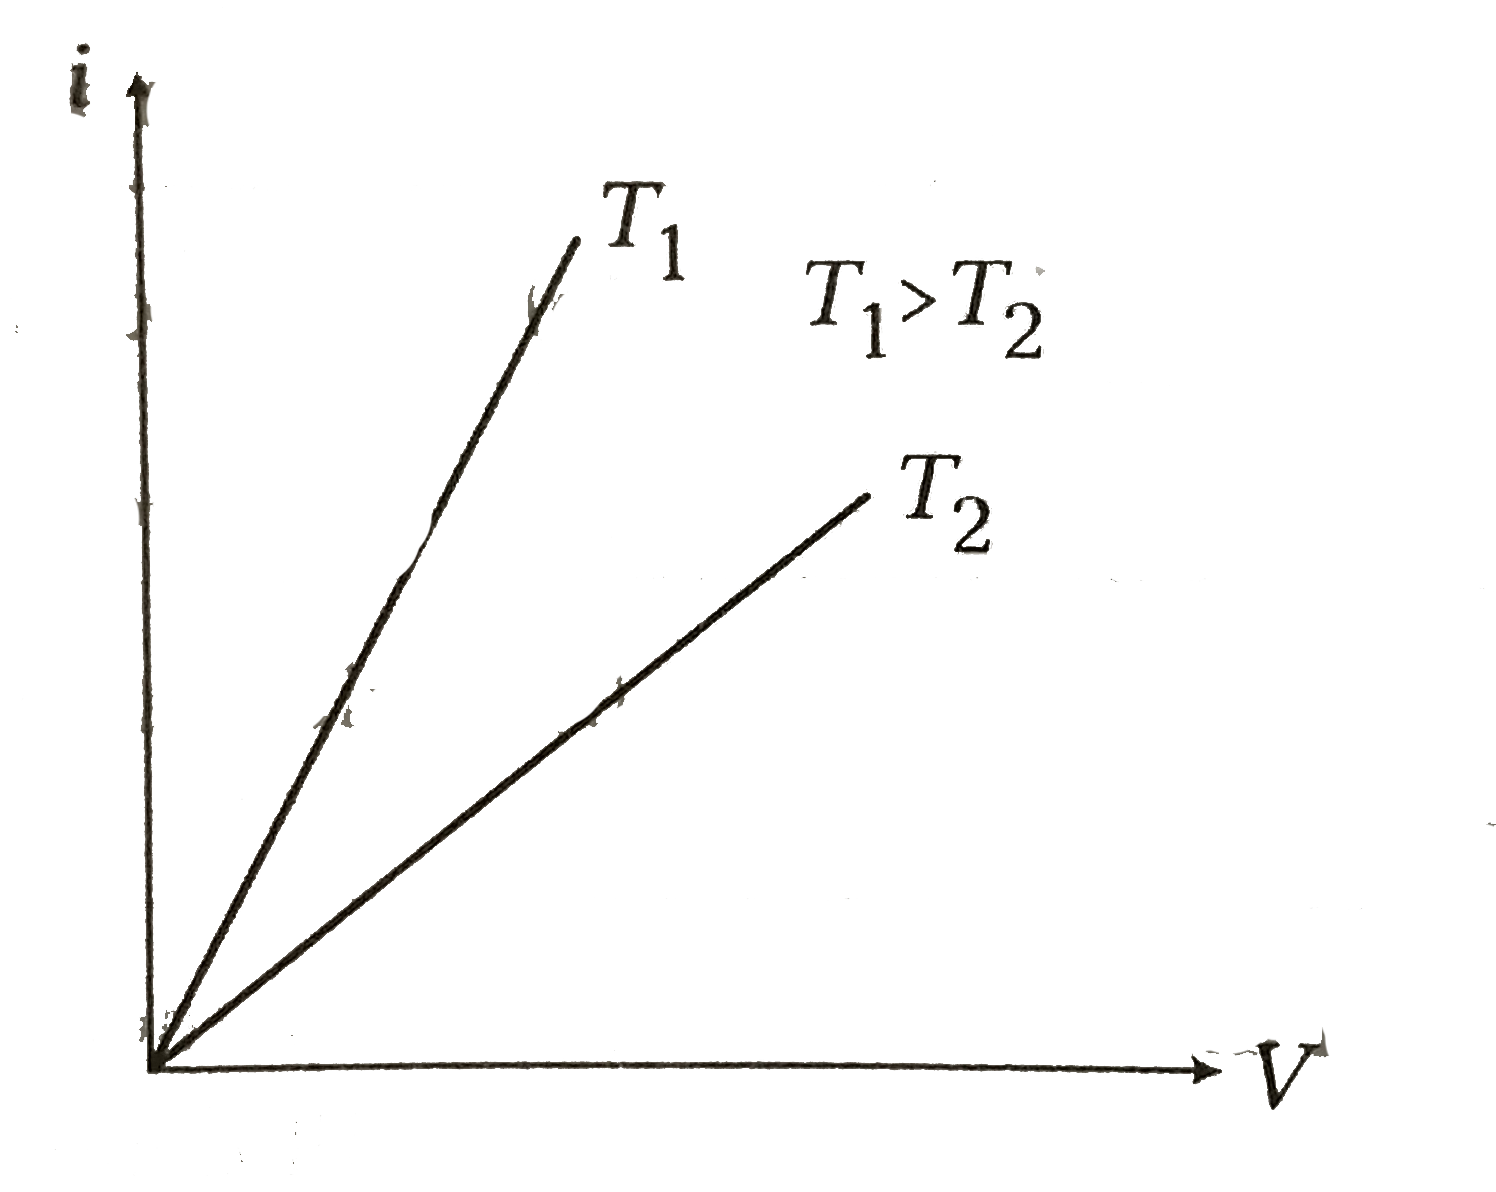
Reason : Resistance of a conductor increases with rise in temperature.
View Solution
The given figure shows T.S of
View SolutionThe current - voltage graphs for a given metallic wire at two different temperatures T1andT2 are shown in the figure.
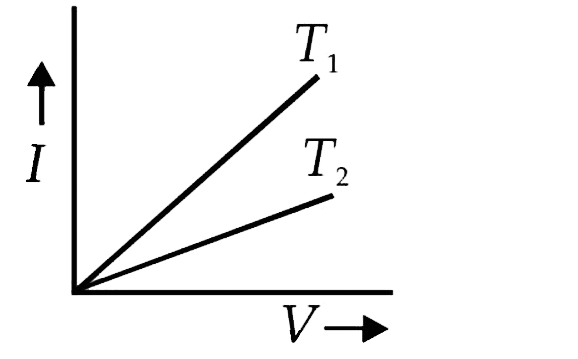
The temperature T2 is greater than T1.
View SolutionThe current - voltage graphs for a given metallic wire at two different temperatures T1andT2 are shown in the figure.

The temperature T2 is greater than T1.
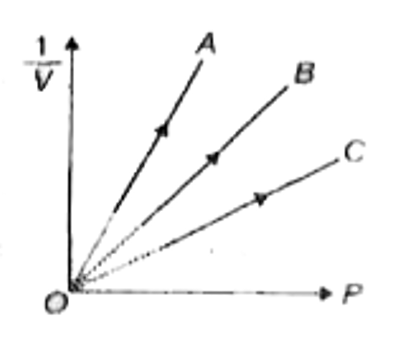
View SolutionFigure shows the isotherms of a fixed mass of an ideal gas at three temperatures TA,TB and TC , then
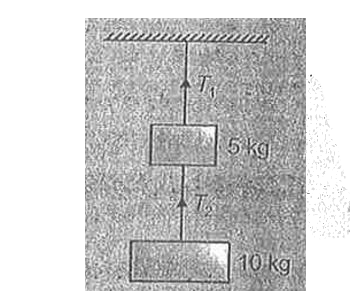
View SolutionWhat will be the tension T1andT2 in the given figure?

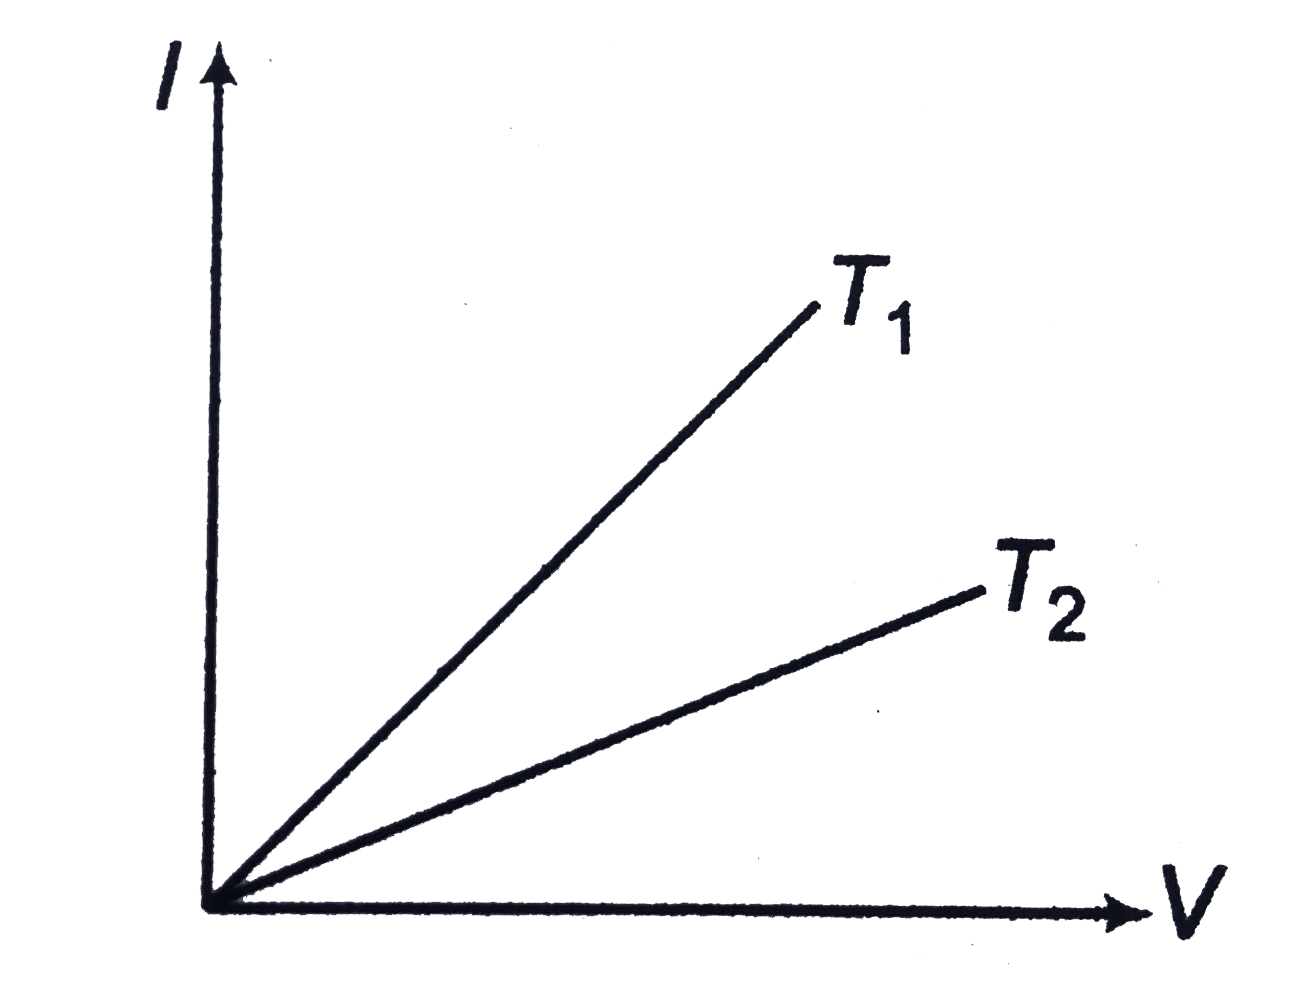
View SolutionThe current voltage graphs for a given metalic wire two different temperature T1 and T2 are shown in figure The temperature T2 is greater than T1. Is this statement true or false?
View Solution

