The p−V diagram of two different masses m1 and m2 are drawn (as shown) at constant temperature (T).
To solve the problem regarding the p−V diagrams of two different masses \( m_1 \) and \( m_2 \) at constant temperature \( T \), we will follow these steps:
Step 1: Understand the Ideal Gas Law
The ideal gas law is given by the equation:
\(
PV = nRT
\)
where:
- \( P \) is the pressure,
- \( V \) is the volume,
- \( n \) is the number of moles,
- \( R \) is the universal gas constant,
- \( T \) is the temperature.
Step 2: Relate Mass to Moles
The number of moles \( n \) can be expressed in terms of mass \( m \) and molar mass \( M \):
\(
n = \frac{m}{M}
\)
Substituting this into the ideal gas law gives:
\(
PV = \frac{m}{M}RT
\)
Step 3: Rearranging the Equation
Rearranging the equation to find mass \( m \):
\(
m = \frac{PV \cdot M}{RT}
\)
This shows that mass \( m \) is directly proportional to the product \( PV \) when temperature \( T \) and molar mass \( M \) are constant.
Step 4: Analyze the Given Graphs
From the p−V diagrams, we can observe the volumes \( V_1 \) and \( V_2 \) corresponding to the pressures \( P_1 \) and \( P_2 \). We note:
- \( V_2 > V_1 \) (as per the graph).
Step 5: Compare the Products \( PV \)
Since the temperature is constant, we can compare the products:
- For the first mass \( m_1 \):
\(
P_1 V_1
\)
- For the second mass \( m_2 \):
\(
P_2 V_2
\)
Step 6: Establish Relationships
From the graphs:
- If \( V_2 > V_1 \), then \( P_2 V_2 \) must be greater than \( P_1 V_1 \) if the pressure \( P_2 \) is also higher than \( P_1 \) or if the increase in volume compensates for a decrease in pressure.
Step 7: Conclusion on Masses
Since \( m \) is directly proportional to \( PV \):
- If \( PV_2 > PV_1 \), then:
\(
m_2 > m_1
\)
Thus, we conclude that:
\(
m_2 \text{ is greater than } m_1
\)
Final Answer
The final conclusion is that \( m_2 > m_1 \).
---
The ideal gas law is given by the equation:
\(
PV = nRT
\)
where:
- \( P \) is the pressure,
- \( V \) is the volume,
- \( n \) is the number of moles,
- \( R \) is the universal gas constant,
- \( T \) is the temperature.
The number of moles \( n \) can be expressed in terms of mass \( m \) and molar mass \( M \):
\(
n = \frac{m}{M}
\)
Substituting this into the ideal gas law gives:
\(
PV = \frac{m}{M}RT
\)
Rearranging the equation to find mass \( m \):
\(
m = \frac{PV \cdot M}{RT}
\)
This shows that mass \( m \) is directly proportional to the product \( PV \) when temperature \( T \) and molar mass \( M \) are constant.
From the p−V diagrams, we can observe the volumes \( V_1 \) and \( V_2 \) corresponding to the pressures \( P_1 \) and \( P_2 \). We note:
- \( V_2 > V_1 \) (as per the graph).
Since the temperature is constant, we can compare the products:
- For the first mass \( m_1 \):
\(
P_1 V_1
\)
- For the second mass \( m_2 \):
\(
P_2 V_2
\)
From the graphs:
- If \( V_2 > V_1 \), then \( P_2 V_2 \) must be greater than \( P_1 V_1 \) if the pressure \( P_2 \) is also higher than \( P_1 \) or if the increase in volume compensates for a decrease in pressure.
Since \( m \) is directly proportional to \( PV \):
- If \( PV_2 > PV_1 \), then:
\(
m_2 > m_1
\)
Thus, we conclude that:
\(
m_2 \text{ is greater than } m_1
\)
The final conclusion is that \( m_2 > m_1 \).
Topper's Solved these Questions
- THERMOMETRY THERMAL EXPANSION AND KINETIC THEORY OF GASESBOOK - DC PANDEY ENGLISHCHAPTER - THERMOMETRY THERMAL EXPANSION AND KINETIC THEORY OF GASESEXERCISE - Check point 14.1
10 Videos
- THERMOMETRY THERMAL EXPANSION AND KINETIC THEORY OF GASESBOOK - DC PANDEY ENGLISHCHAPTER - THERMOMETRY THERMAL EXPANSION AND KINETIC THEORY OF GASESEXERCISE - Check point 14.2
20 Videos
- SUPERPOSITION OF WAVESBOOK - DC PANDEY ENGLISHCHAPTER - SUPERPOSITION OF WAVESEXERCISE - Level 2 Subjective
8 Videos
- THERMOMETRY,THERMAL EXPANSION & KINETIC THEORY OF GASESBOOK - DC PANDEY ENGLISHCHAPTER - THERMOMETRY,THERMAL EXPANSION & KINETIC THEORY OF GASESEXERCISE - Level 2 Subjective
9 Videos
Similar Questions
Knowledge Check
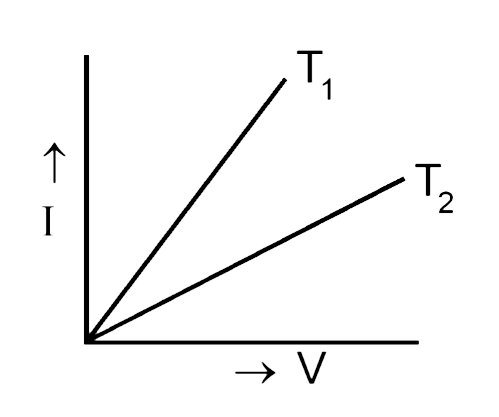
The voltage V and current I v graphs for a conductor at two different temperatures T1andT2 are shown in the figure. The relation between T1andT2 is
 AT1>T2BT1<T2CT1=T2DT1=1T2
Two masses m1andm2 are suspended together by a massless spring of constant k. When the masses are in equilibrium, m1 is removed without disturbing the system. Then the angular frequency of oscillation of m2 is
A√(k/m1)B√(k/m2)C√[k(m1+m2)]D√[k/(m1m2)]
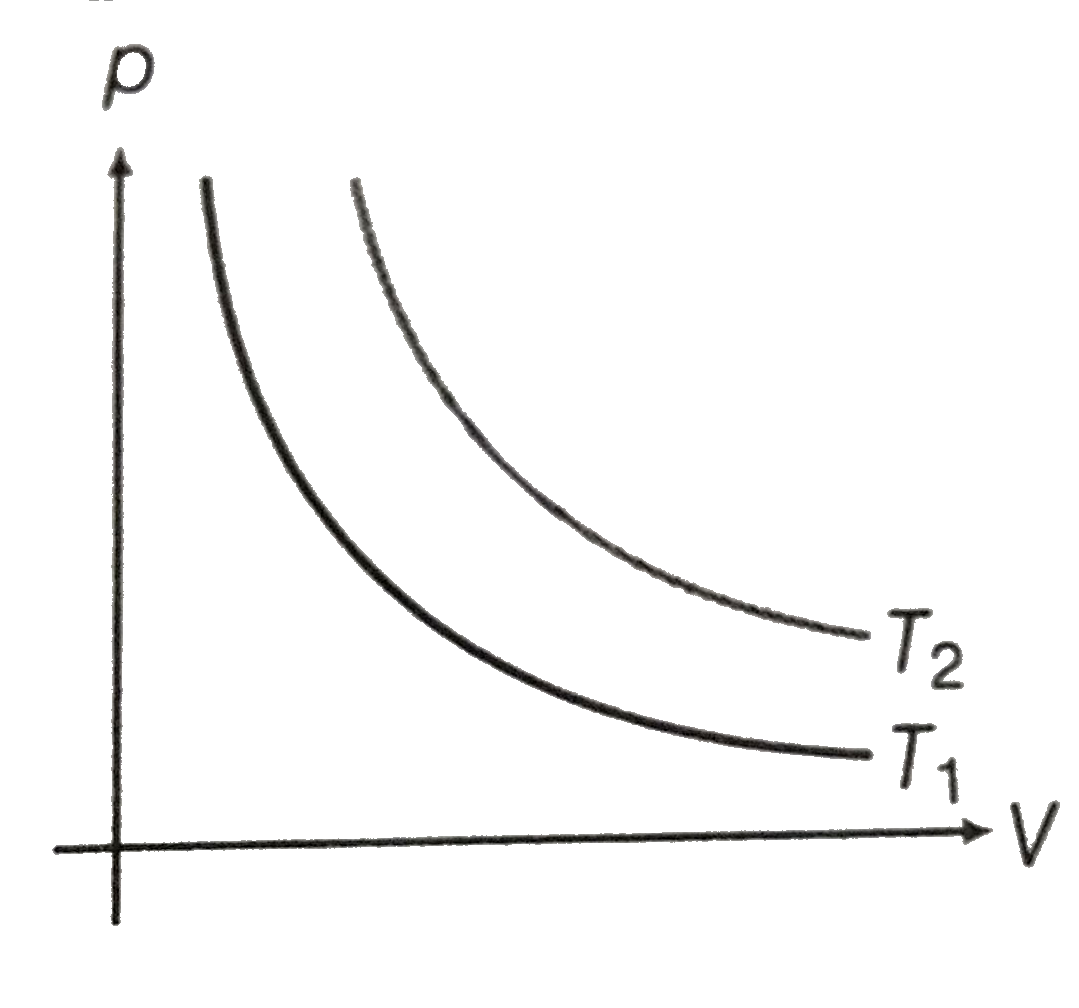
The p−V diagrams of same mass of a gas are drawn at two different temperatues T1 and T2 Explain whether T1>T2 or T2>T1.
View SolutionThe stress-strain graph for a metallic wire is shown at two different temperature, T1 and T2 which temperature is high T1 or T2 ?
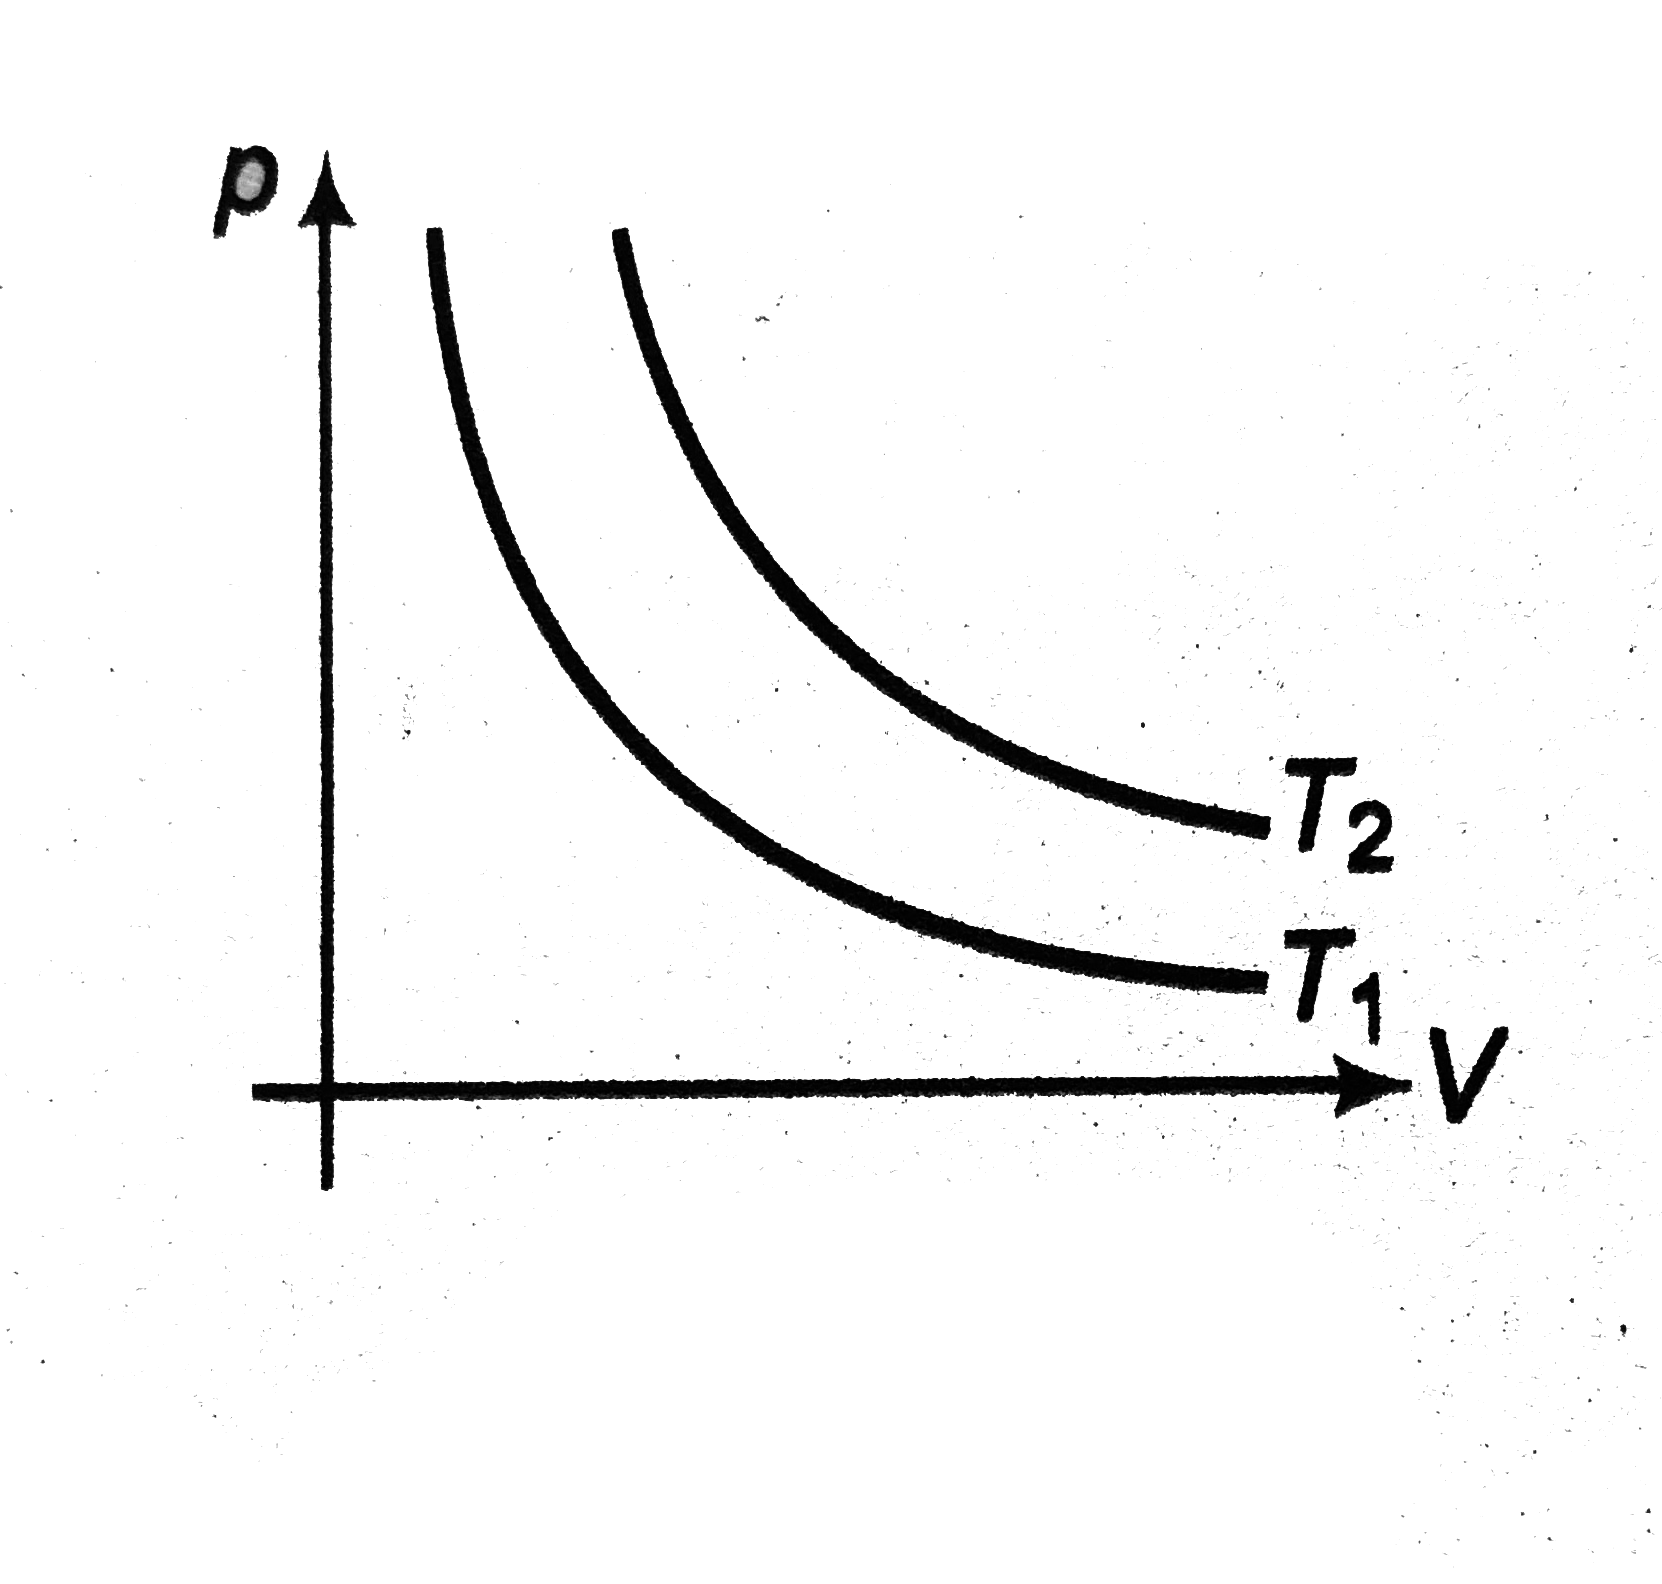
View Solutionp−V diagram of same mass of a gas are drawn at two different temperatures (T1) and (T2). Explain whether T1>T2orT2>T1.
 .
.
View SolutionThe current (I) and voltage (V) graphs for a given metallic wire at two different temperature (T1) and (T2) are shown in fig. It is concluded that
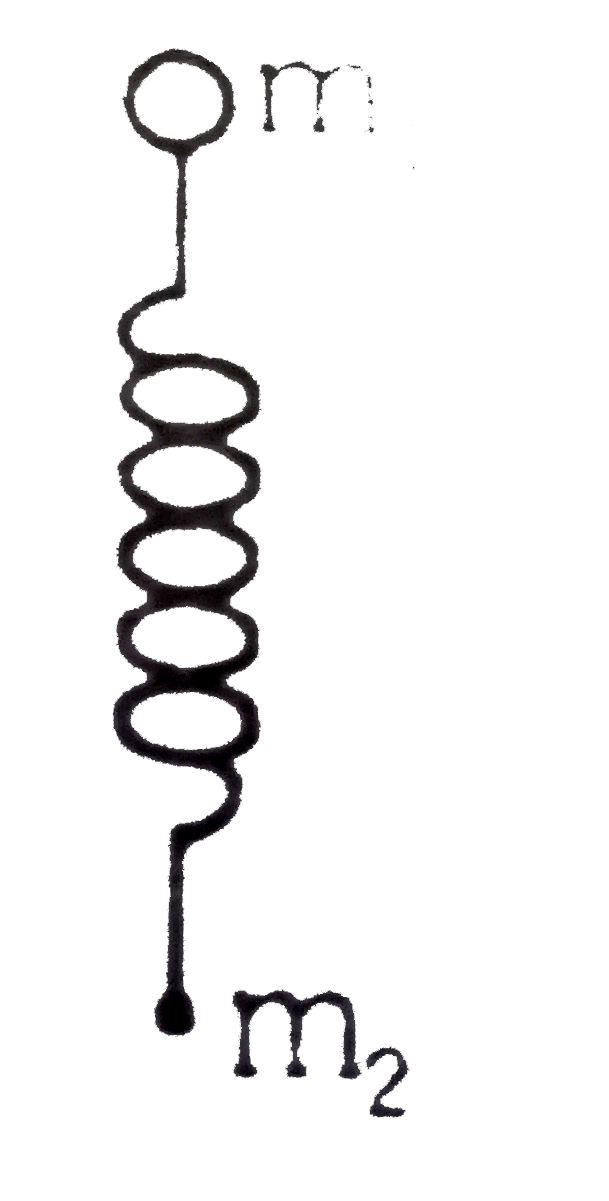
View SolutionThe two masses m1 and m2 are joined by a spring as shown. The system is dropped to the ground from a height. The spring will be
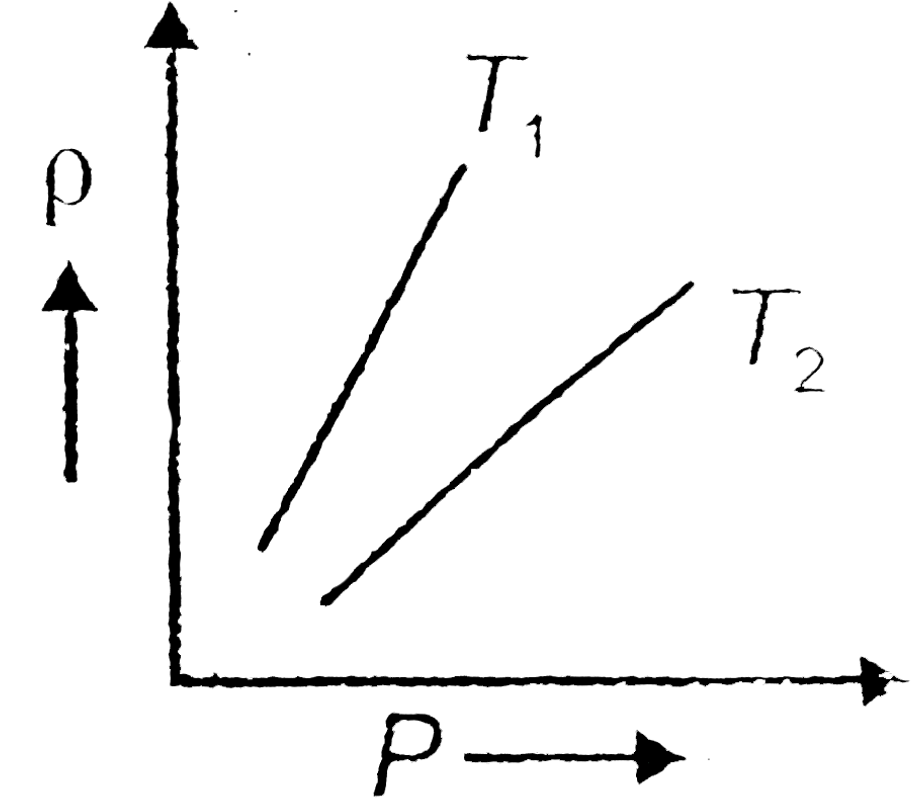
View SolutionThe density (ρ) versus pressure (P) graphs of a given mass of an ideal gas is shown at two temperatures T1andT2. Then relation between T1andT2 may be
View Solution


