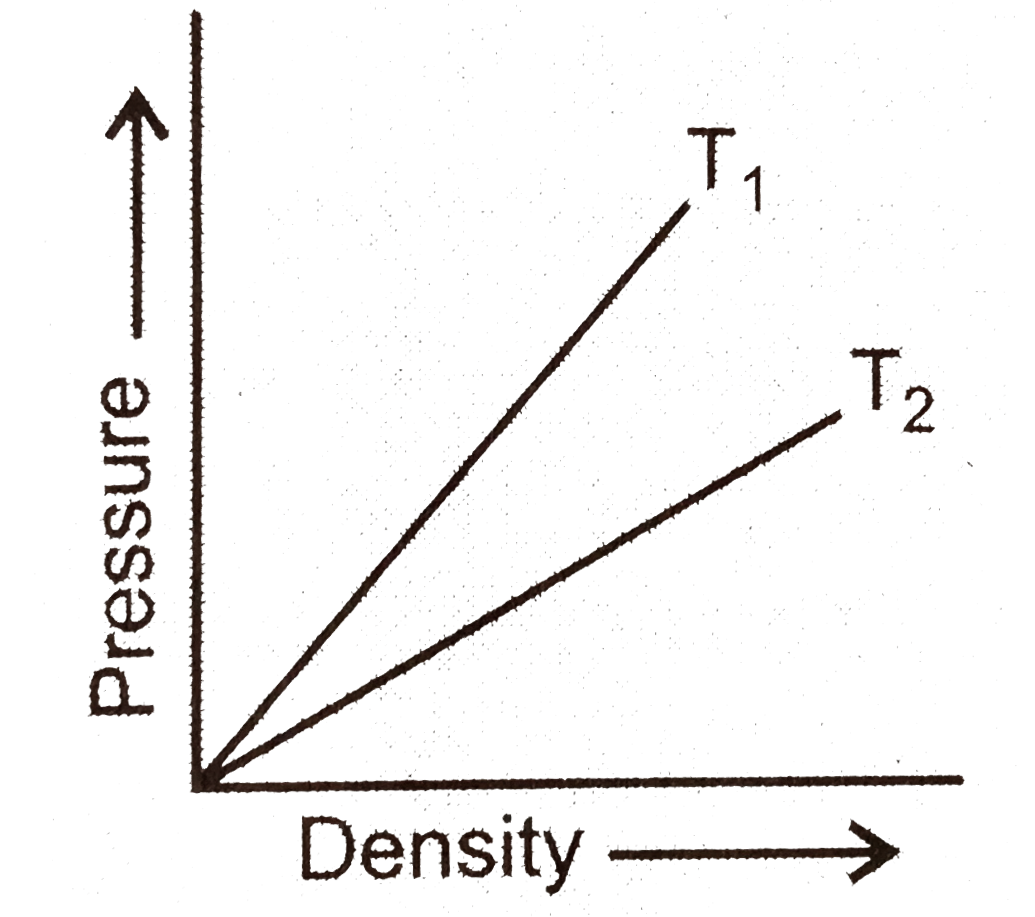
The density (ρ) versus pressure (P) graphs of a given mass of an ideal gas is shown at two temperatures T1andT2. Then relation between T1andT2 may be
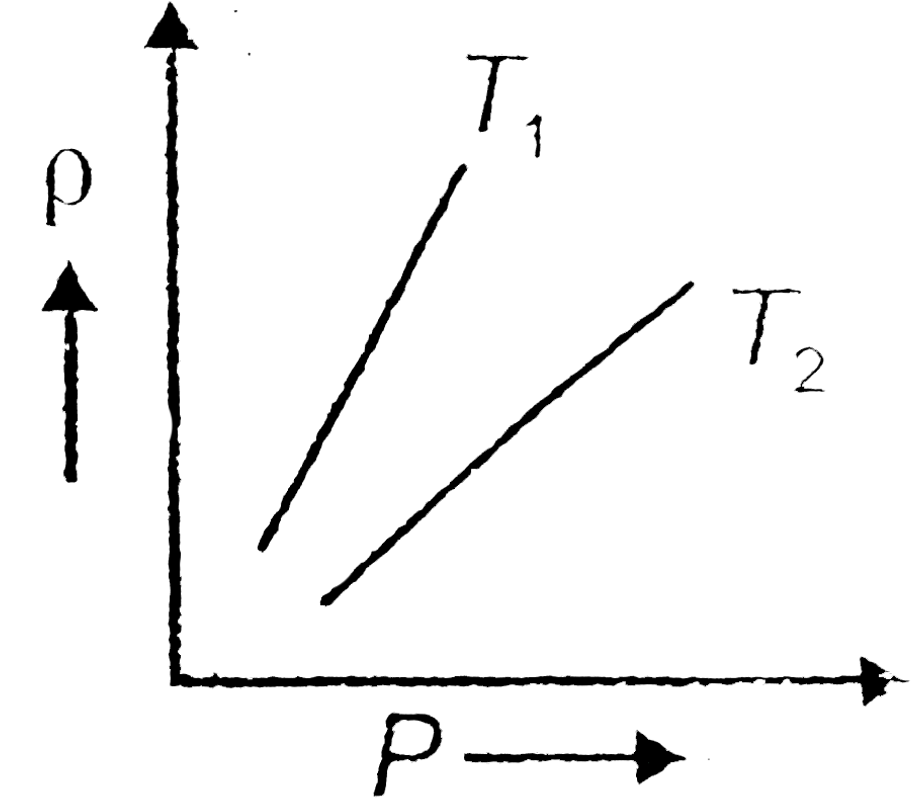
T1>T2
T2>T1
T1=T2
None of these
The correct Answer is:B
Step by step video & image solution for The density (rho) versus pressure (P) graphs of a given mass of an ideal gas is shown at two temperatures T_(1) and T_(2). Then relation between T_(1) and T_2 may be by Physics experts to help you in doubts & scoring excellent marks in Class 12 exams.
Updated on:21/07/2023Topper's Solved these Questions
- KINETIC THEORYBOOK - AAKASH INSTITUTE ENGLISHCHAPTER - KINETIC THEORYEXERCISE - Assignment (Section-B) Objective type questions (One option is correct)
10 Videos
- KINETIC THEORYBOOK - AAKASH INSTITUTE ENGLISHCHAPTER - KINETIC THEORYEXERCISE - Assignment (Section-C) Objective type questions (More than one option are correct)
9 Videos
- KINETIC THEORYBOOK - AAKASH INSTITUTE ENGLISHCHAPTER - KINETIC THEORYEXERCISE - Try Yourself
43 Videos
- GRAVITATION BOOK - AAKASH INSTITUTE ENGLISHCHAPTER - GRAVITATION EXERCISE - ASSIGNMENT SECTION - D (ASSERTION-REASON TYPE QUESTIONS)
15 Videos
- LAWS OF MOTIONBOOK - AAKASH INSTITUTE ENGLISHCHAPTER - LAWS OF MOTIONEXERCISE - Assignment (SECTION-D) (Assertion-Reason Type Questions)
15 Videos
Similar Questions
Knowledge Check
The voltage V and current I v graphs for a conductor at two different temperatures T1andT2 are shown in the figure. The relation between T1andT2 is
 AT1>T2BT1<T2CT1=T2DT1=1T2
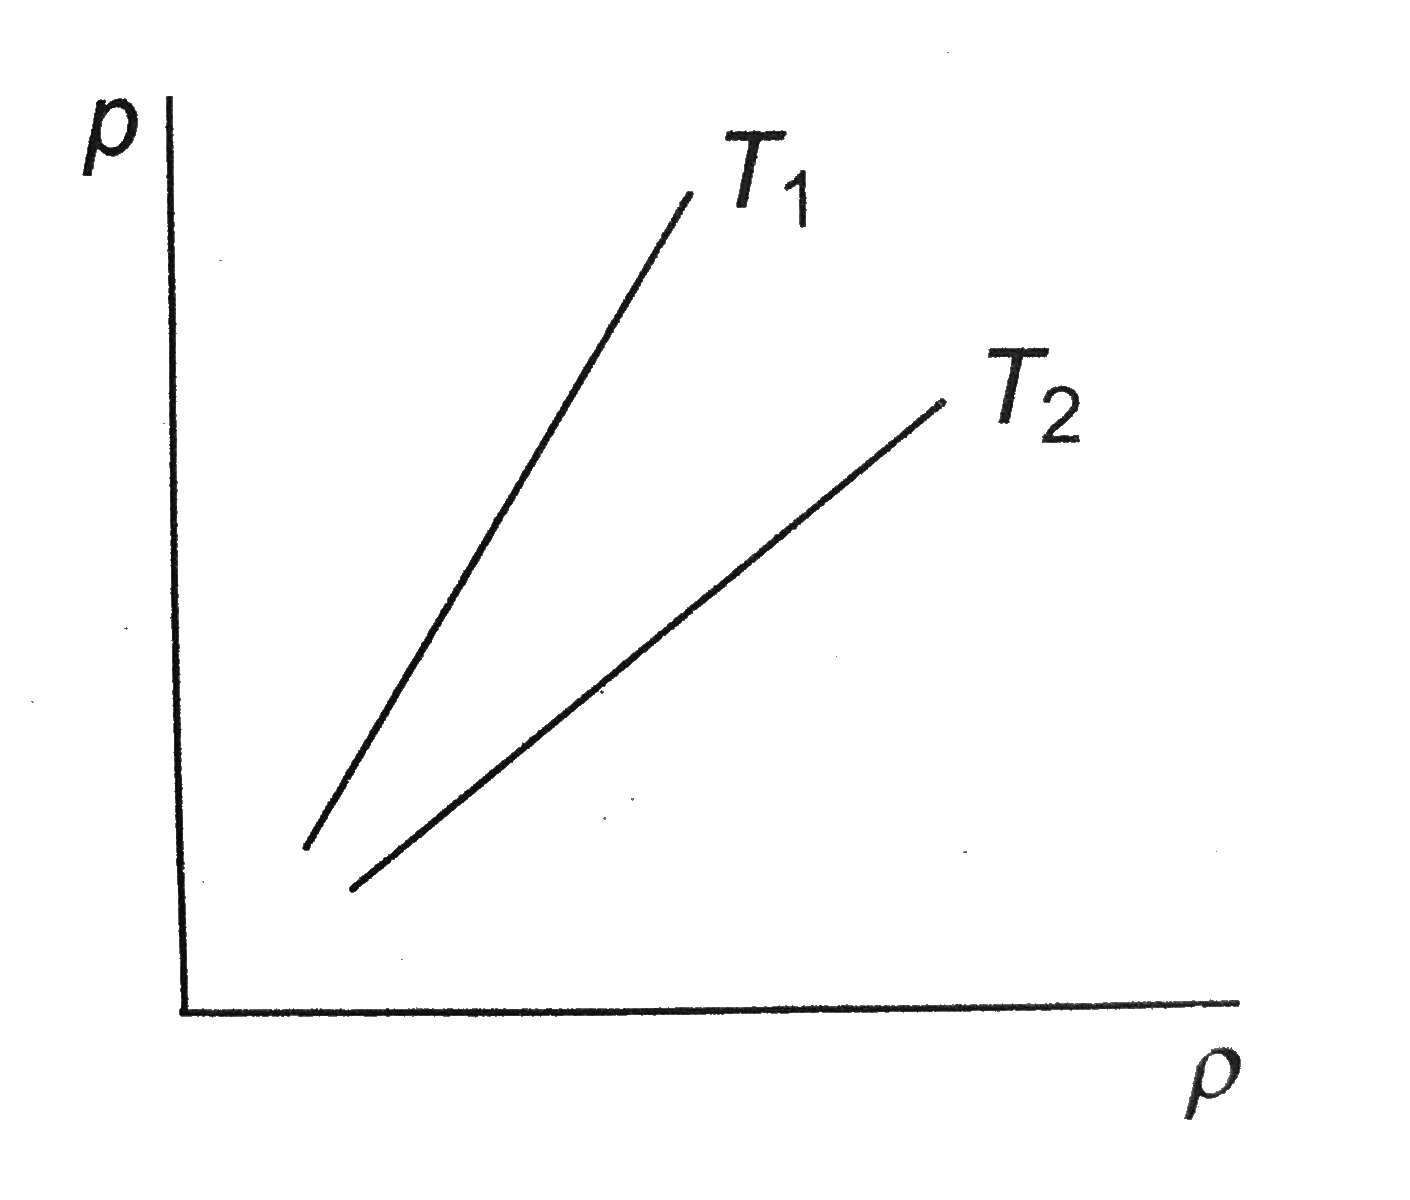
Figure shows graphs of pressure vs density for an ideal gas at two temperature T1andT2. Which of the following is correct?
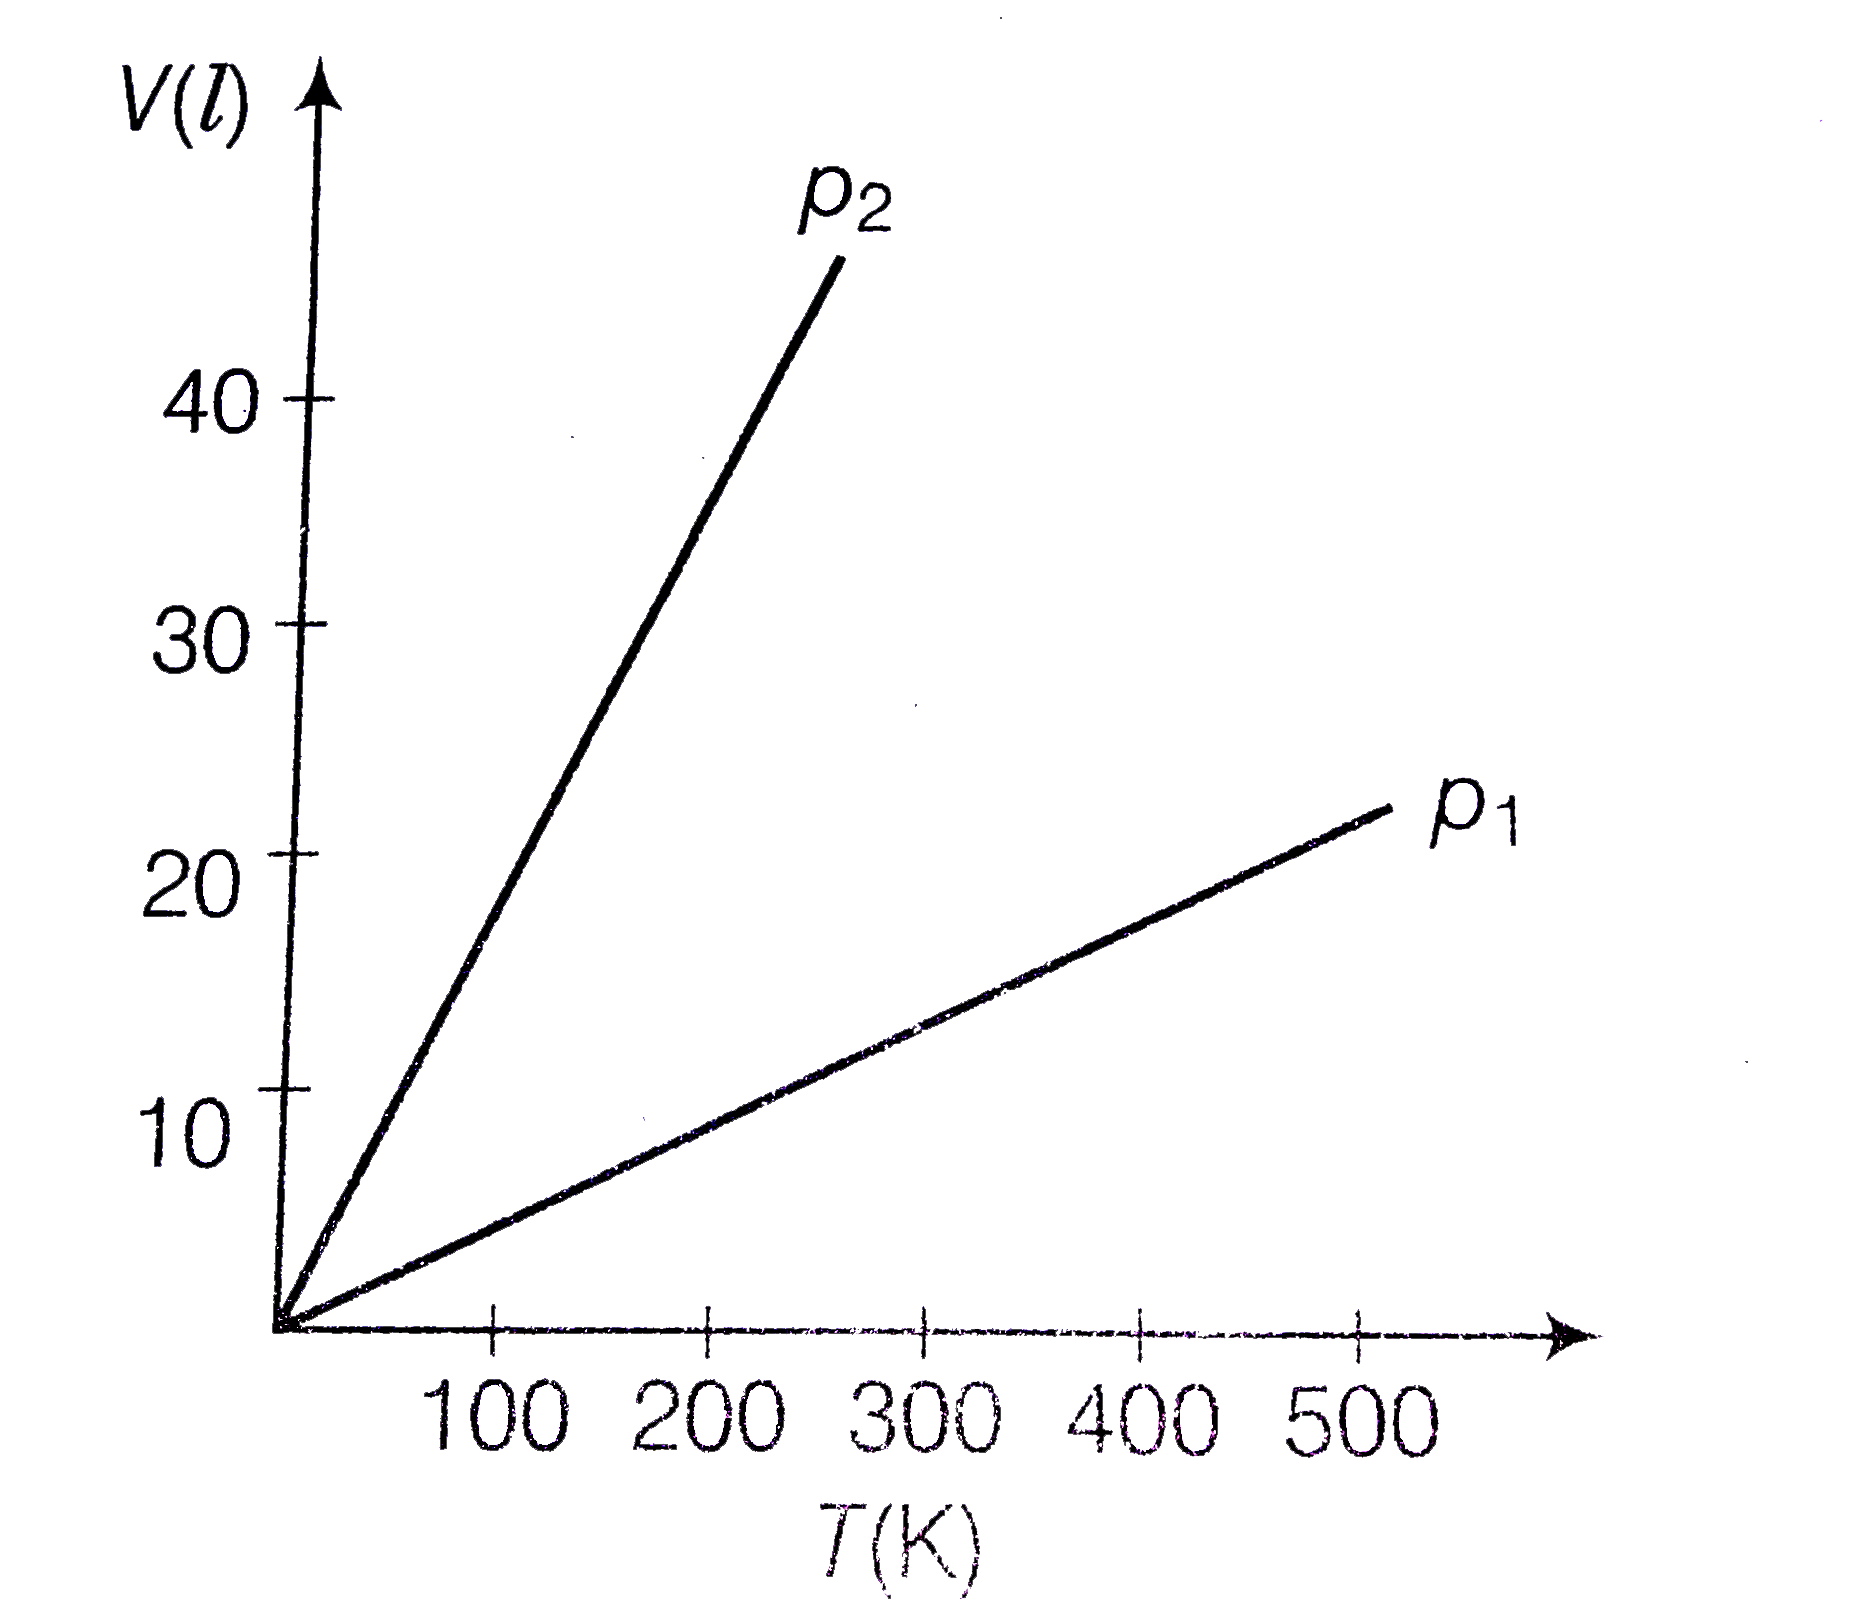
View SolutionFigure shows volume - temperature (V-T) graph for same mass of an ideal gas at two different pressures P1and P2. Hence
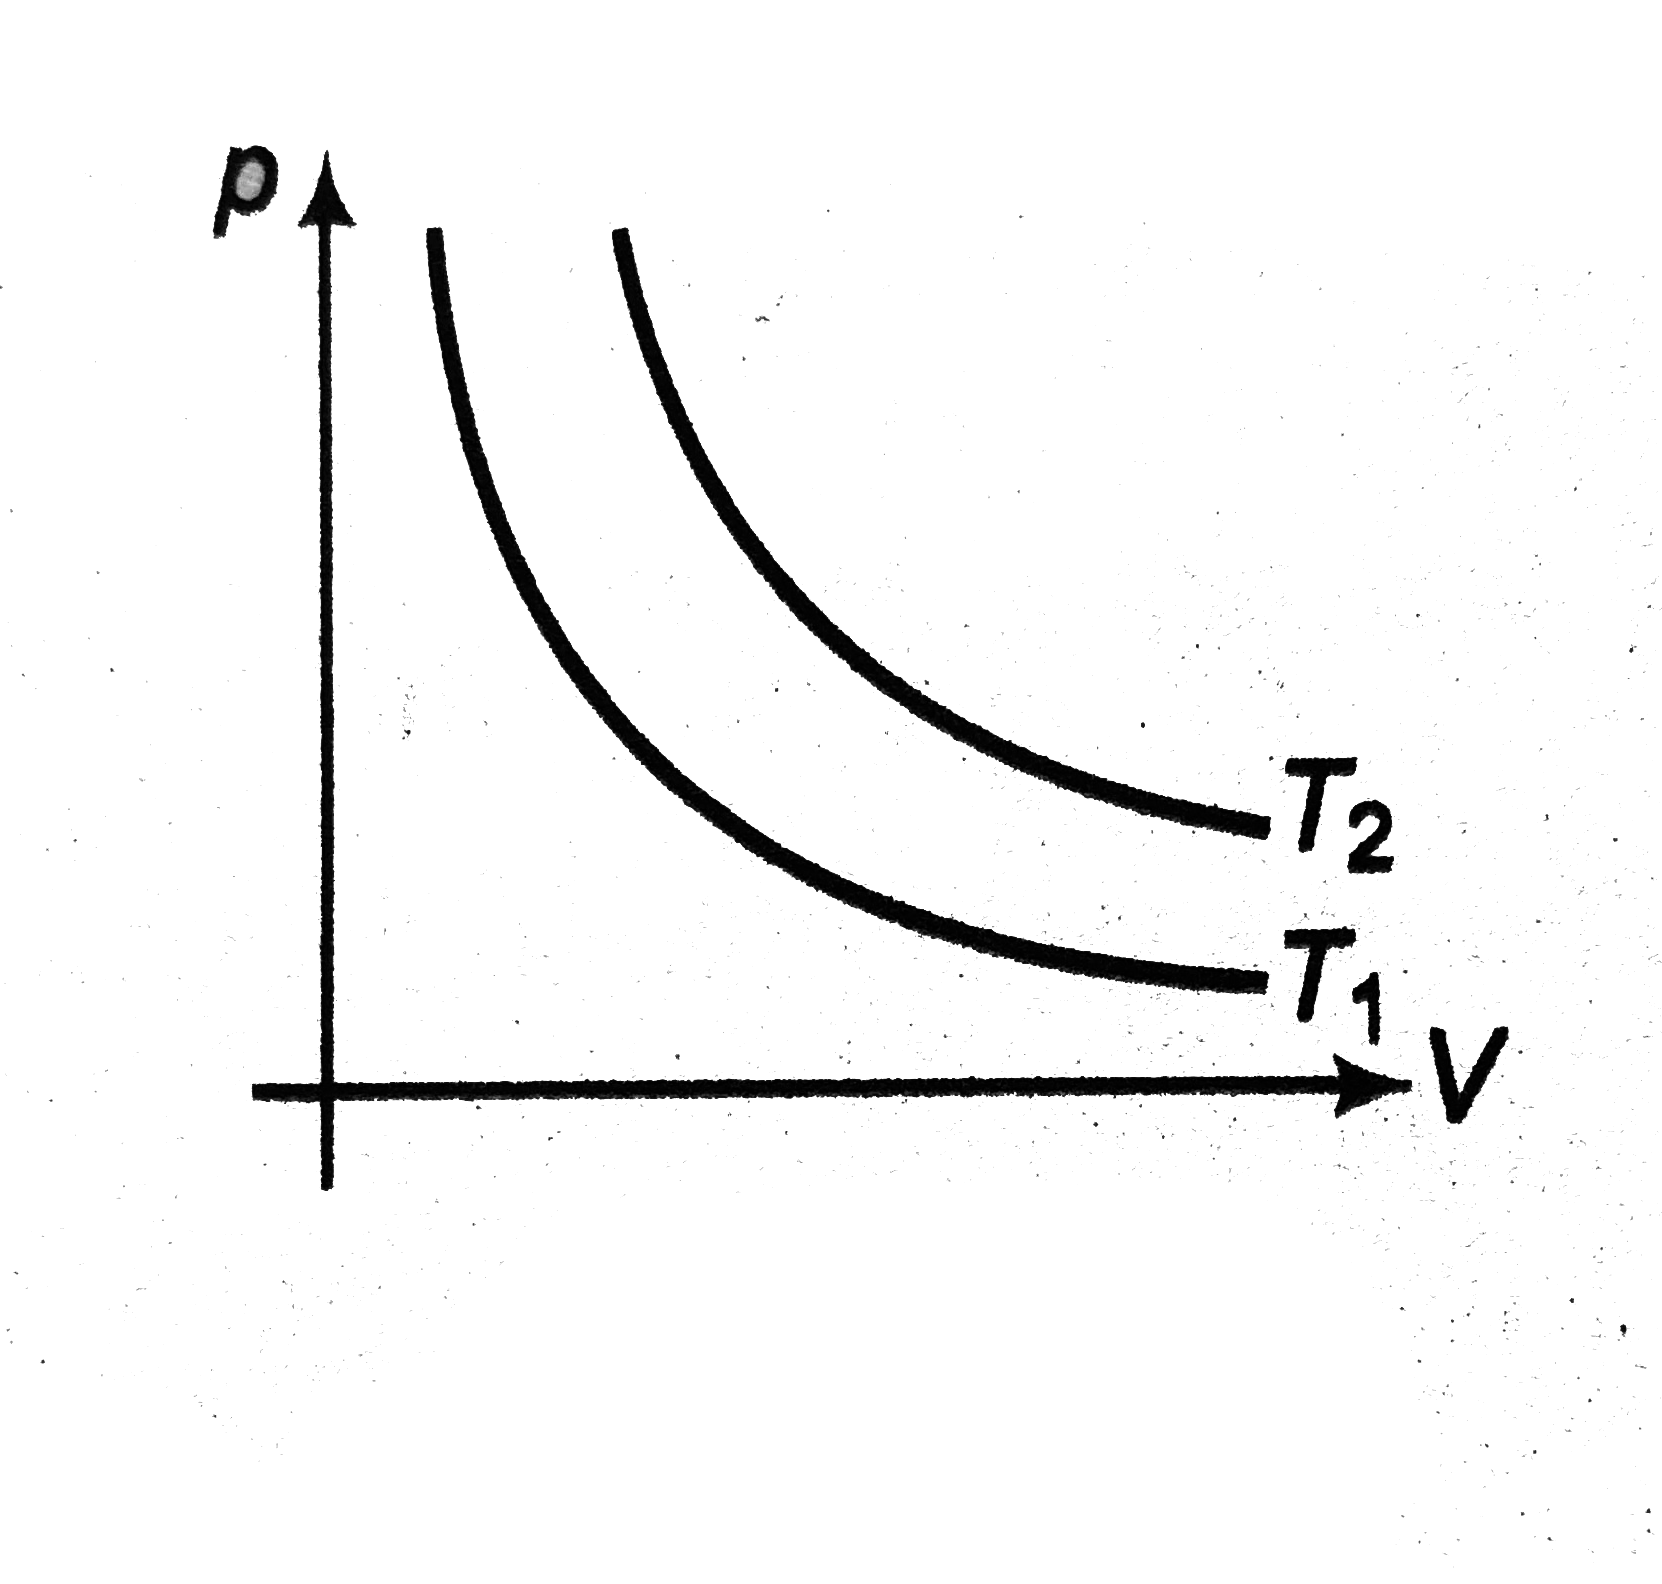
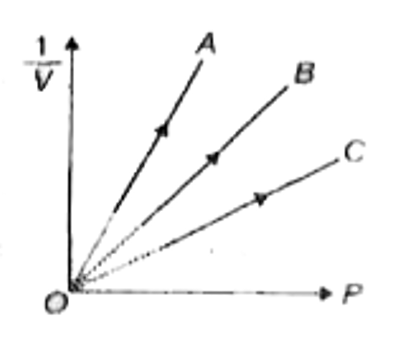
View Solutionp−V diagram of same mass of a gas are drawn at two different temperatures (T1) and (T2). Explain whether T1>T2orT2>T1.
 .
.
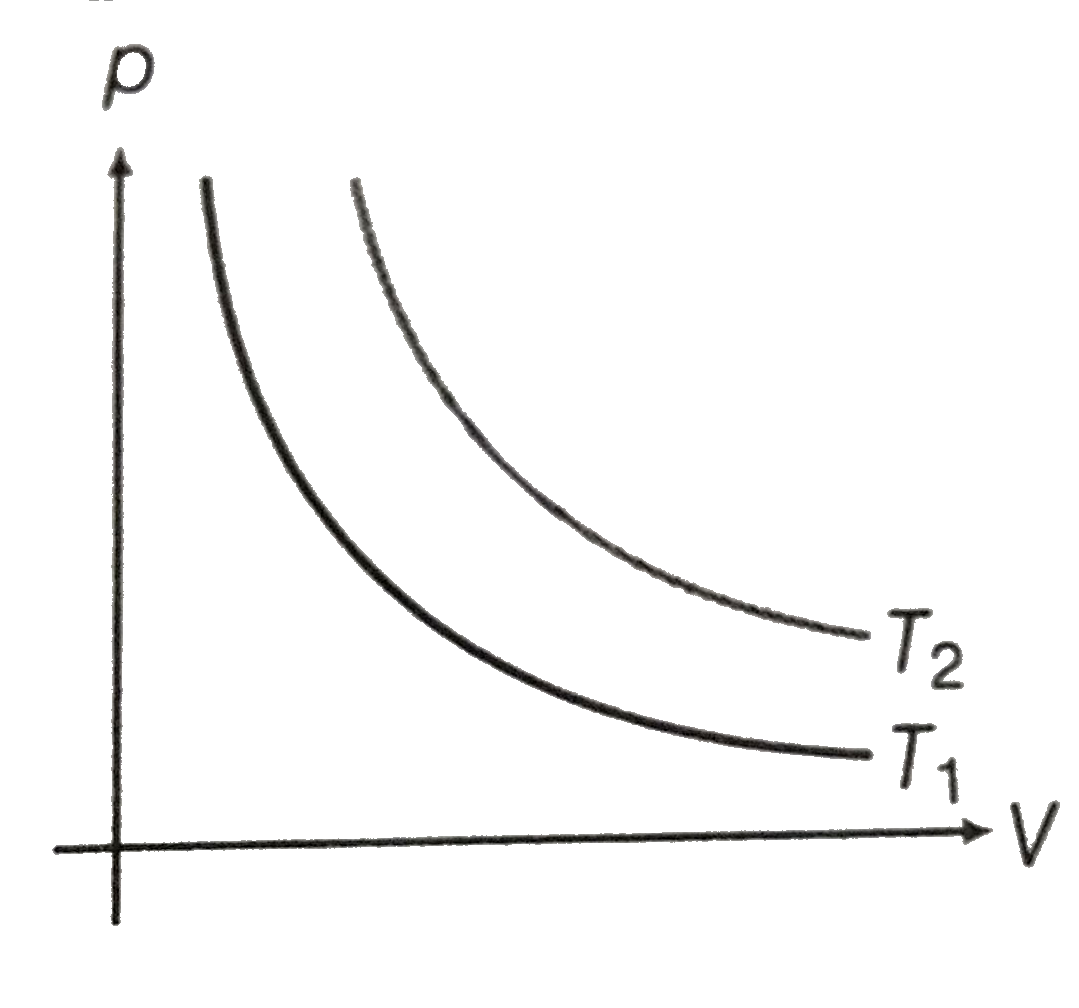
View SolutionThe p−V diagrams of same mass of a gas are drawn at two different temperatues T1 and T2 Explain whether T1>T2 or T2>T1.
View SolutionThe stress-strain graph for a metallic wire is shown at two different temperature, T1 and T2 which temperature is high T1 or T2 ?
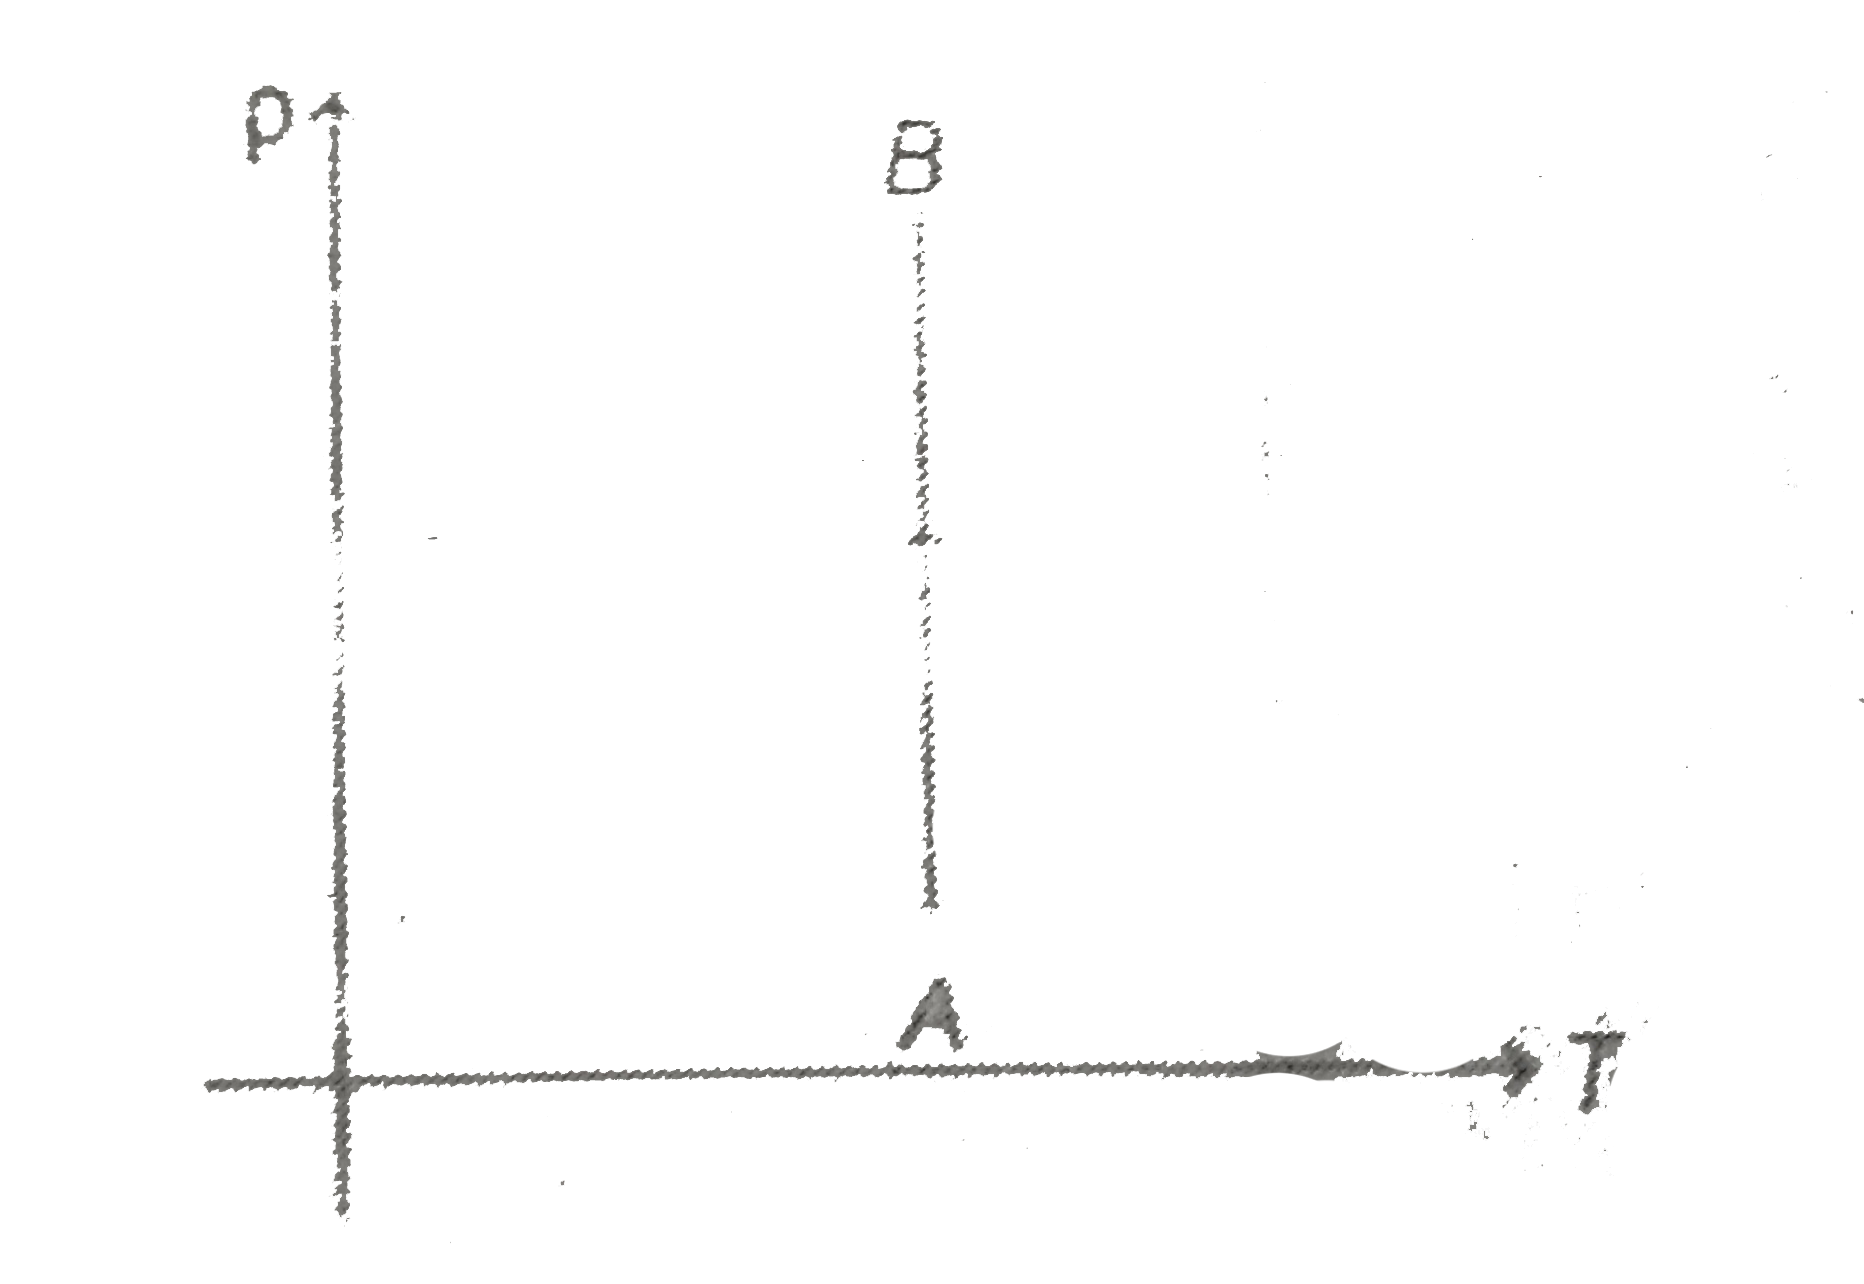
View SolutionThe ednsity (ρ) of an ideal gas varies with temperature T as shown in figure. Then
View SolutionVolume versus temperature graphs for a given mass of an ideal gas are shown in figure. At two different values of constant pressure. What can be inferred about relation between P1 and P2 ?
View Solution
 .
.