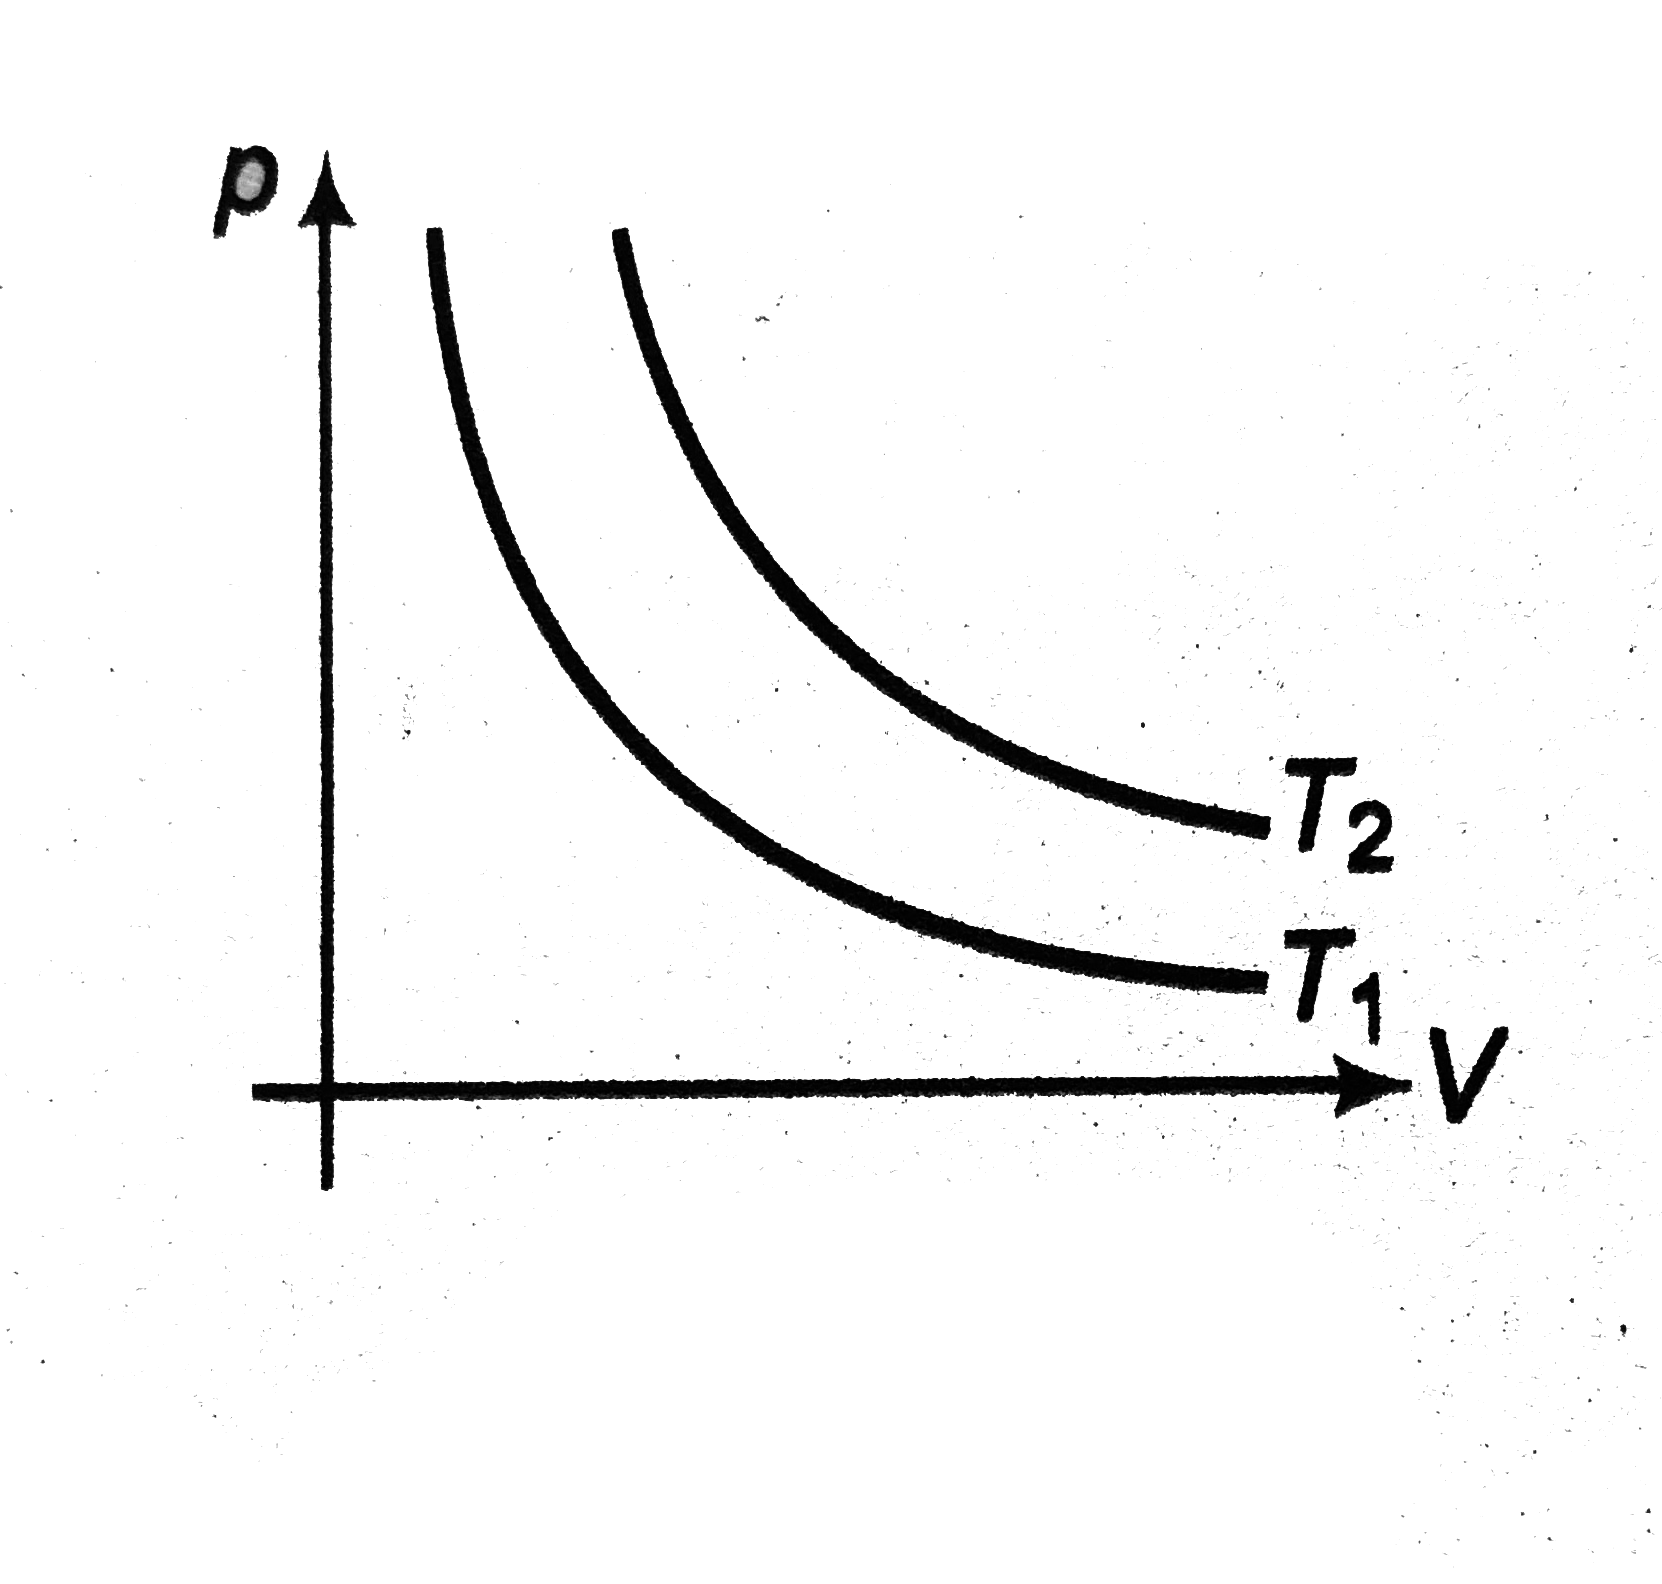
The p−V diagrams of same mass of a gas are drawn at two different temperatues T1 and T2 Explain whether T1>T2 or T2>T1. 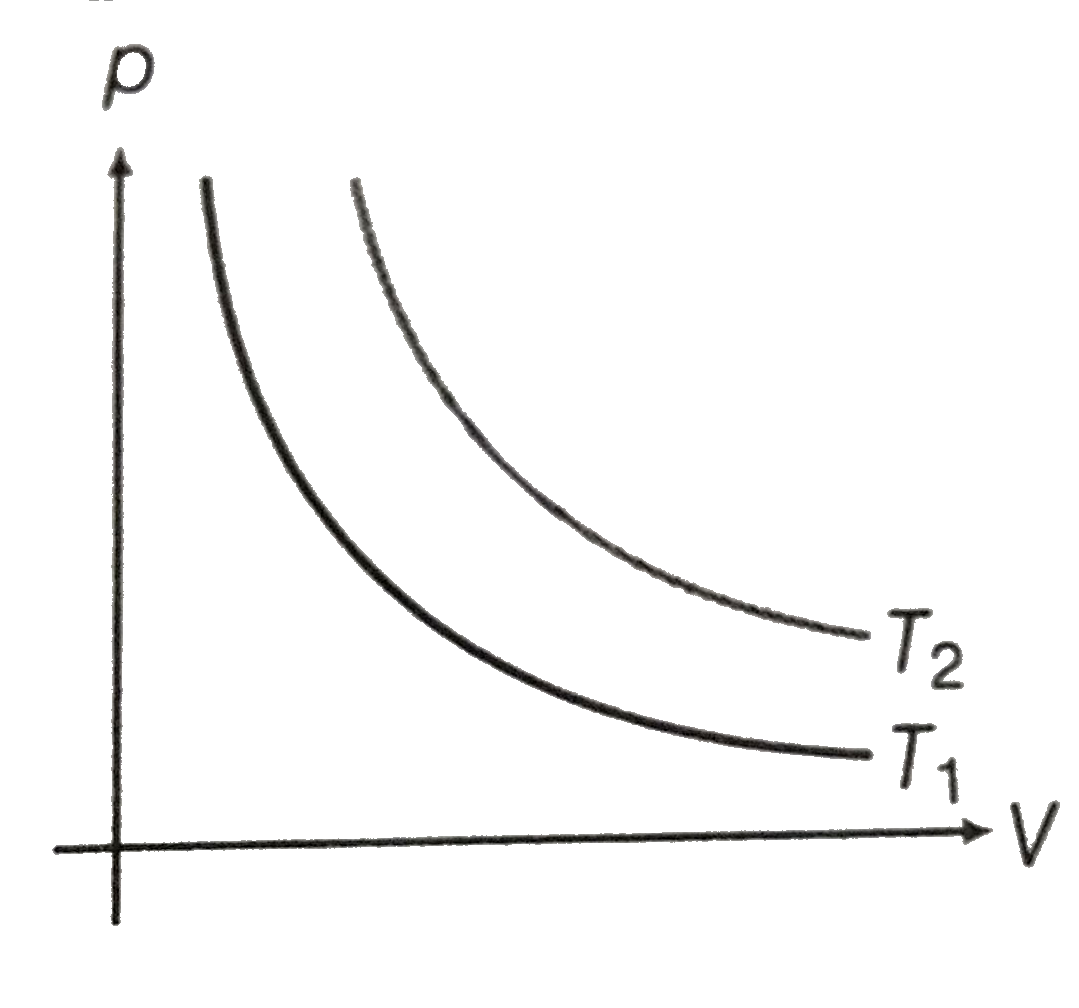
The ideal gas equation is,
pV=nRTorT=pVnRT∝pV, if number of moles of the gas are kept constant. Here mass of the gas is constant, which implies that number of moles are constant, I,e., T ∝ pV.
In the given diagram produco of p and V for t2 is more than T1 al all points (keeping either p or V same for both graphs). Hence, T2>T1
Topper's Solved these Questions
- THERMOMETRY THERMAL EXPANSION AND KINETIC THEORY OF GASESBOOK - DC PANDEY ENGLISHCHAPTER - THERMOMETRY THERMAL EXPANSION AND KINETIC THEORY OF GASESEXERCISE - Check point 14.1
10 Videos
- THERMOMETRY THERMAL EXPANSION AND KINETIC THEORY OF GASESBOOK - DC PANDEY ENGLISHCHAPTER - THERMOMETRY THERMAL EXPANSION AND KINETIC THEORY OF GASESEXERCISE - Check point 14.2
20 Videos
- SUPERPOSITION OF WAVESBOOK - DC PANDEY ENGLISHCHAPTER - SUPERPOSITION OF WAVESEXERCISE - Level 2 Subjective
8 Videos
- THERMOMETRY,THERMAL EXPANSION & KINETIC THEORY OF GASESBOOK - DC PANDEY ENGLISHCHAPTER - THERMOMETRY,THERMAL EXPANSION & KINETIC THEORY OF GASESEXERCISE - Level 2 Subjective
9 Videos
Similar Questions
Knowledge Check
The isothermal diagram of a gas at three different temperatures T1,T2andT3, is show in the given figure .Then
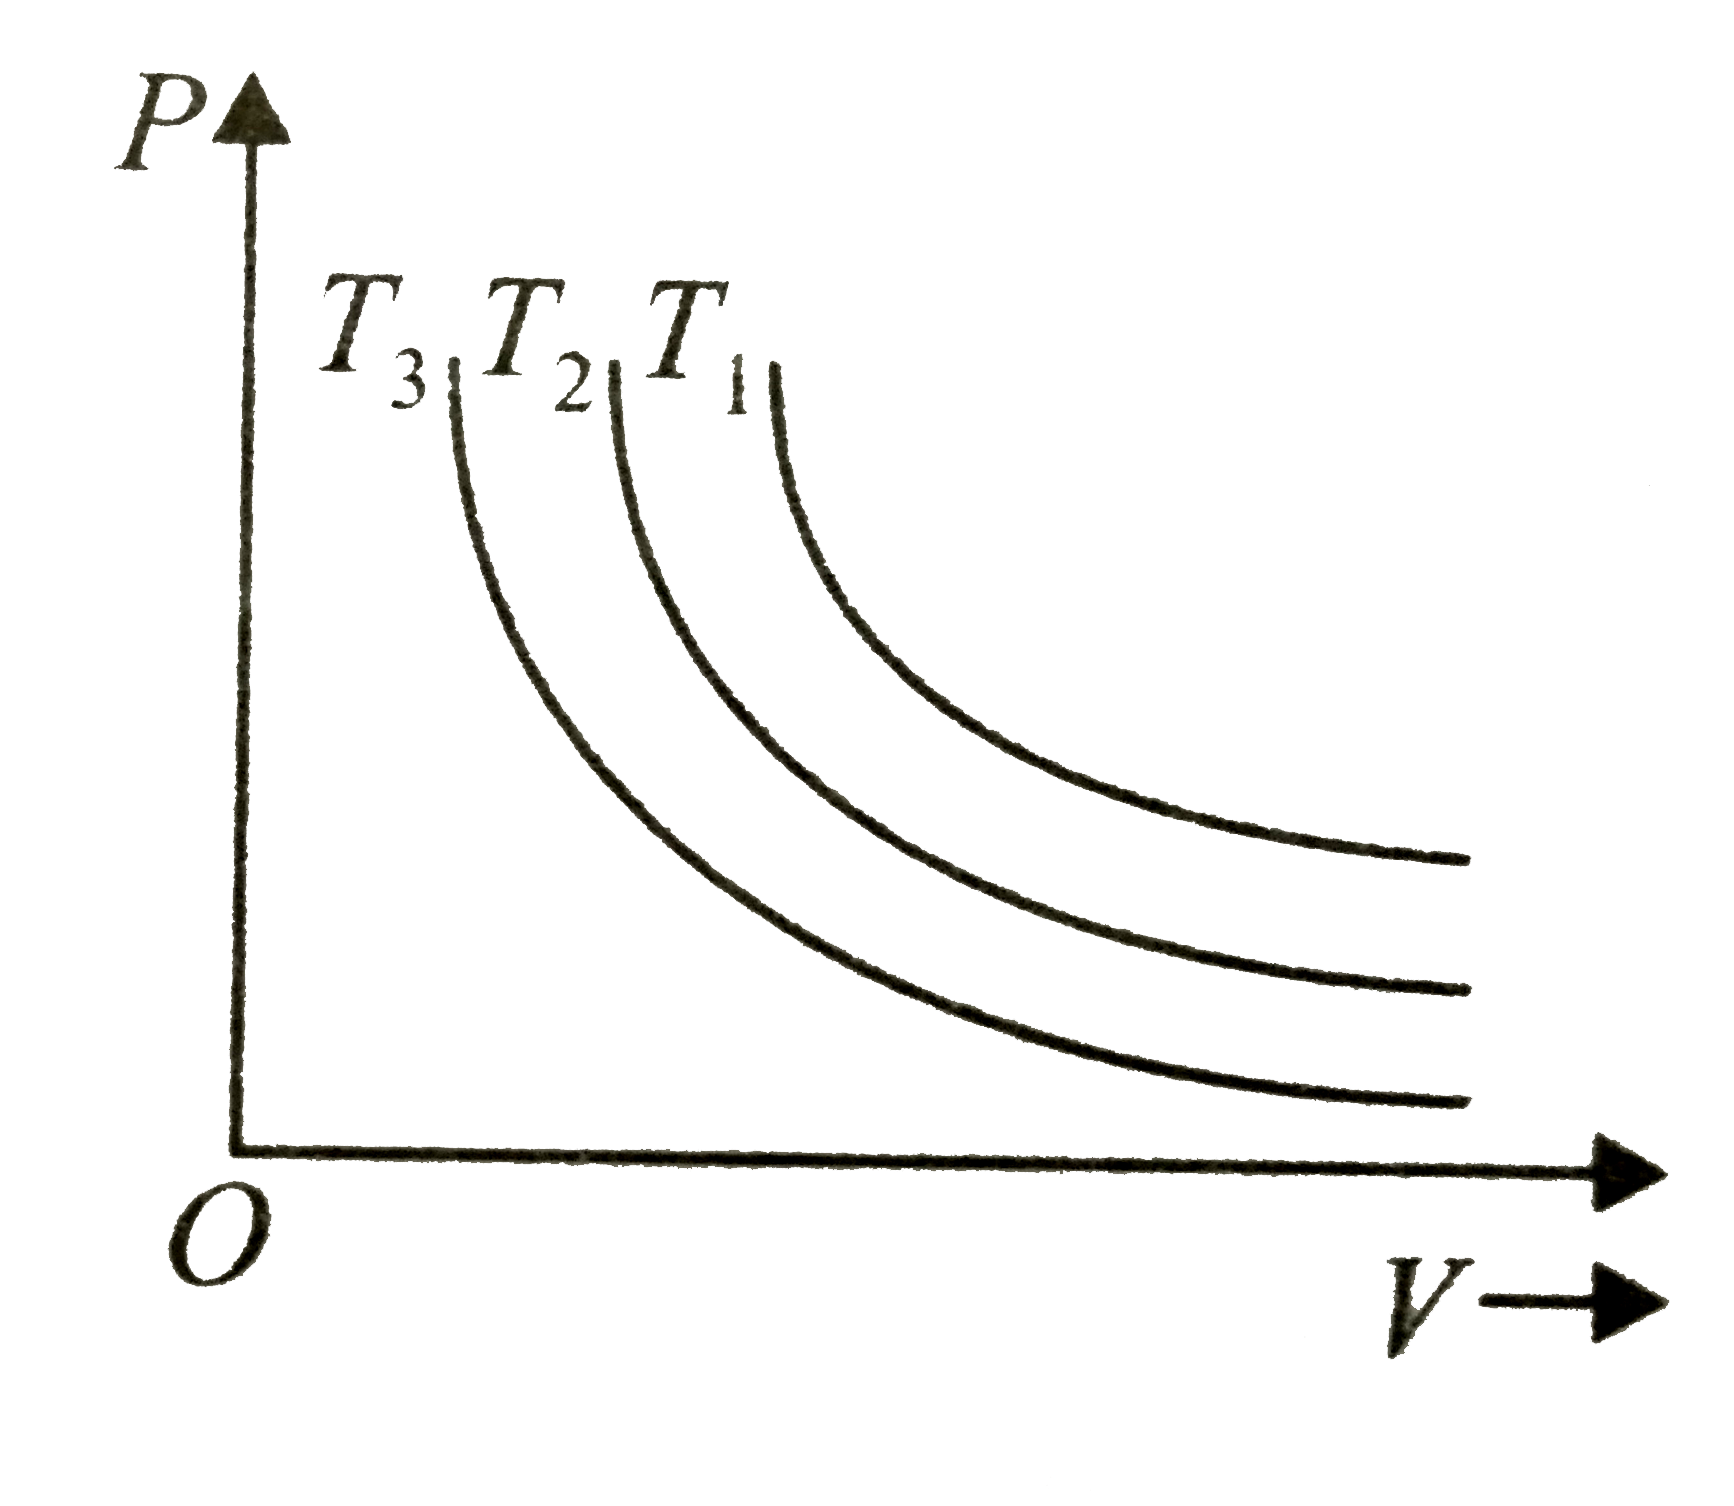 Aa.T1<T2<TBb. T1<T2>T3Cc.T1>T2>T3Dd.T1>T2<T3
The voltage V and current I v graphs for a conductor at two different temperatures T1andT2 are shown in the figure. The relation between T1andT2 is
 AT1>T2BT1<T2CT1=T2DT1=1T2
The stress-strain graph for a metallic wire is shown at two different temperature, T1 and T2 which temperature is high T1 or T2 ?
View SolutionThe density (ρ) versus pressure (P) graphs of a given mass of an ideal gas is shown at two temperatures T1andT2. Then relation between T1andT2 may be
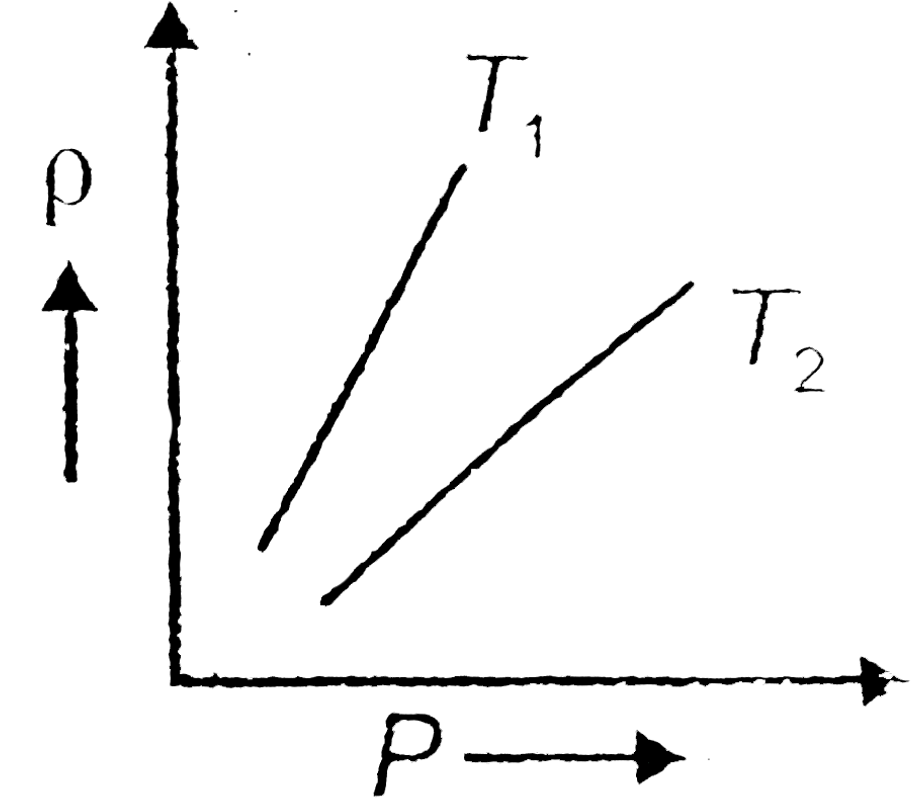
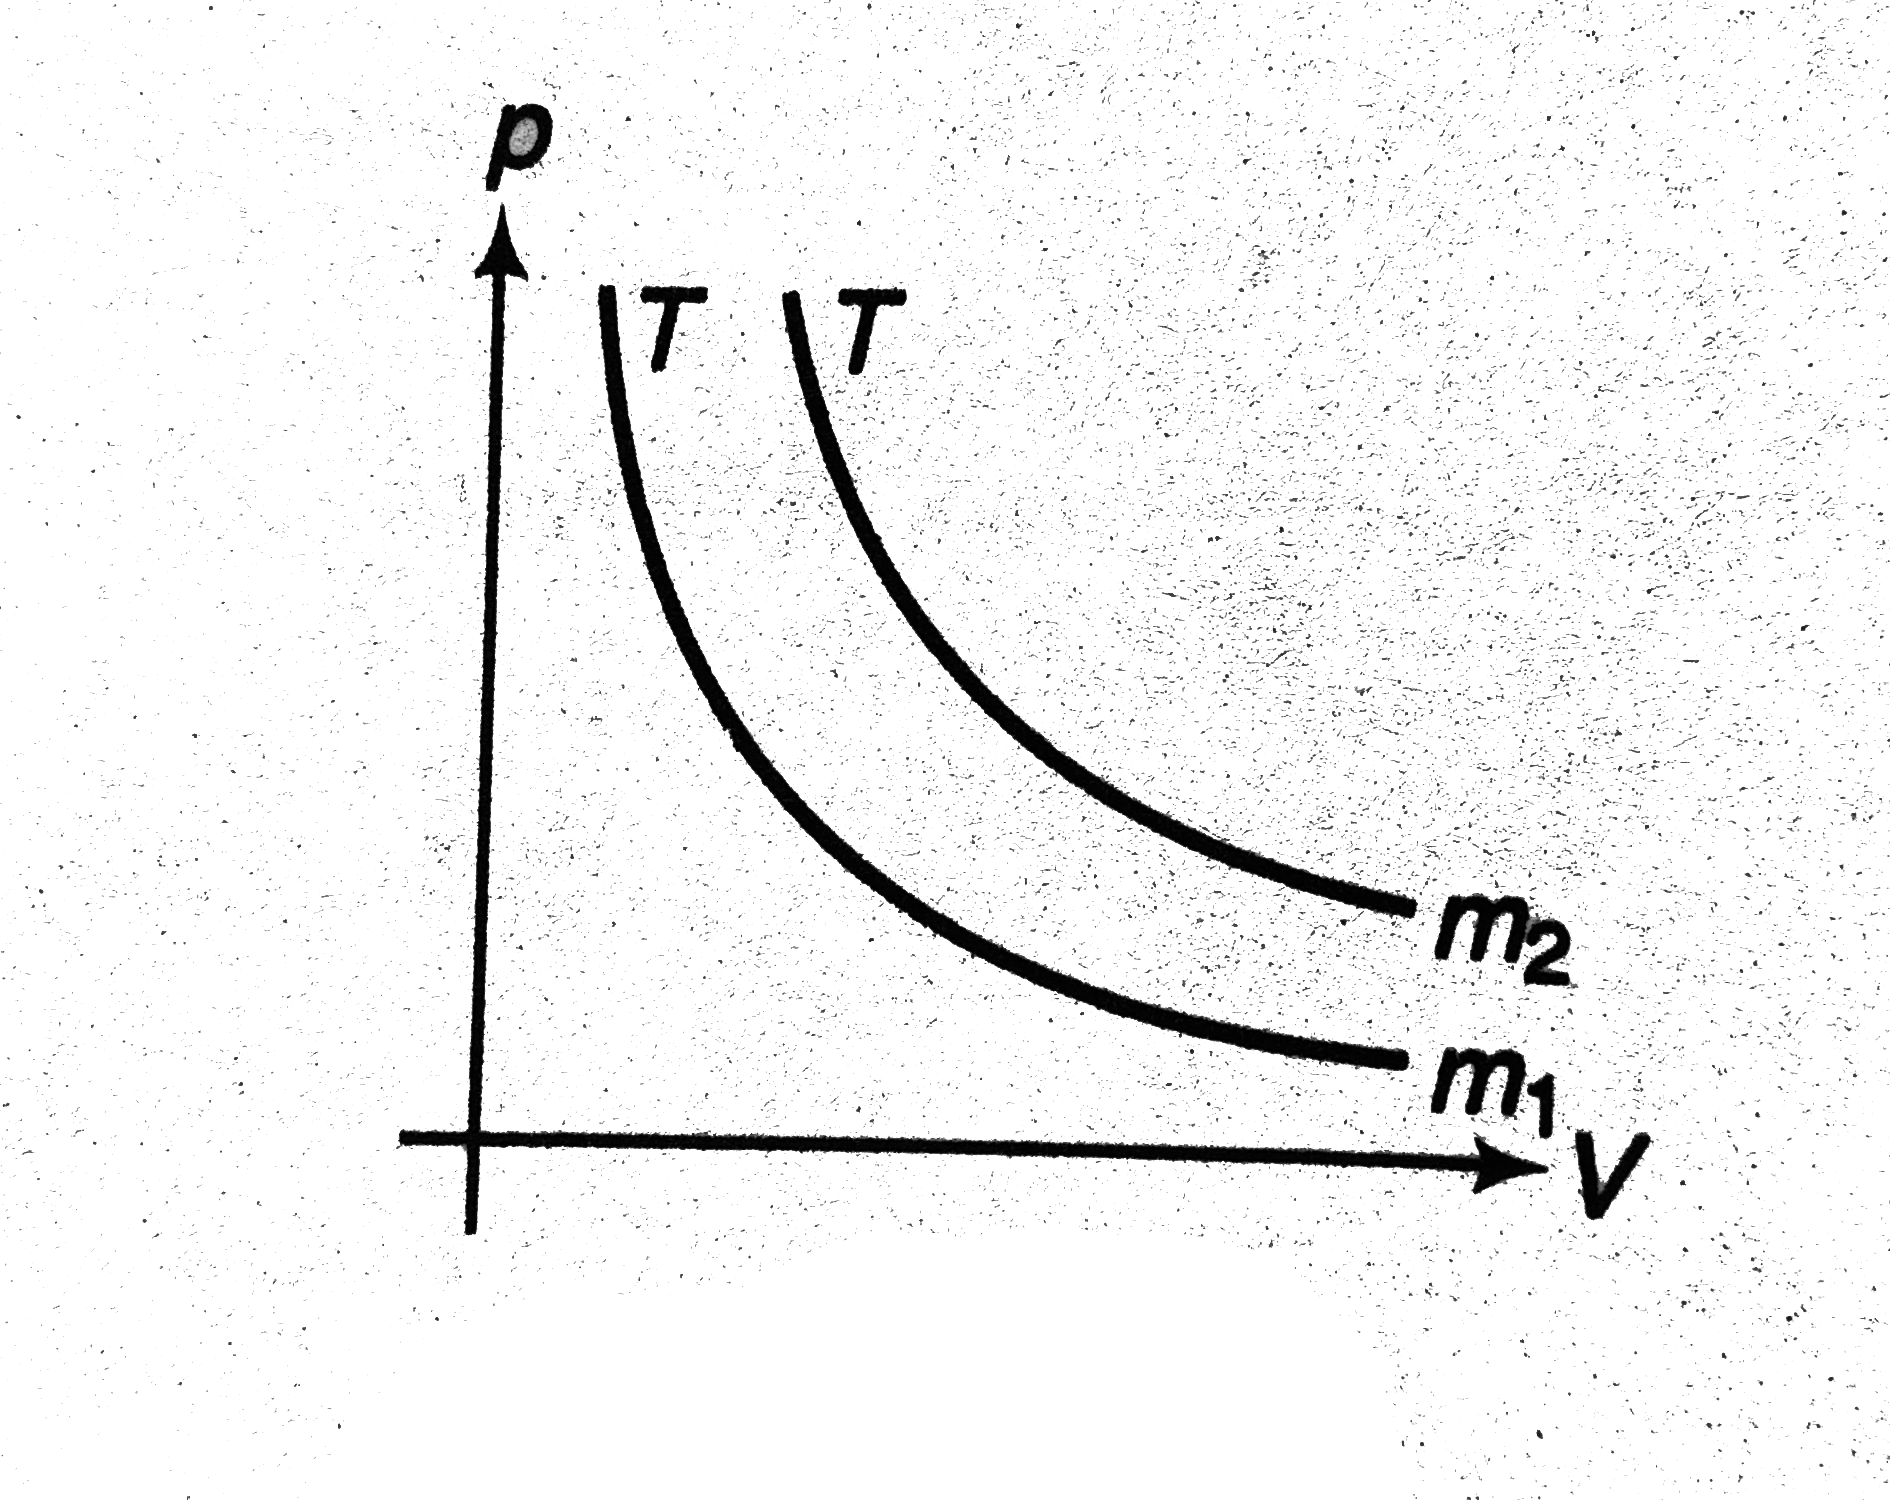
View SolutionThe p−V diagram of two different masses m1 and m2 are drawn (as shown) at constant temperature (T).
View SolutionAssertion : Current versus potential difference (i-V) graph for a conductor at two different temperatures T1 and T2 is shown in figure. Hence T1>T2.
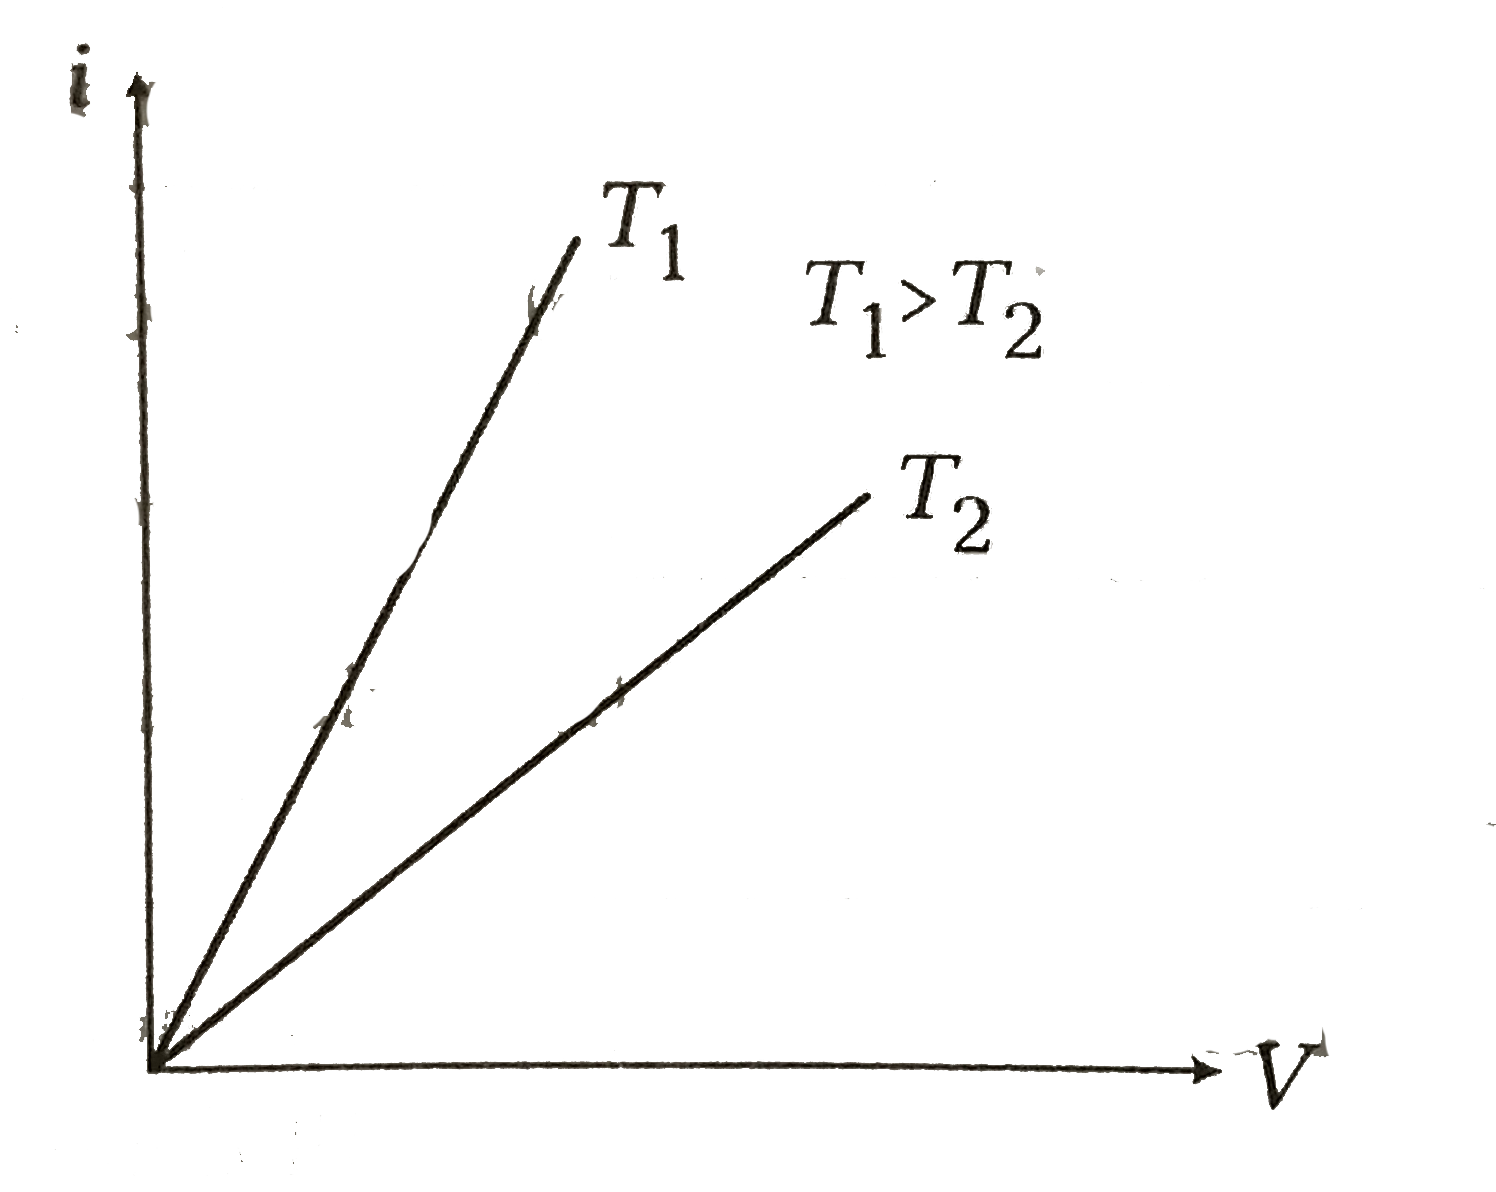
Reason : Resistance of a conductor increases with rise in temperature.
View SolutionConsider the reversible isothermal expansion of an ideal gas in a closed system at two different temperatures T1 and T2(T1<T2). The correct graphical depiction of the dependence of work done (w) on the final volume (V) is:
View SolutionThree Carnot engines operate in series between a heat source at a temperature T1 and a heat sink at temperature T4 (see figure). There are two other reservoirs at temperature T2andT3, as shown, with T1>T2>T3>T4. The three engines are equally efficient if :

View Solution
 .
. .
.