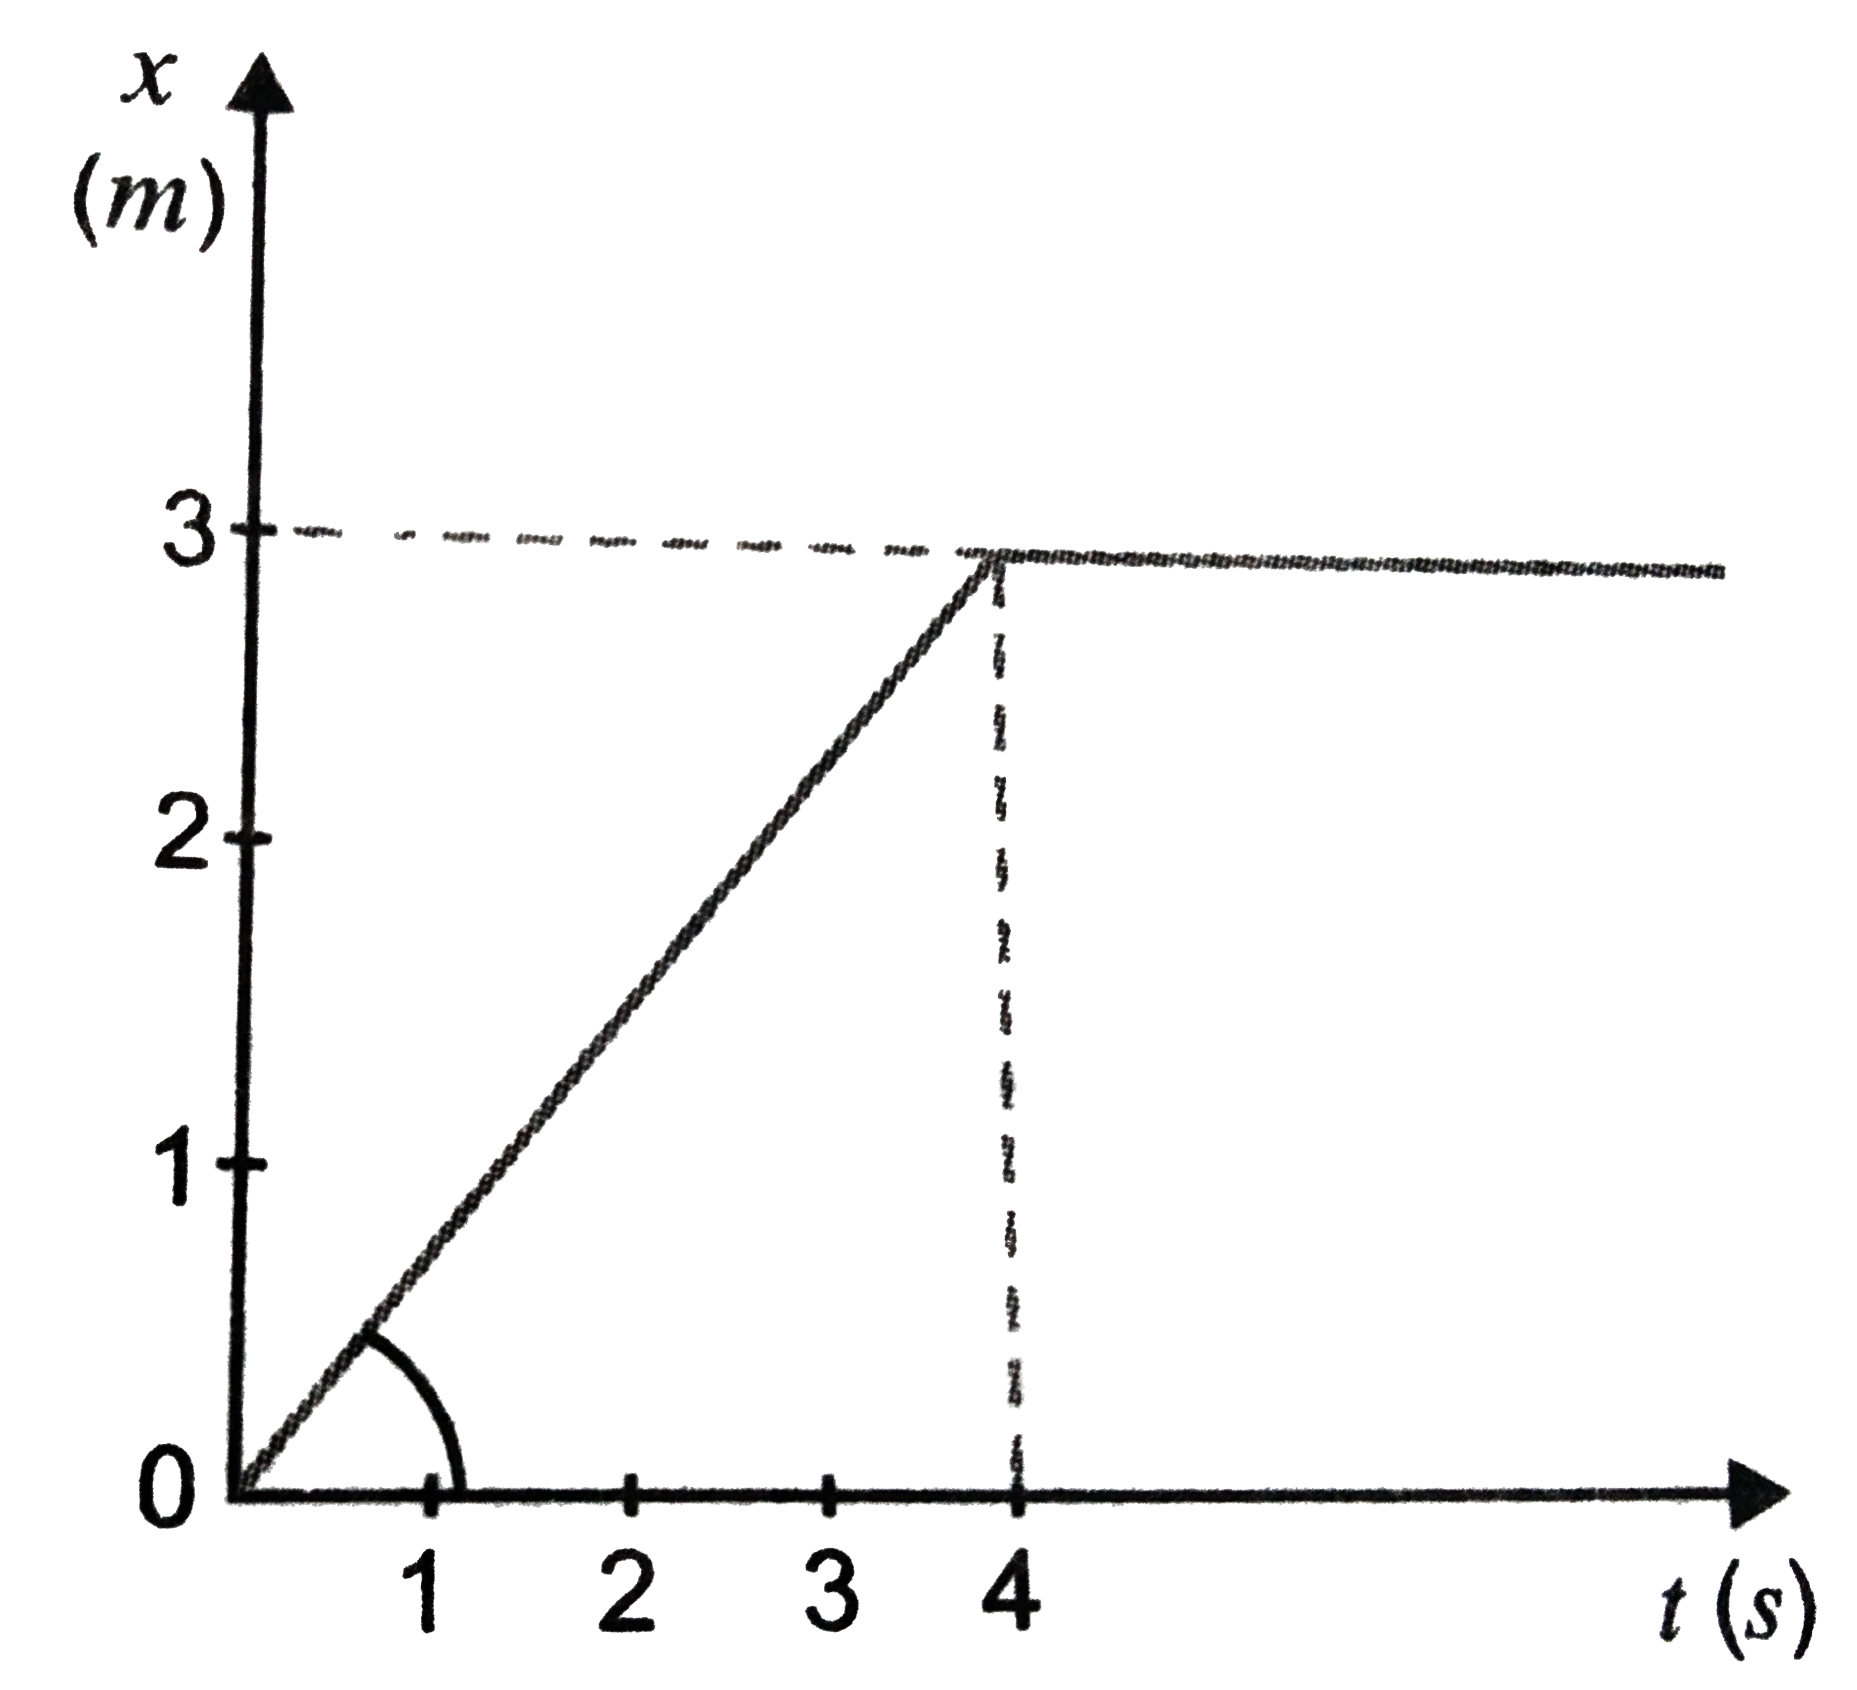
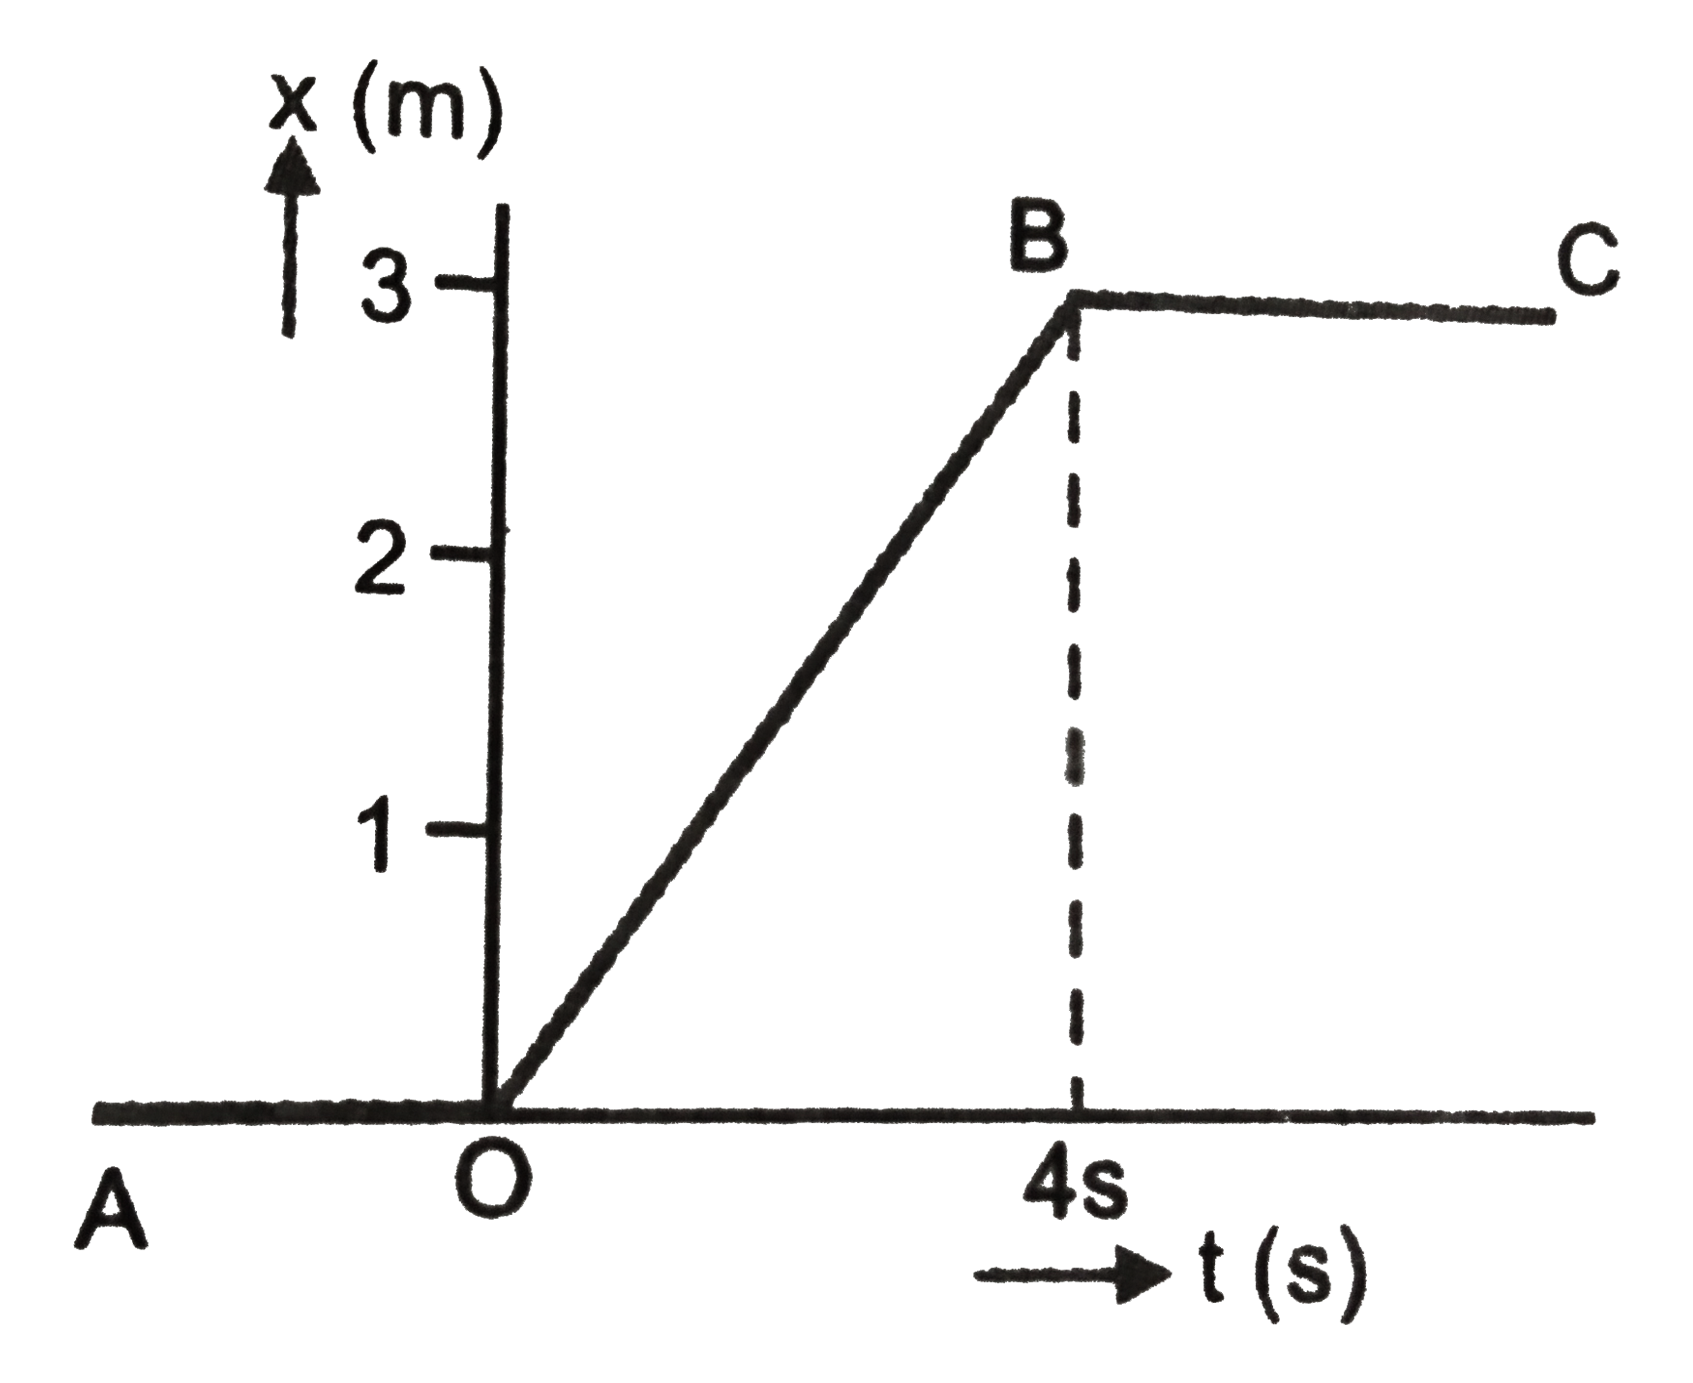
The position time graph of a body of mass 2kg is as given in What is the impulse on the body at t=0 s and t=4s ?
 .
.
Given , mass of the body (m) = 2kg
From the position- time graph , the body is at x = 0 when t = 0 i.e., body is at rest .
∴ impulse at t = 0 , s = 0 is zero
From t = 0 s to t = 4 s , the position-time graph is a straight line , which shows that body moves with uniform velocity.
Beyond t = 4s , the graph is a straight line parallel to time axis , i.e., body is at rest (v=0).
Velocity of the body = slope of position-time graph
= tan θ=34 m/s
Impulse (at t = 4 s) = change in momentum
= mv-mu
= m(v-u)
= 2(0−34)
= −32kg−m/s=−1.5 kg-m/s
Topper's Solved these Questions
- LAWS OF MOTIONBOOK - NCERT EXEMPLARCHAPTER - LAWS OF MOTIONEXERCISE - Short answer type questions
6 Videos
- LAWS OF MOTIONBOOK - NCERT EXEMPLARCHAPTER - LAWS OF MOTIONEXERCISE - Long answer Type Questions
9 Videos
- LAWS OF MOTIONBOOK - NCERT EXEMPLARCHAPTER - LAWS OF MOTIONEXERCISE - Mutiple Choice Questions (More than One Options)
6 Videos
- KINETIC THEORYBOOK - NCERT EXEMPLARCHAPTER - KINETIC THEORYEXERCISE - Multiple Choice Questions (MCQs)
31 Videos
- MECHANICAL PROPERTIES OF FLUIDSBOOK - NCERT EXEMPLARCHAPTER - MECHANICAL PROPERTIES OF FLUIDSEXERCISE - Long Answer Type Questions
3 Videos
Similar Questions
Knowledge Check
The position-time graph of a particle of mass 0.1 kg is shown. The impulse at t = 2s is :
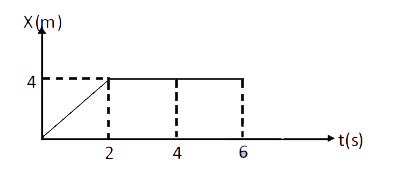 A0.2kgms−1B0.02kgms−1C0.1kgms−1D0.4kgms−1
In the figure given, the position-time graph of a particle of mass 0.1 kg is shown the impulse at t = 2s is
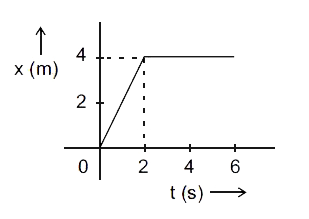 A0.2 kg m/sB−0.2 kg m/sC0.1 kg m/sD−0.4 kg m/s
Position time graph of a particle of mass 2 kg is shown in figrure. Total work done on the particle from t=0 to t=4s is
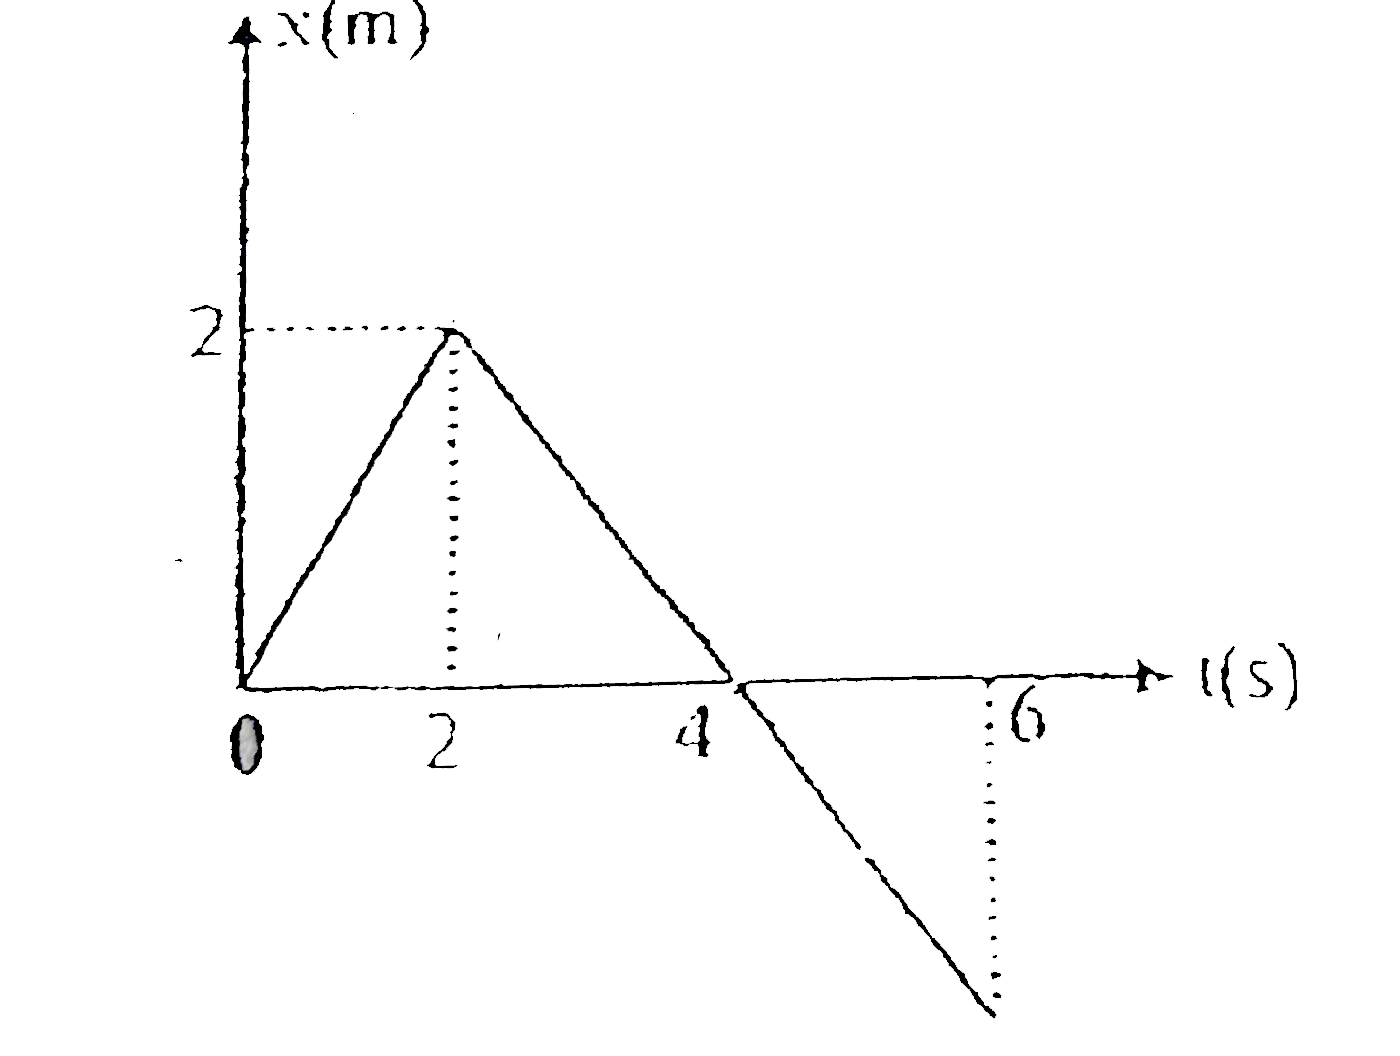 A8 JB4 JC0 JDCan't be determined
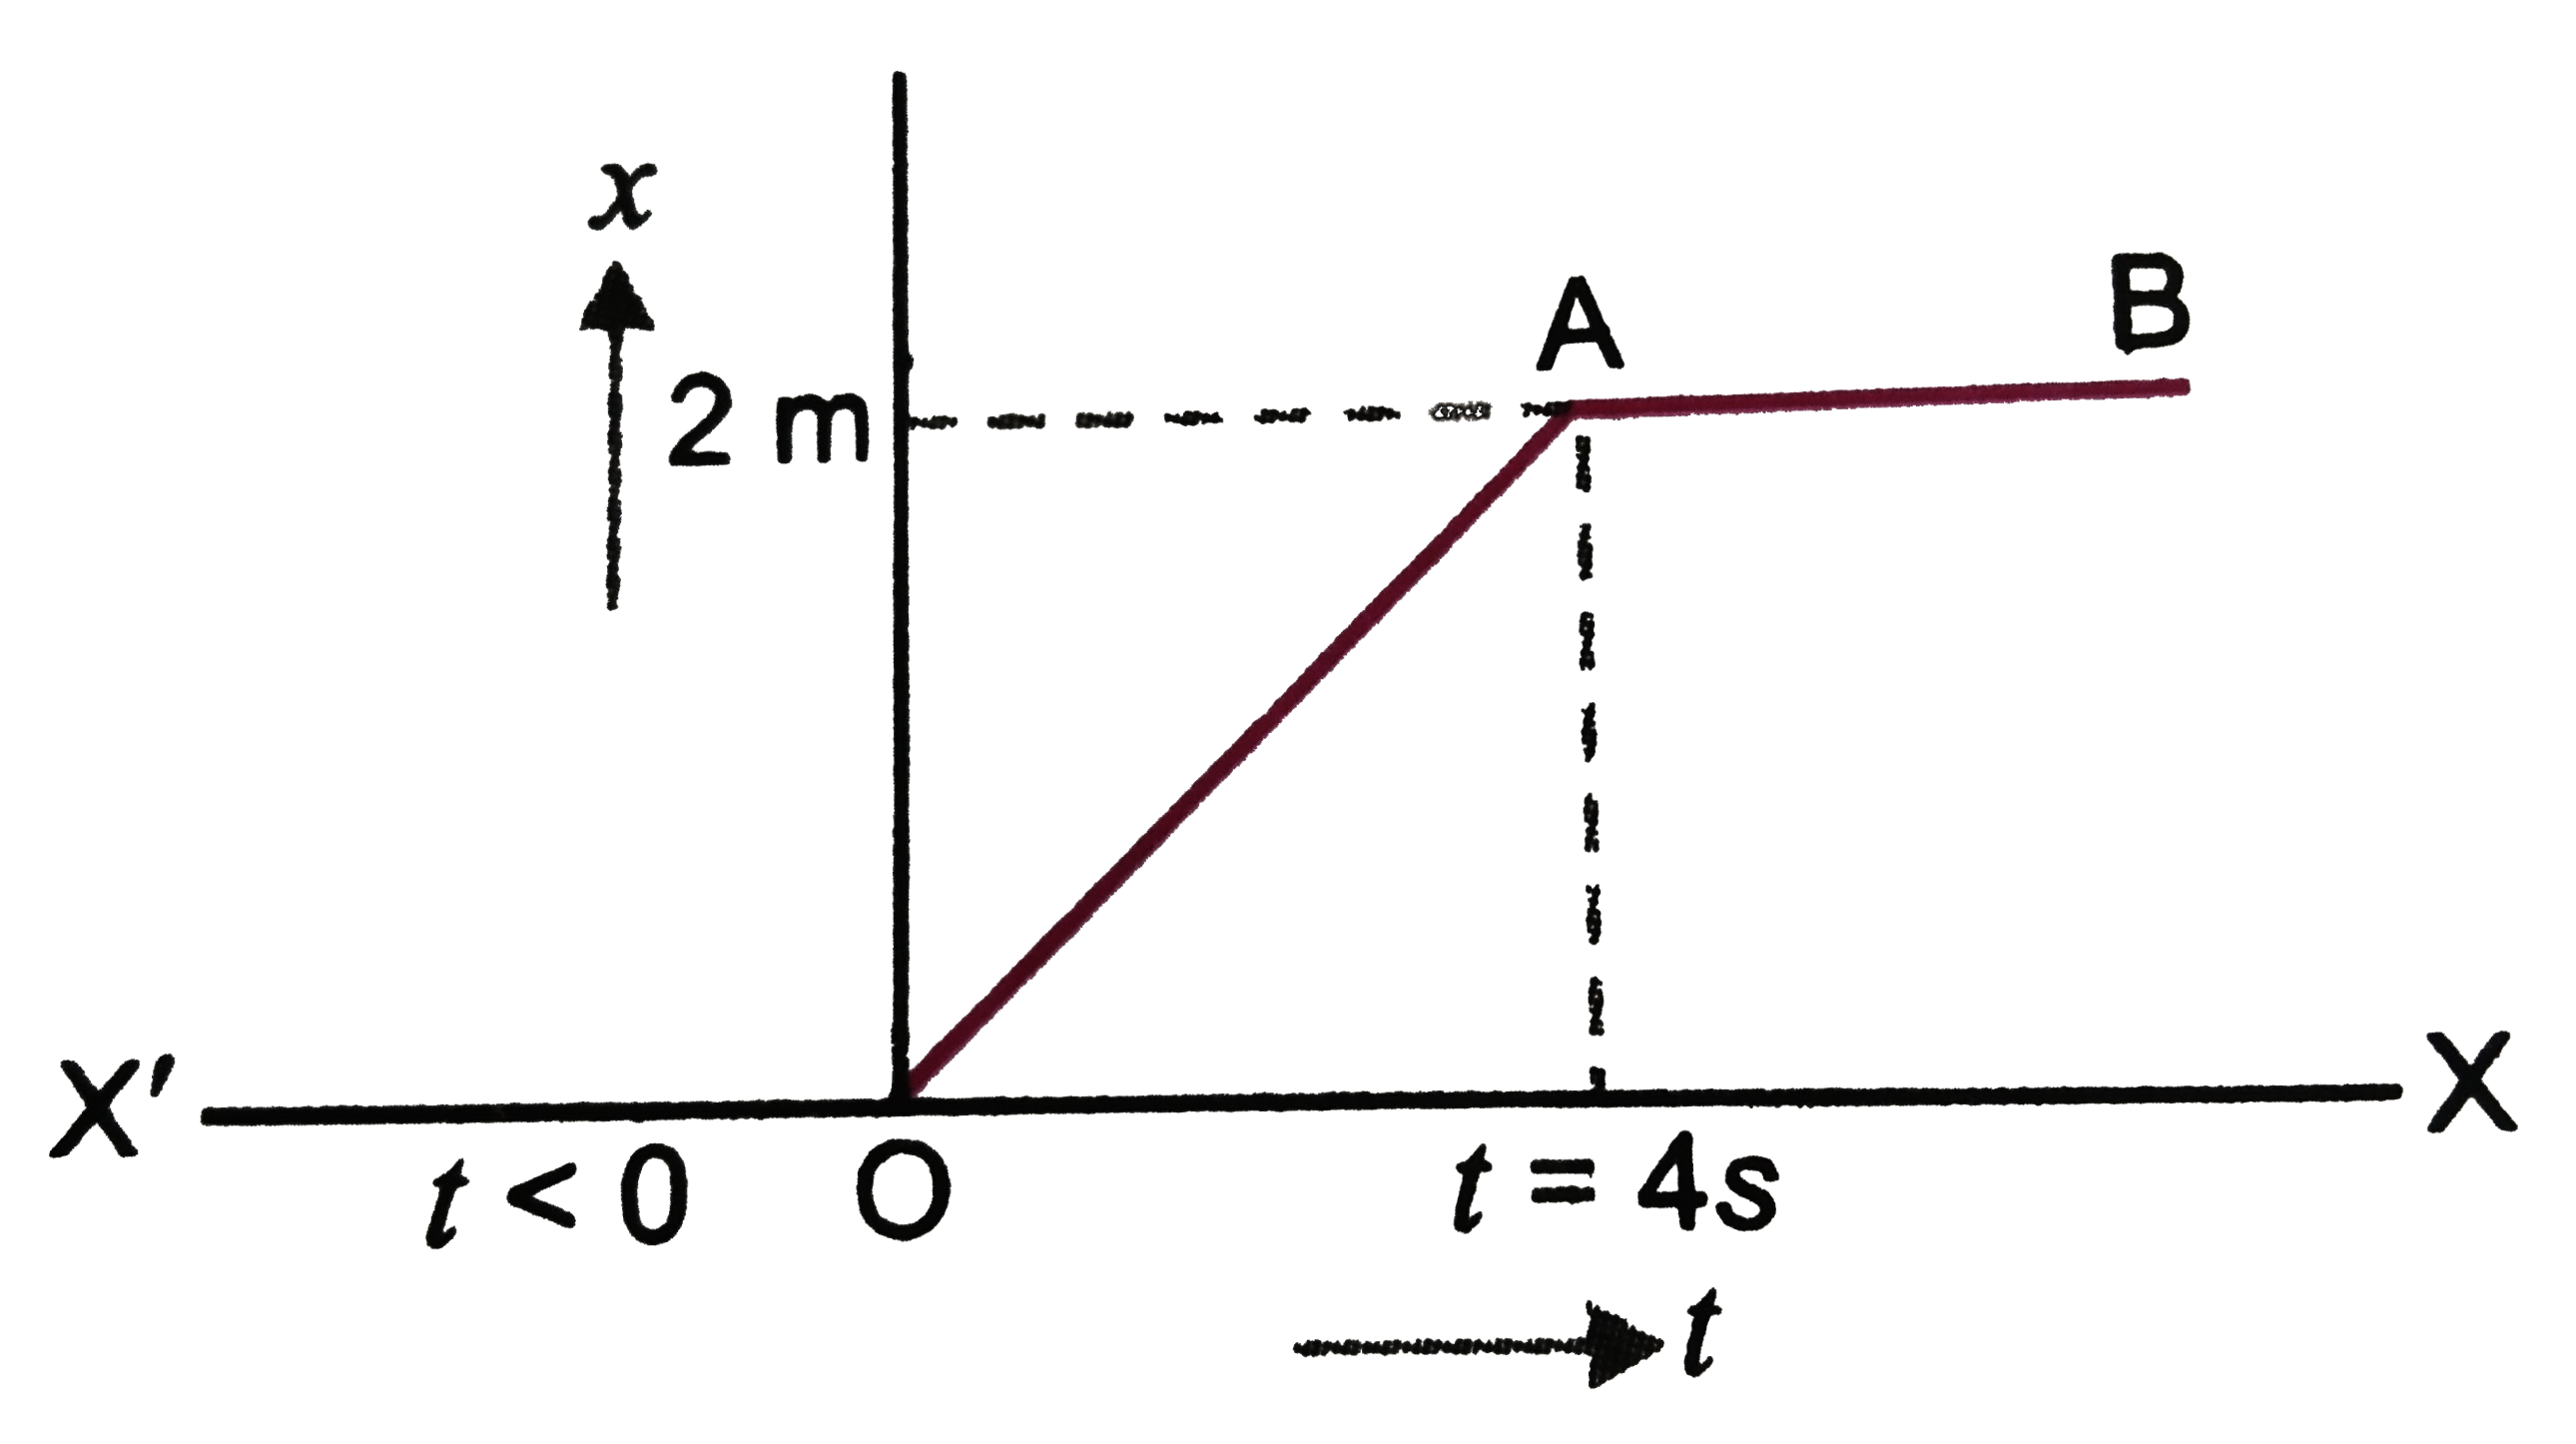
Shown the position time graph of a particle of mass 4 kg What is the force on the particle for t<0,0<t<4s motion only
 .
.
View SolutionFig. shows the position-time graph of a particle of mass 4 kg. What is the (i) force acting on the particle for t<0,t<4s,0<t<4s? (ii) impulse at t = 0 and t = 4 s? Assume that the motion is one dimensional.
View SolutionFig. shows the position-time graph of a particle of mass 4 kg. What is the (i) force acting on the particle for t<0,t<4s,0<t<4s? (ii) impulse at t = 0 and t = 4 s? Assume that the motion is one dimensional.
View SolutionShows position time graph of a particle of mass 100g Find the impulse at t=0 and at t=4s
 .
.
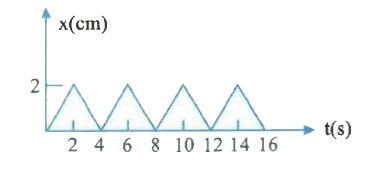
View SolutionThe position-time graph of a body of mass 0.04kg is shown in the figure. The time between two consecutive impulses received by the body and the magnitude of each impulse is
View Solution
