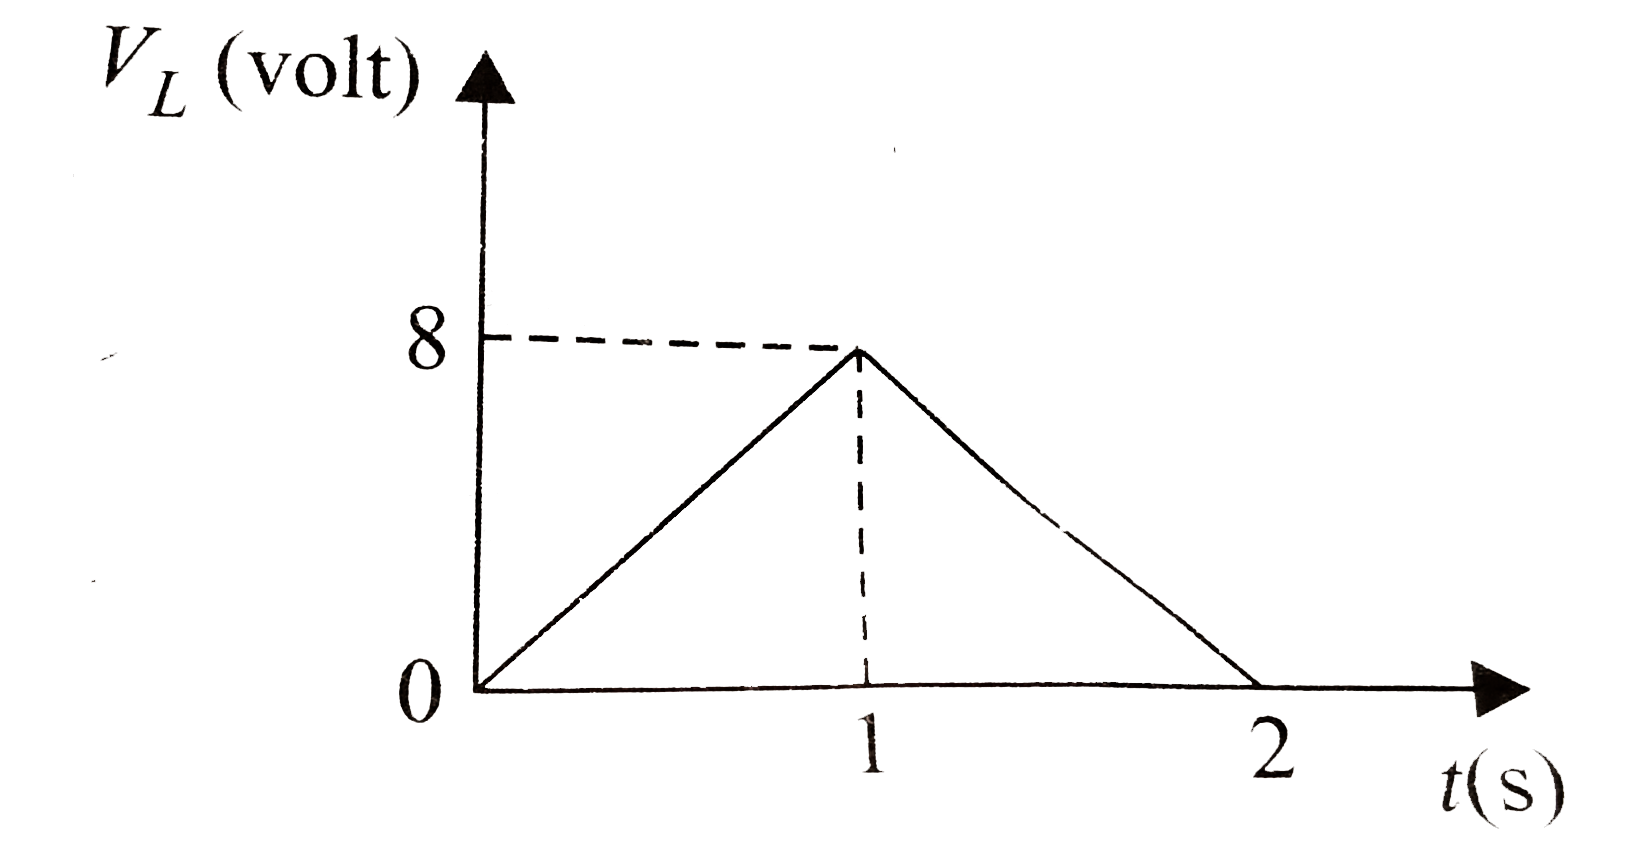
The potential difference across a 2-H inductor as a function of time is shown in Fig. At time t = 0, current is zero.
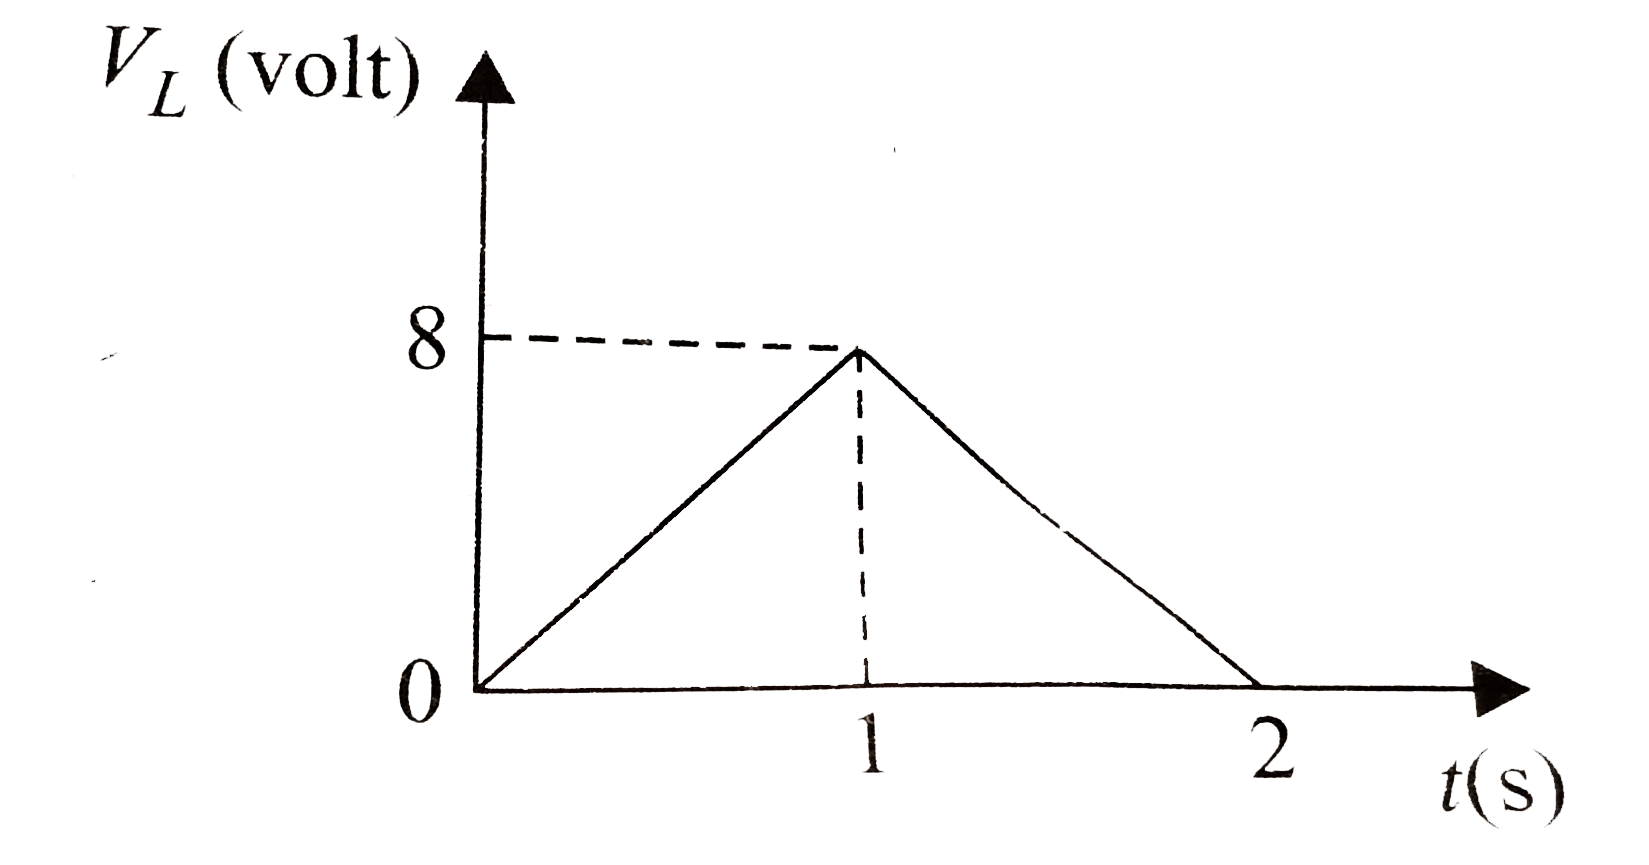
The variation of current versus time is
a straight line
a parabola
a hyperbola
expotential
The correct Answer is:B
For t≤1s
VL=8t
Ldi=VLdt
∫Ldi=∫8tdt
Li=8t22=4t2
i=2t2
so current versus time graph is a parabola
For 1s≤t≤2s ltbtgt VL=16−8t
∫Ldi=∫(16−8t)dt
Li=16t−8t22
i=8t−2t2
so i-t graph in a parabola.
so, for entire time shown, i-t graph in a parabola.
Topper's Solved these Questions
- MISCELLANEOUS VOLUME 5BOOK - CENGAGE PHYSICS ENGLISHCHAPTER - MISCELLANEOUS VOLUME 5EXERCISE - Integer
12 Videos
- MISCELLANEOUS VOLUME 5BOOK - CENGAGE PHYSICS ENGLISHCHAPTER - MISCELLANEOUS VOLUME 5EXERCISE - Multiple Correct
34 Videos
- MISCELLANEOUS VOLUME 3BOOK - CENGAGE PHYSICS ENGLISHCHAPTER - MISCELLANEOUS VOLUME 3EXERCISE - True and False
3 Videos
- NUCLEAR PHYSICSBOOK - CENGAGE PHYSICS ENGLISHCHAPTER - NUCLEAR PHYSICSEXERCISE - ddp.5.5
14 Videos
Similar Questions
The potential difference across a 2-H inductor as a function of time is shown in Fig. At time t = 0, current is zero.
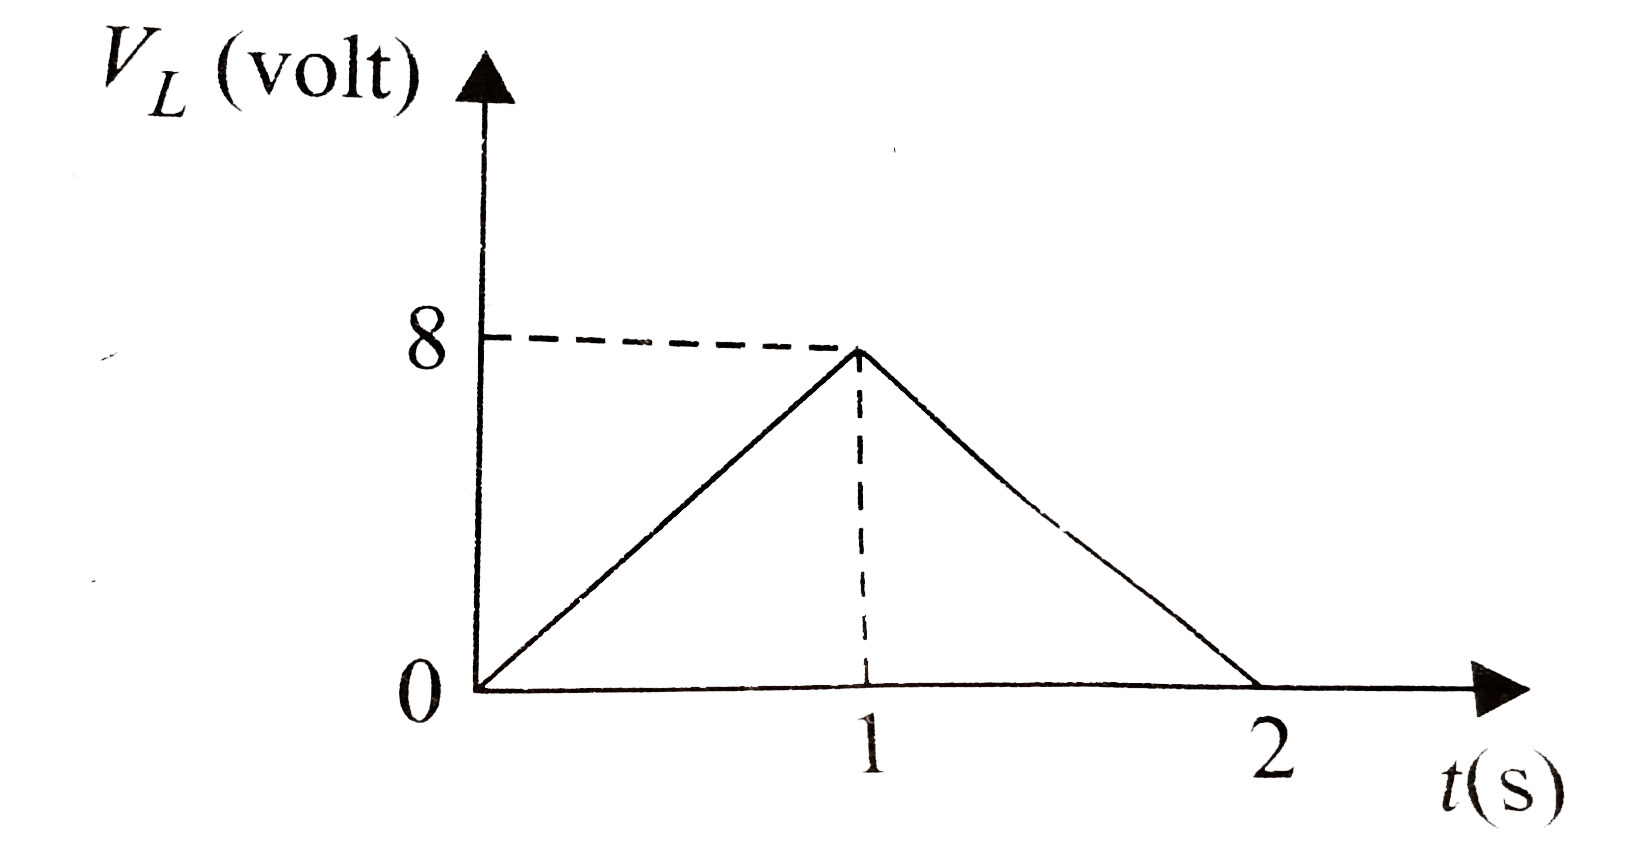
Current at t = 1 s is
View SolutionThe potential difference across a 10H inductor as a function of time is shown in the figure. At t=0 current is zero. Then
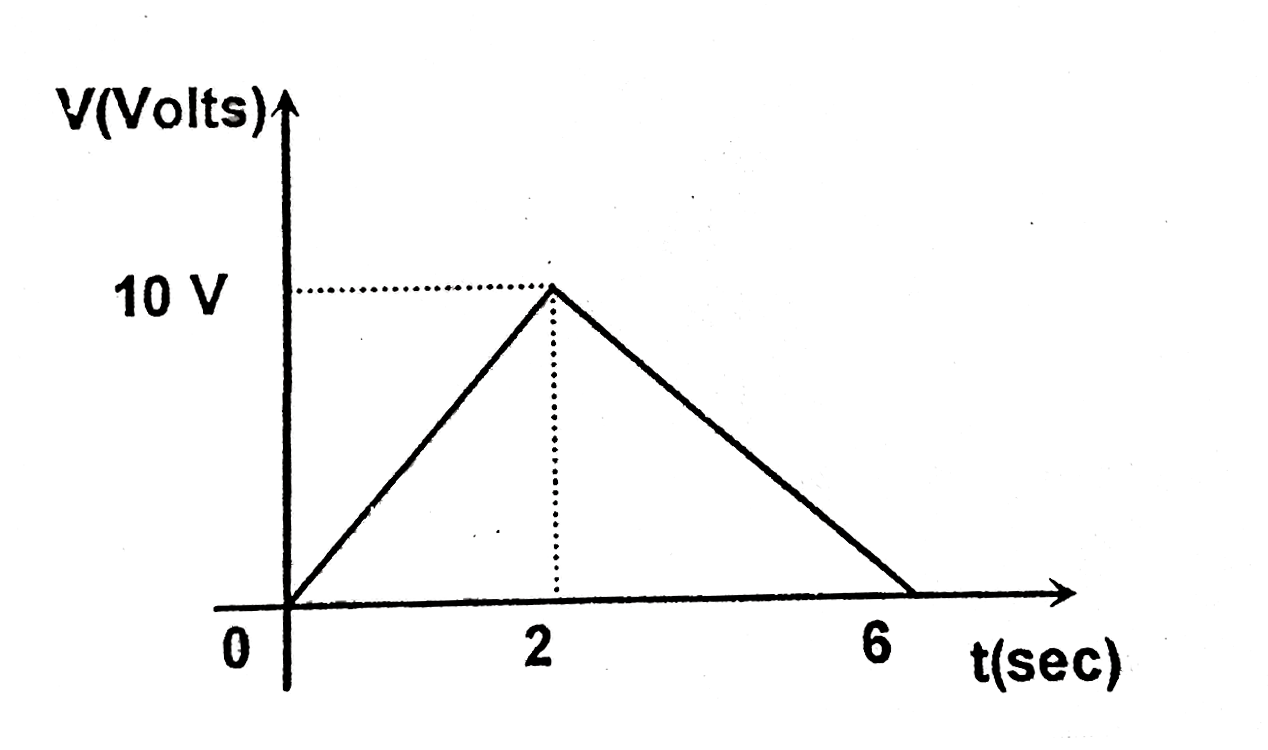
View SolutionThe potential difference across a 2H inductor as a function of time is shown in figure. At time t=0, current is zero
Current t=2 second is
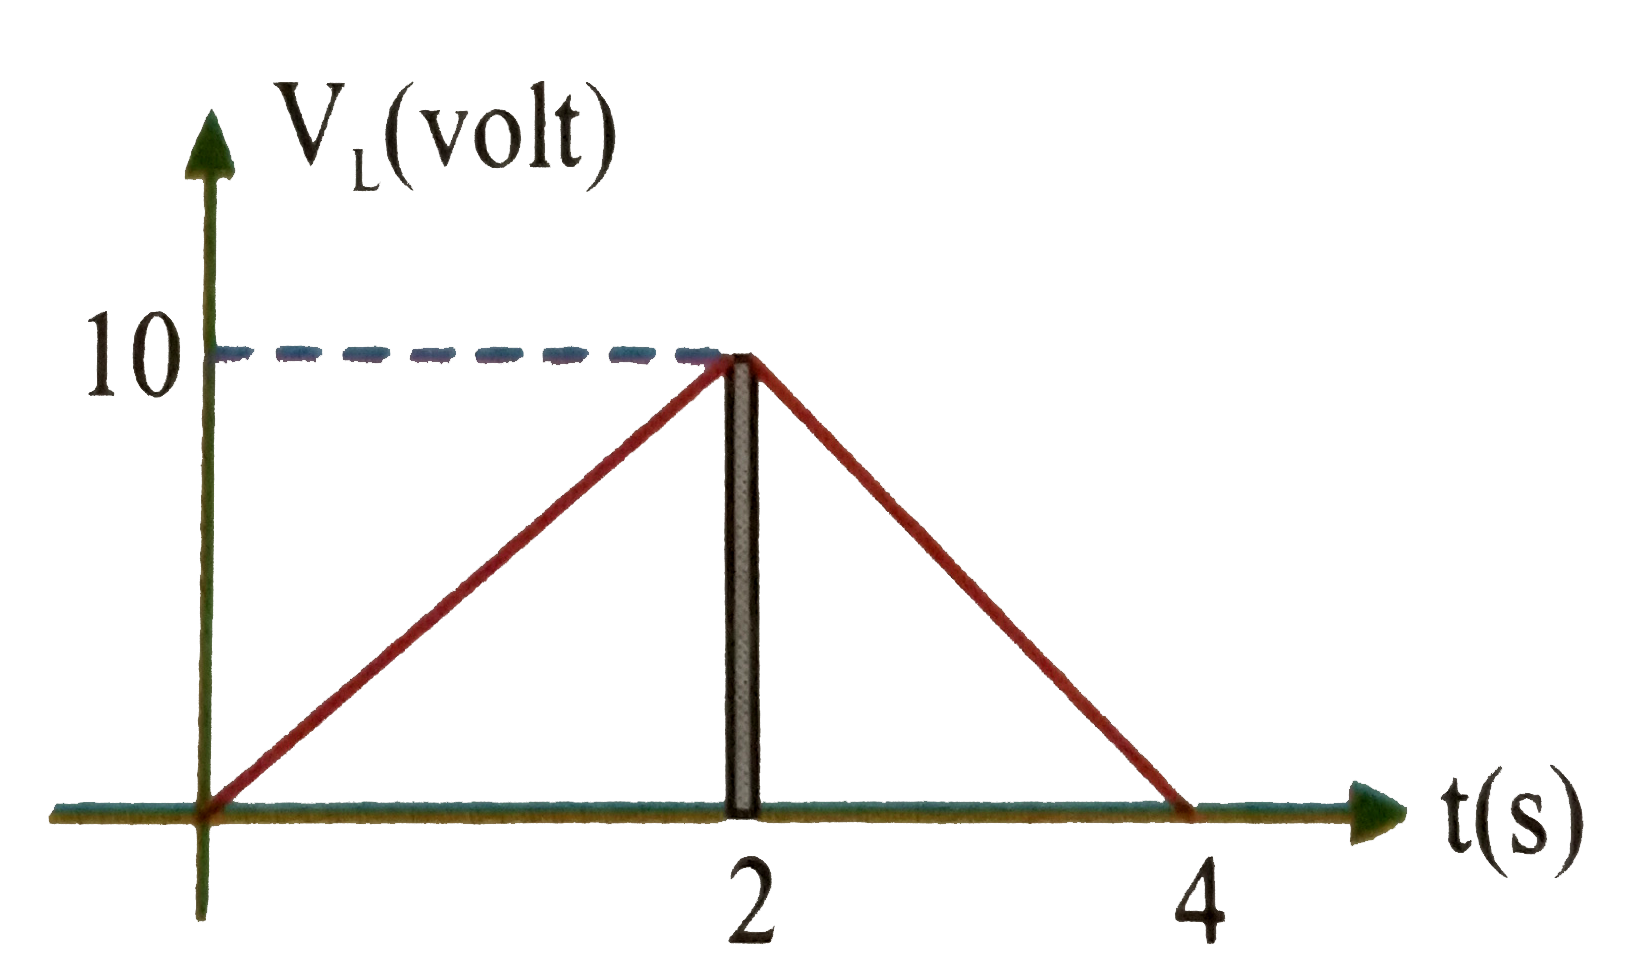
View SolutionThe potential difference across a 2-H inductor as a function of time is shown in Fig. At time t=0, current is zero.
Area under VL−t graph gives
View SolutionThe potentiak difference across a 2H inductor as a function of time is shown in the figure. At time t=0, current is zero.
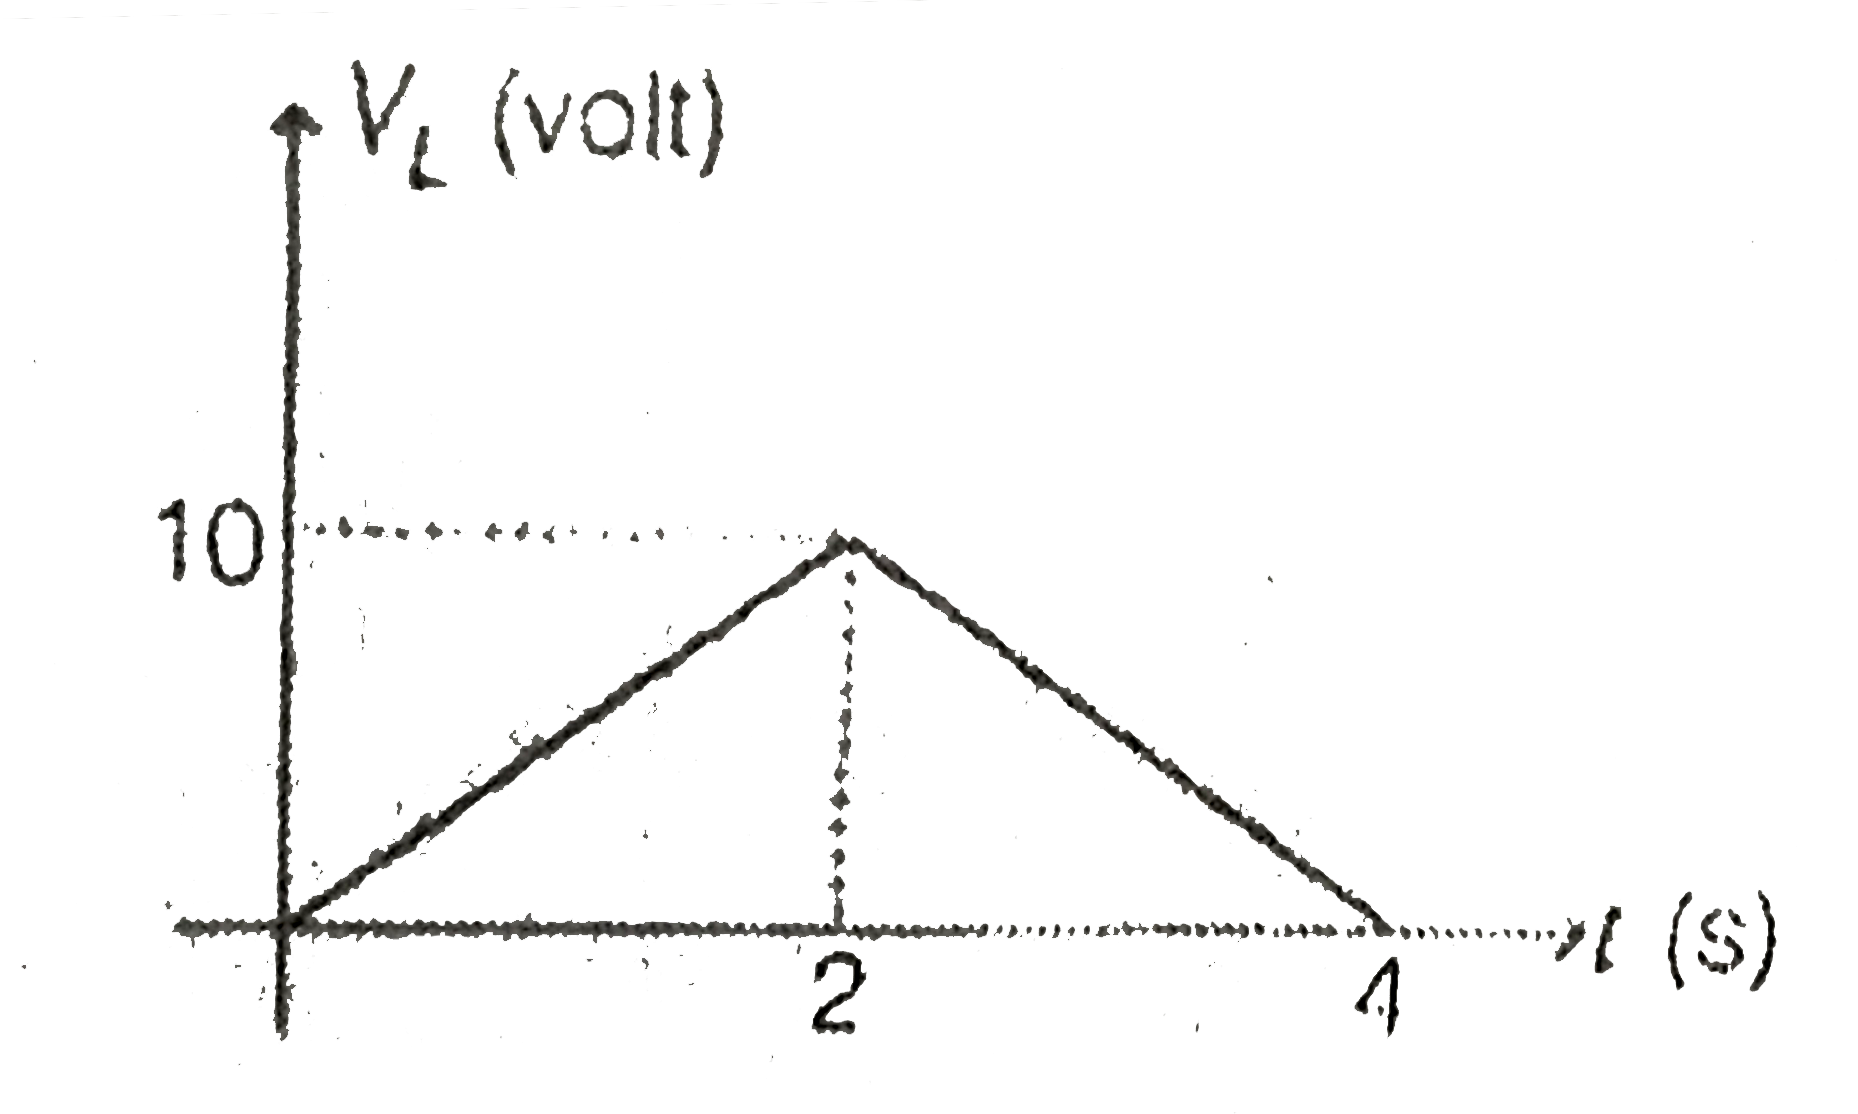
Current versus time graph across the inductor will be
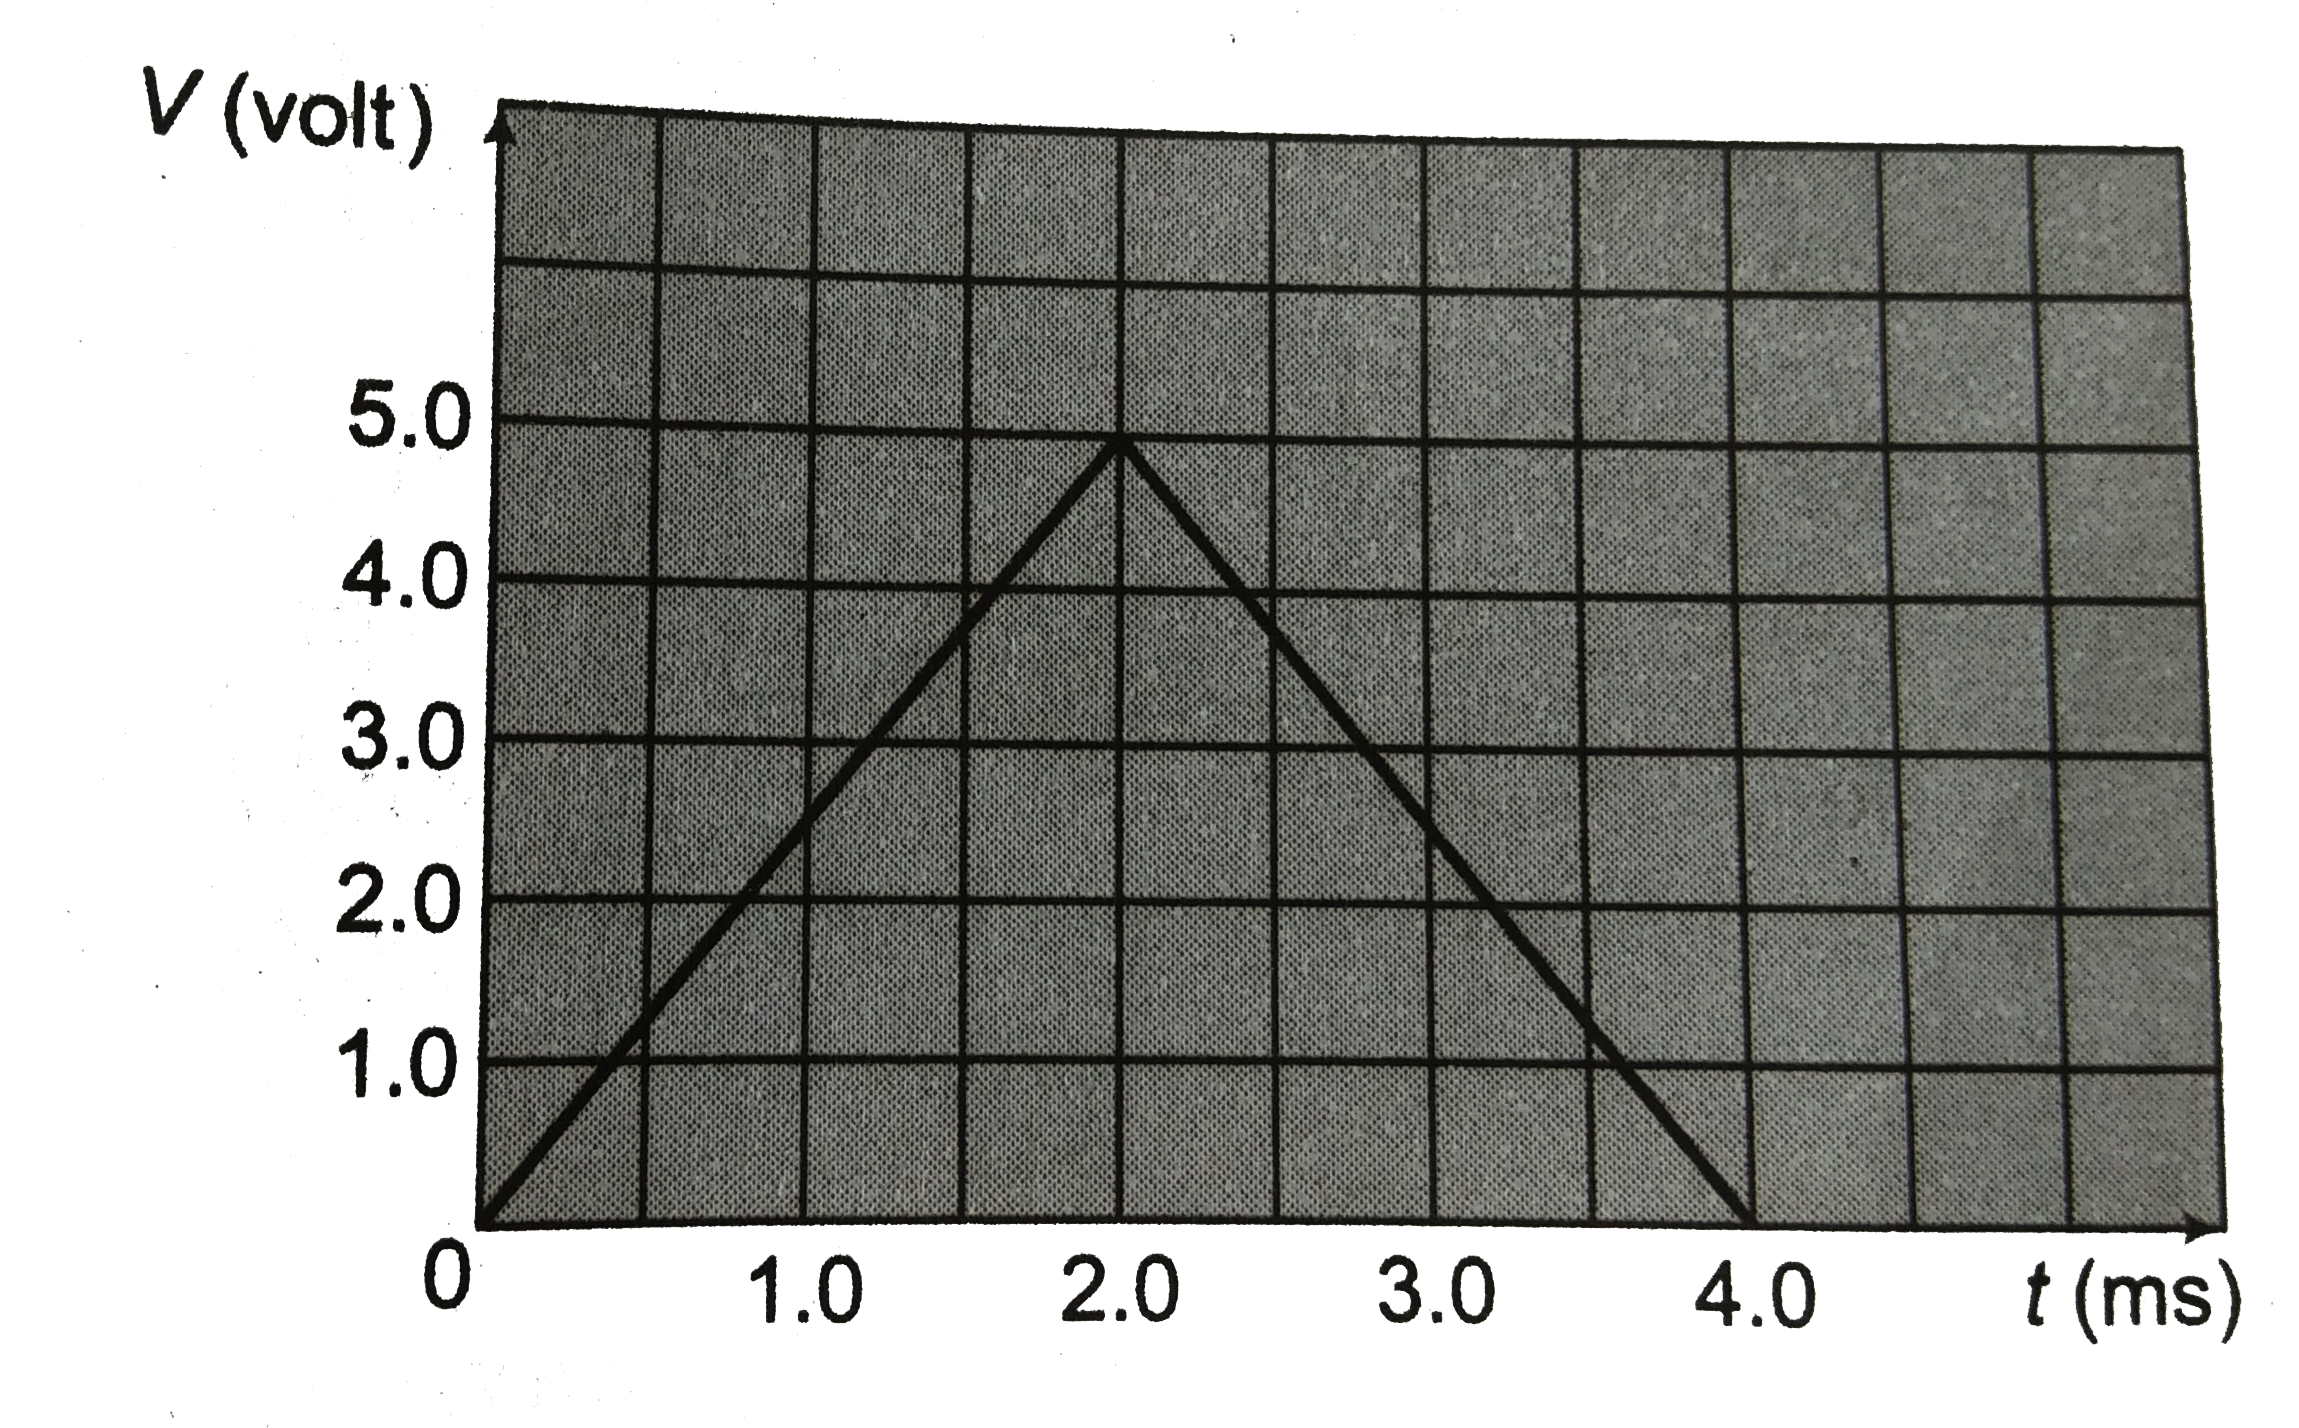
View SolutionThe potential difference across a 150mH inductor as a function of time is shown in figure. Assume that the initial value of the current in the inductor is zero. What is the current when t=2.0ms? and t=4.0ms ?
View SolutionThe potential difference across a 4 H inductor vary with time is as shown. The current is Zero at t=0, Then the current at time t=2s

View SolutionThe charge on a capacitor plate in a circuit, as a function of time, is shown in the figure. What is the value of current at t=4s?
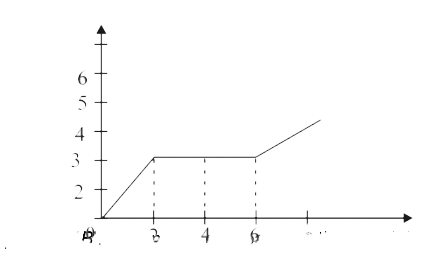
View SolutionThe charge on a capacitor plate in a cirucuit, as a function of time,is shown in the figure :
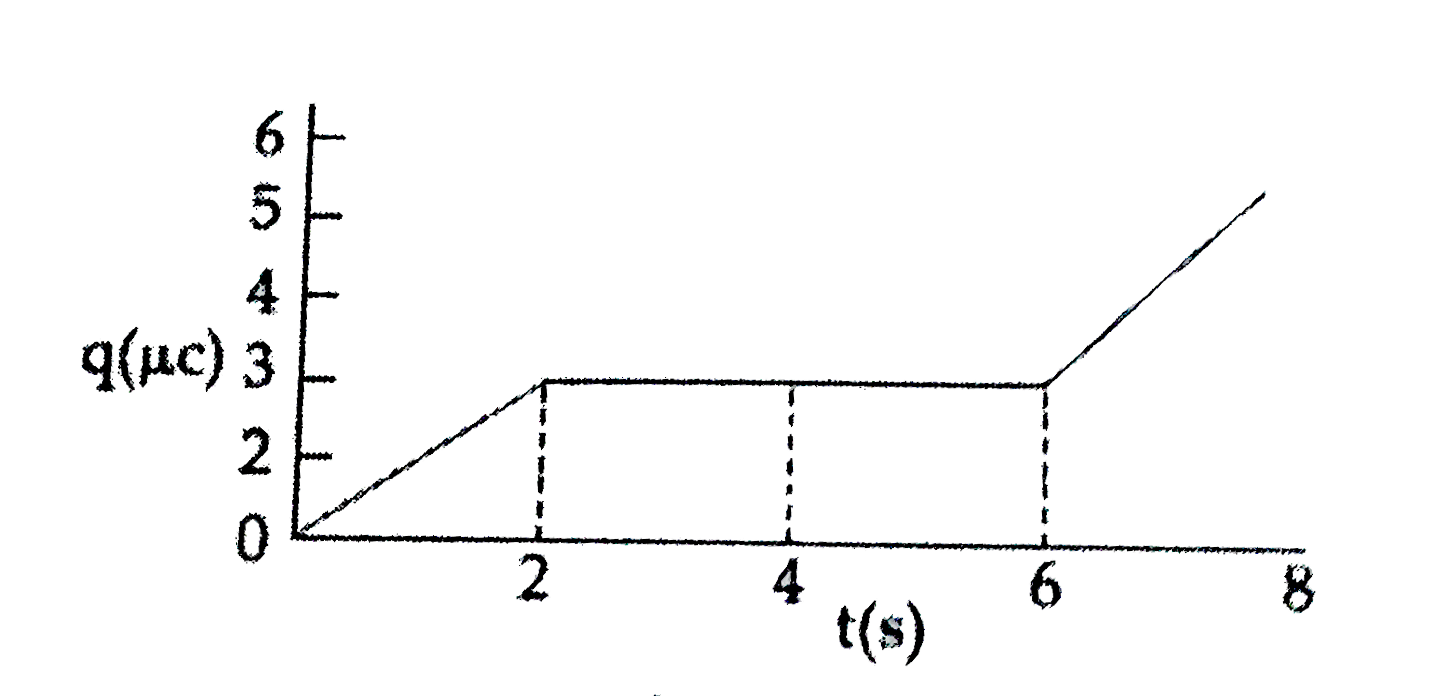
What is the value of current at t=4 s ?
View SolutionA 1−kΩ resistor is connected in series with a 10−mH inductor, a 30V battery and an open switch. At time t=0, the switch is suddenly closed.
a. What is the maximum current in this circuit and when does it occur?
b. What are the voltage drops across the inductor and across the resistor 20μs after the switch is closed?
c. On a single set of axes, sketch the voltage across the resistor and the voltage across the inductor as functions of time. Also, sketch a graph of the current in the circuit as s function of time.
View Solution
