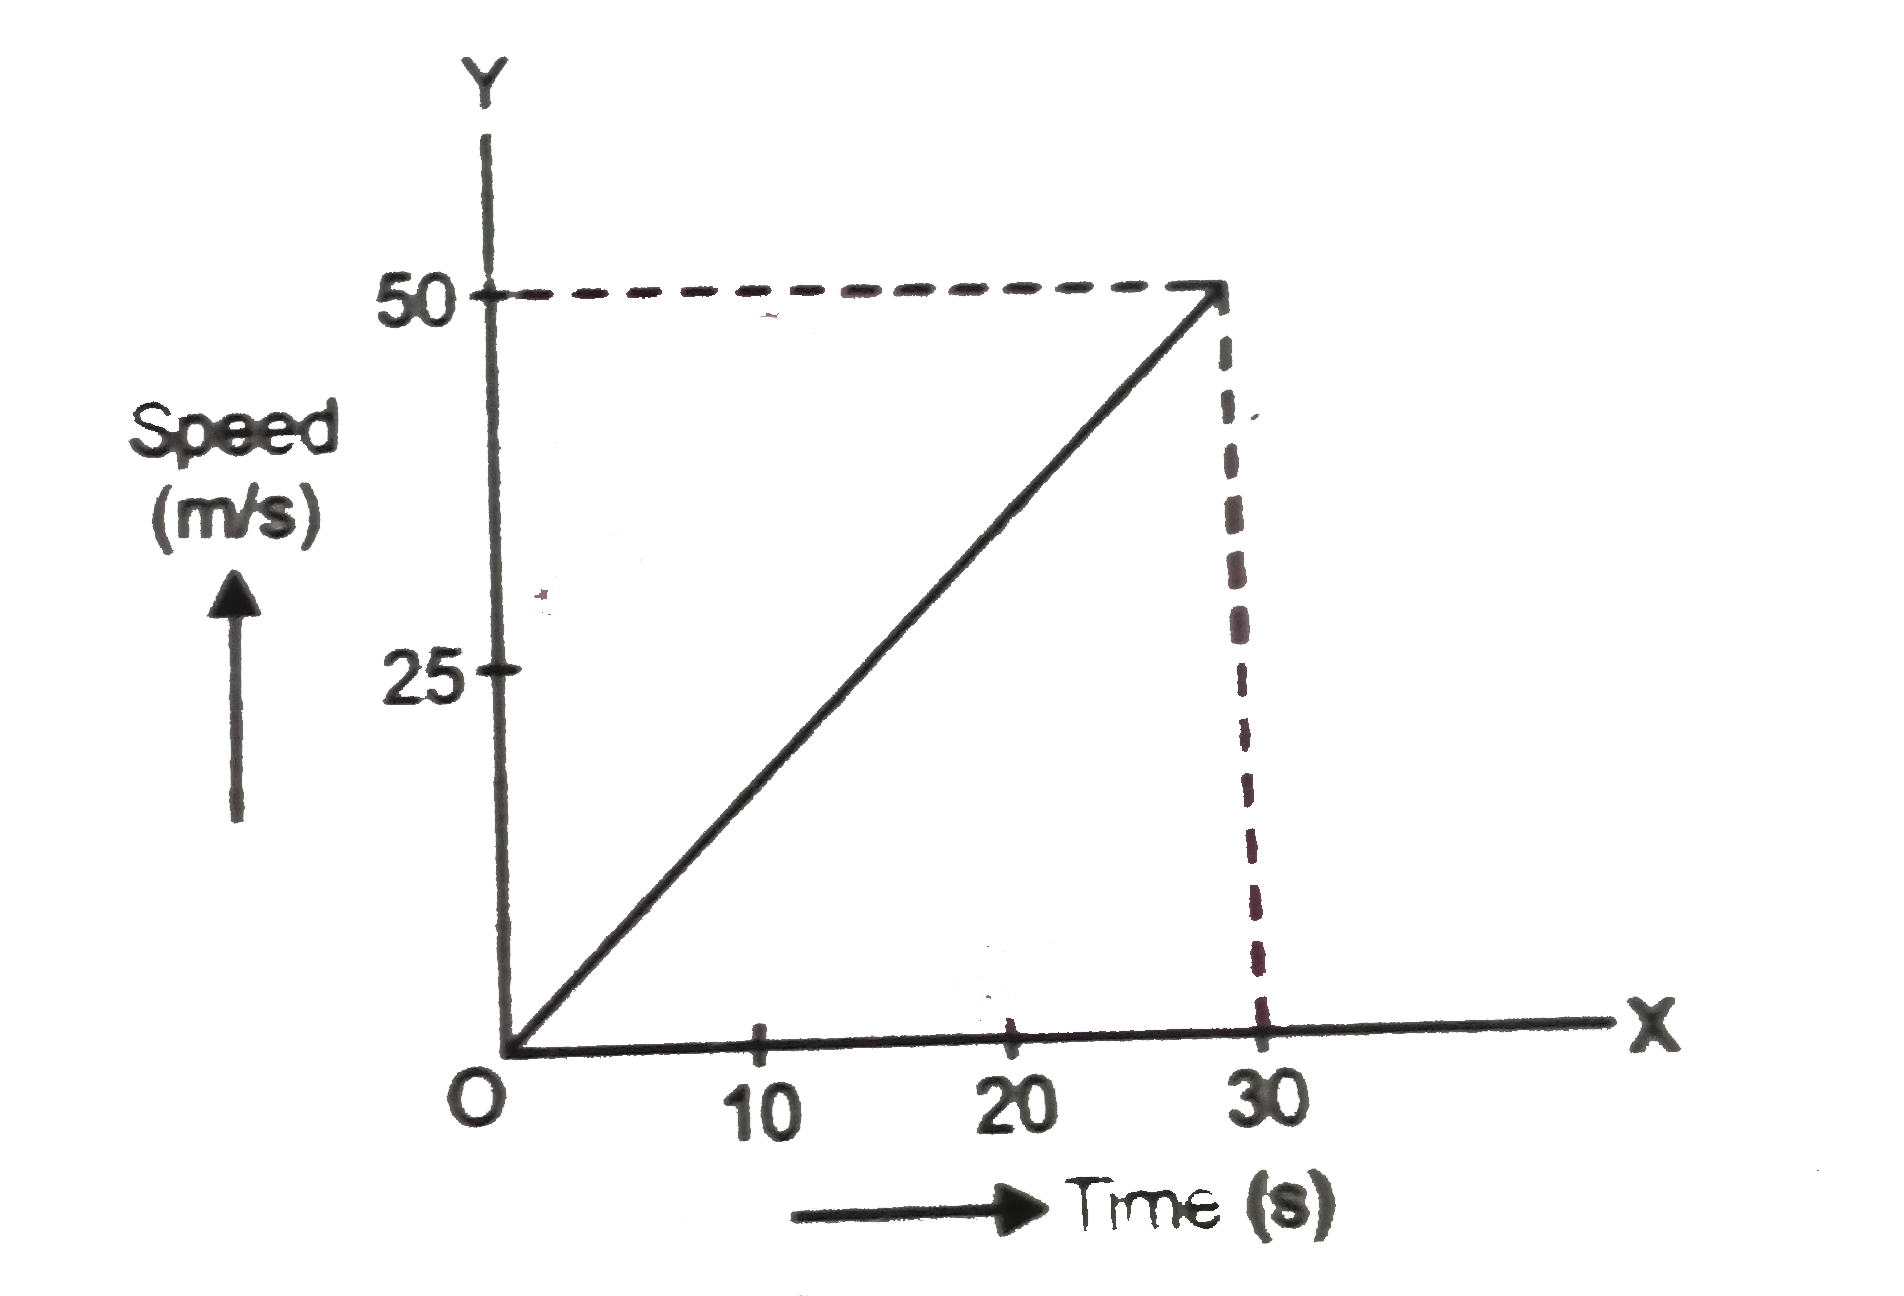
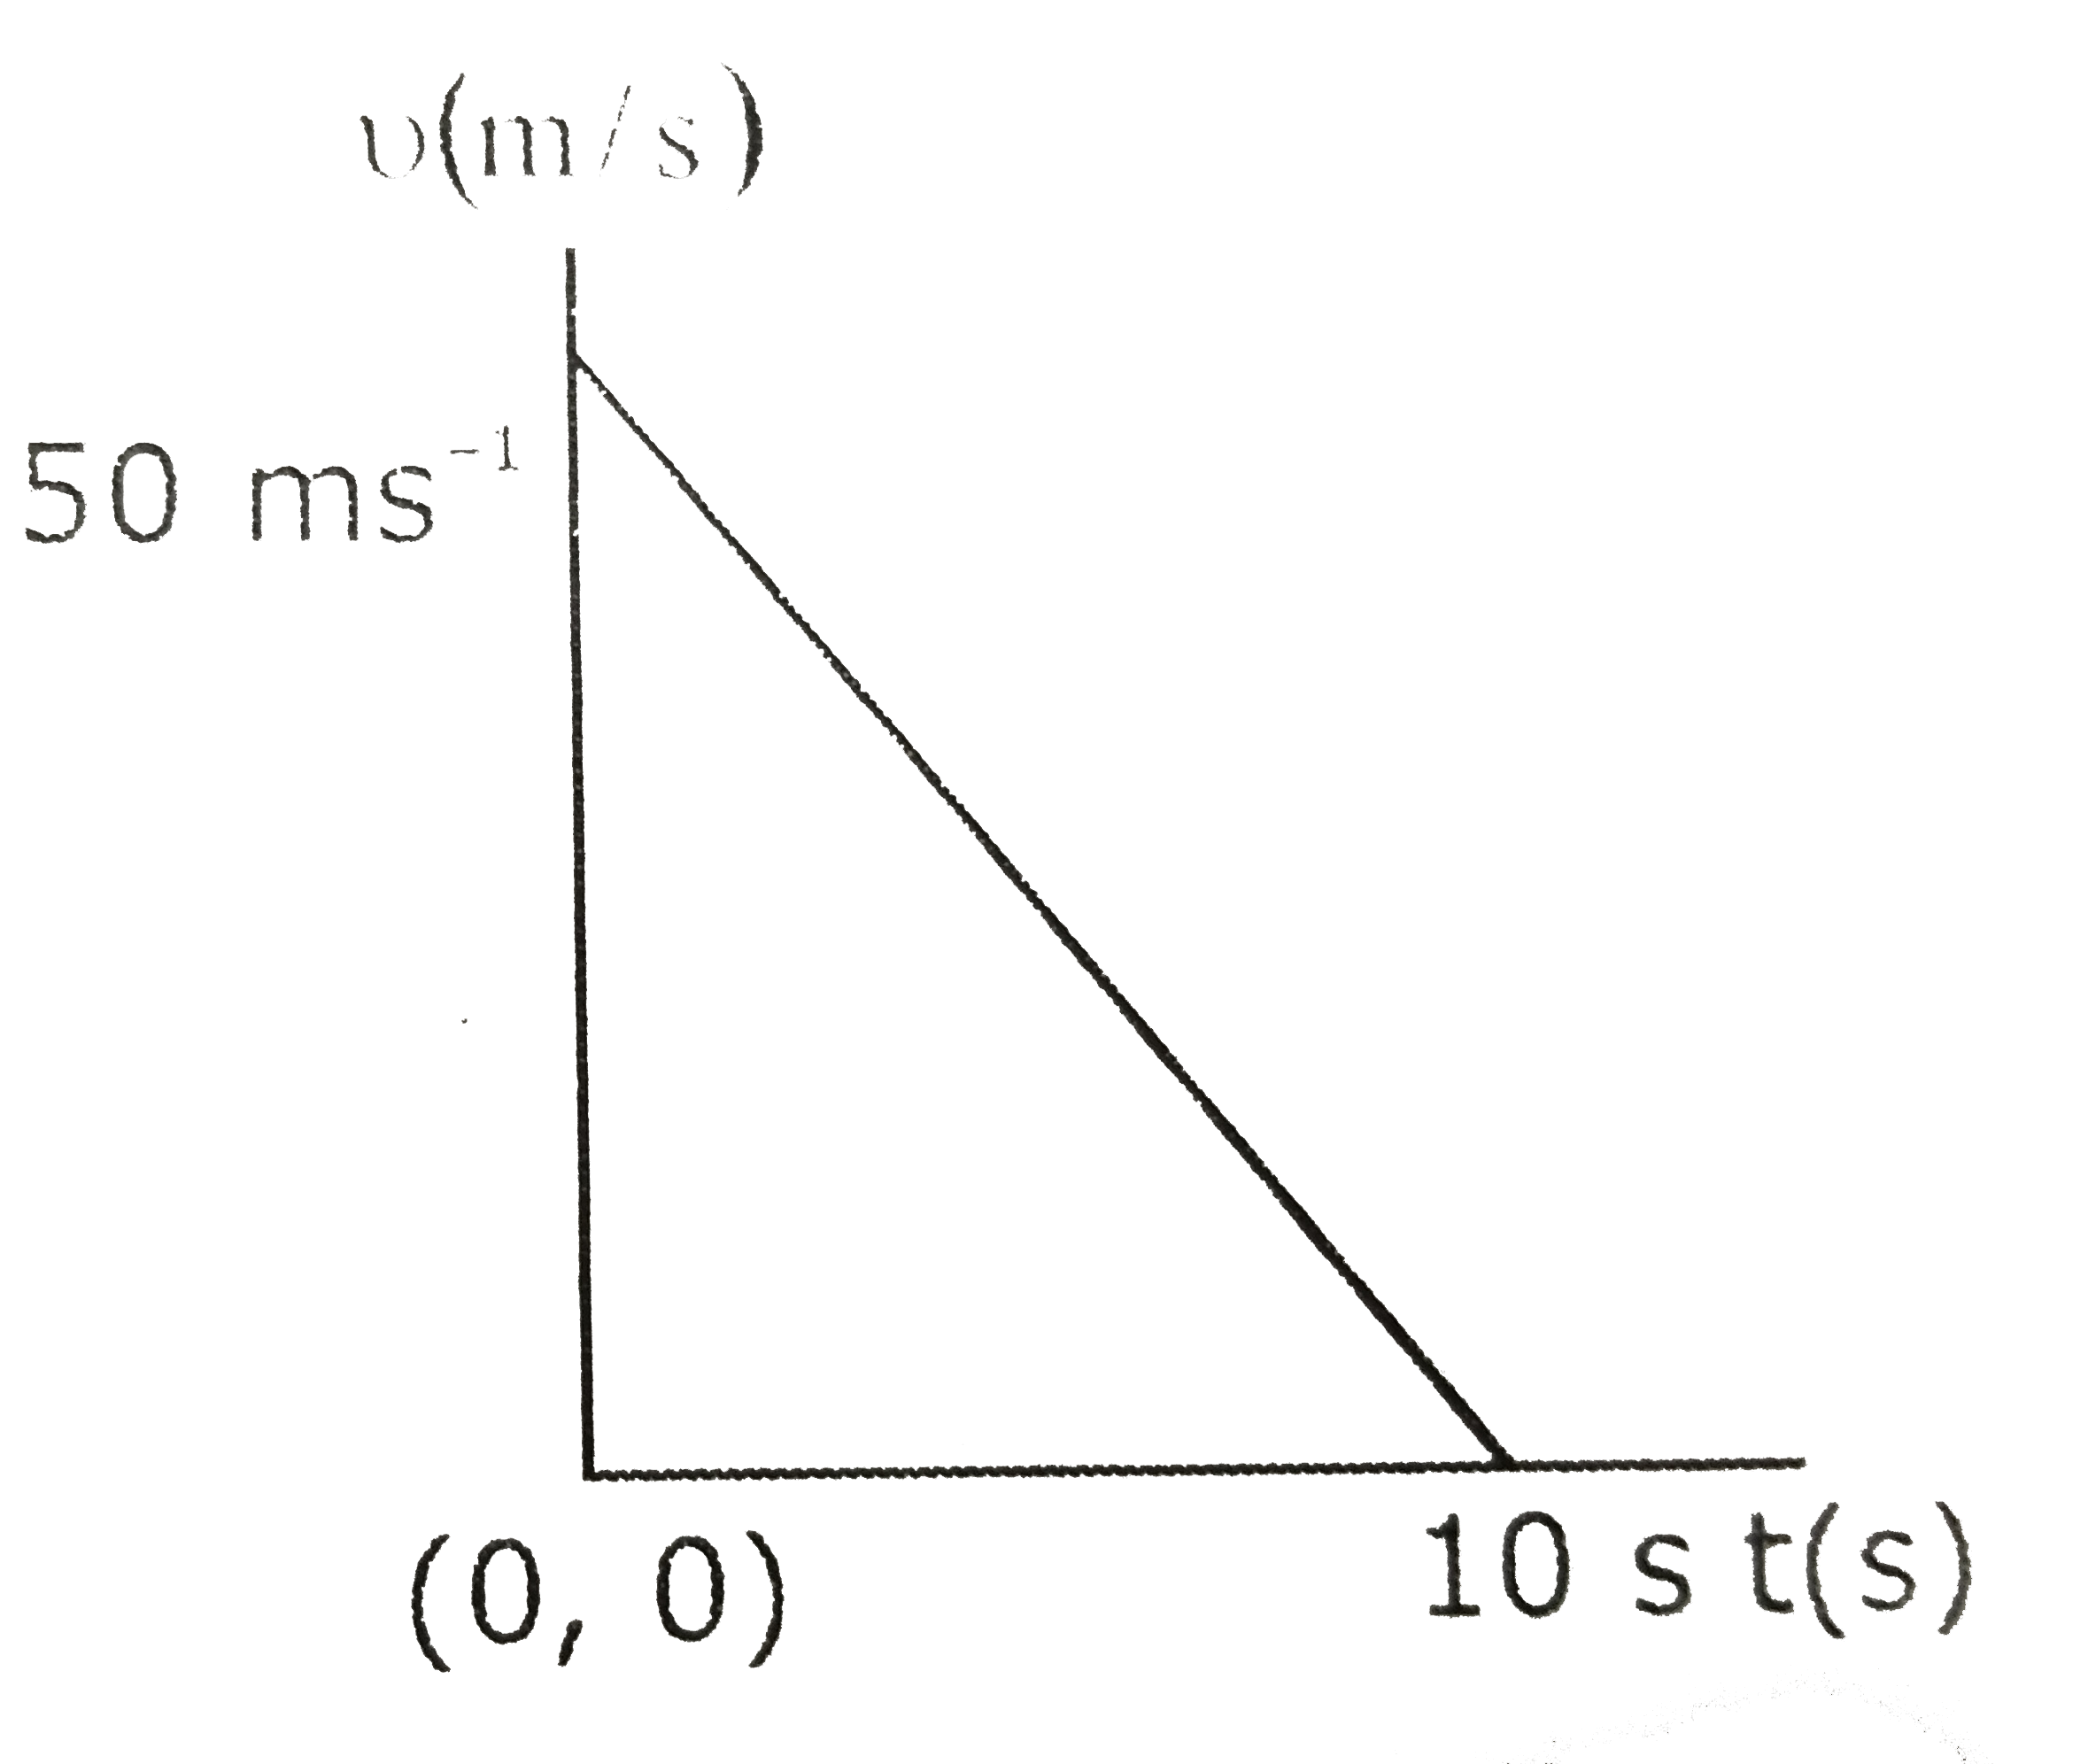
The speed time graph of a body of mass 50kg is shown in (figure). Calculate the force acting in the body
(i)from 0 to 4s (ii)from 4 to 6s

Here, m=50kg,F=?
(i) From 0 to 4 sec
graph shows that speed =20m/s = constant
∴ acceleration, a=0
F=ma = Zero.
(ii) From 4s to 6s
graph shows that the body is brought to test
a=final velocity-initial velocitytime taken=0−202=−10m/s2
F=ma=50(−10)=−500N
Negative sign indicates that force applied oppose the motion.
Topper's Solved these Questions
- FORCES AND LAWS OF MOTIONBOOK - PRADEEPCHAPTER - FORCES AND LAWS OF MOTIONEXERCISE - ASSESSSMENT THROUGH PAPER-PEN TEST
29 Videos
- FORCES AND LAWS OF MOTIONBOOK - PRADEEPCHAPTER - FORCES AND LAWS OF MOTIONEXERCISE - MULTIPLE CHOICE QUESTIONS
28 Videos
- FORCES AND LAWS OF MOTIONBOOK - PRADEEPCHAPTER - FORCES AND LAWS OF MOTIONEXERCISE - QUIZ TESTING
12 Videos
- FLOTATIONBOOK - PRADEEPCHAPTER - FLOTATIONEXERCISE - Problem For Practice
6 Videos
- GRAVITATIONBOOK - PRADEEPCHAPTER - GRAVITATIONEXERCISE - Model Test paper (1)
36 Videos
Similar Questions
Knowledge Check
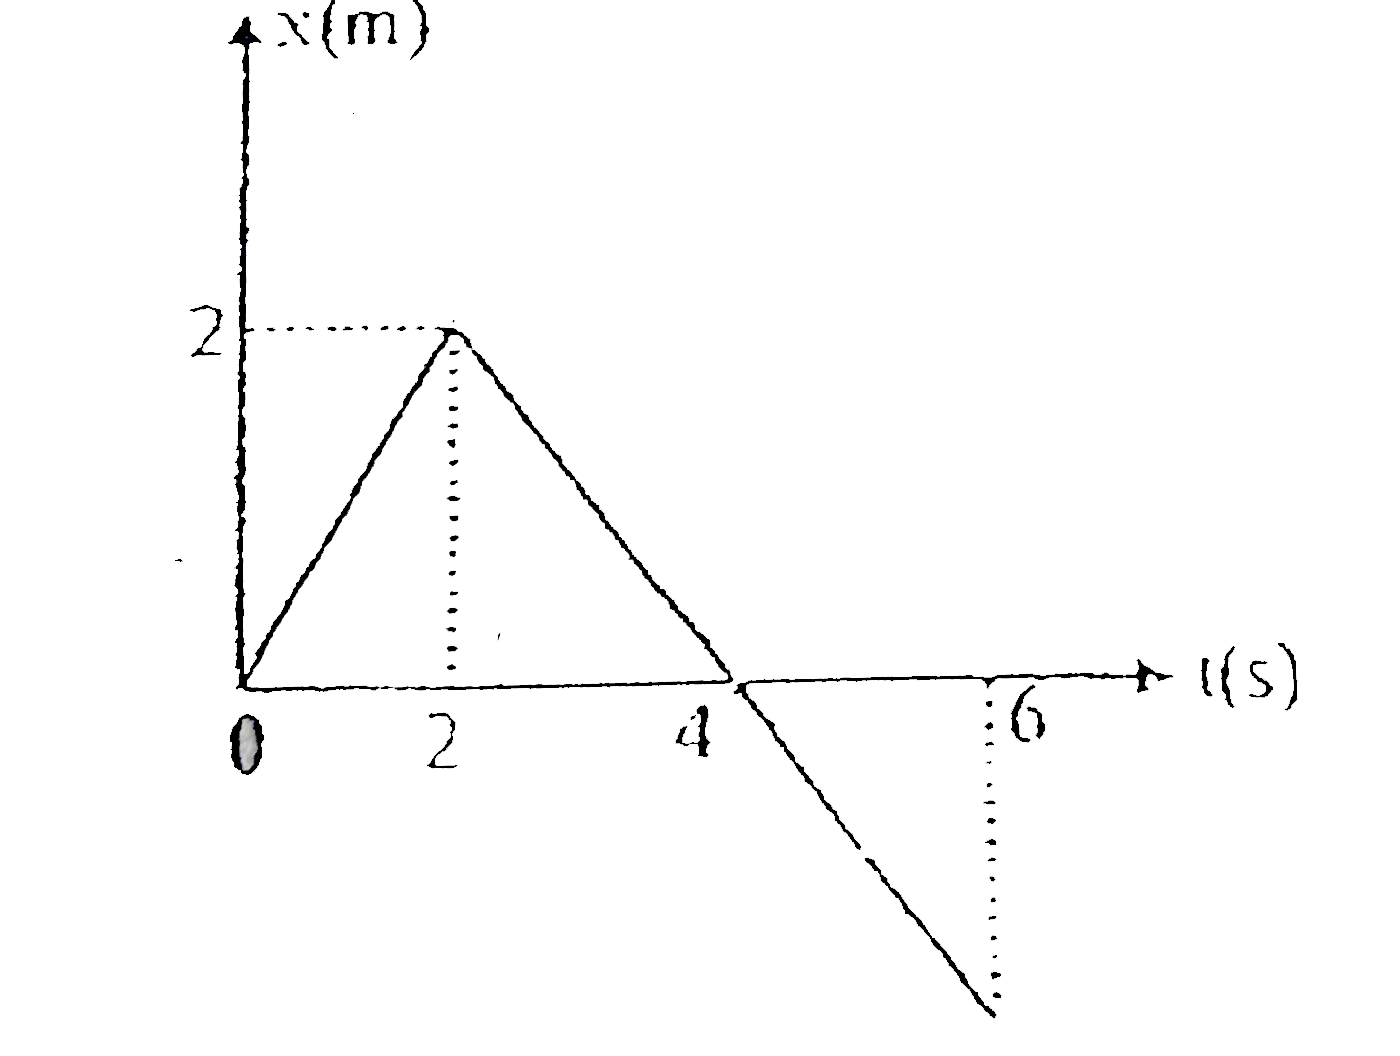
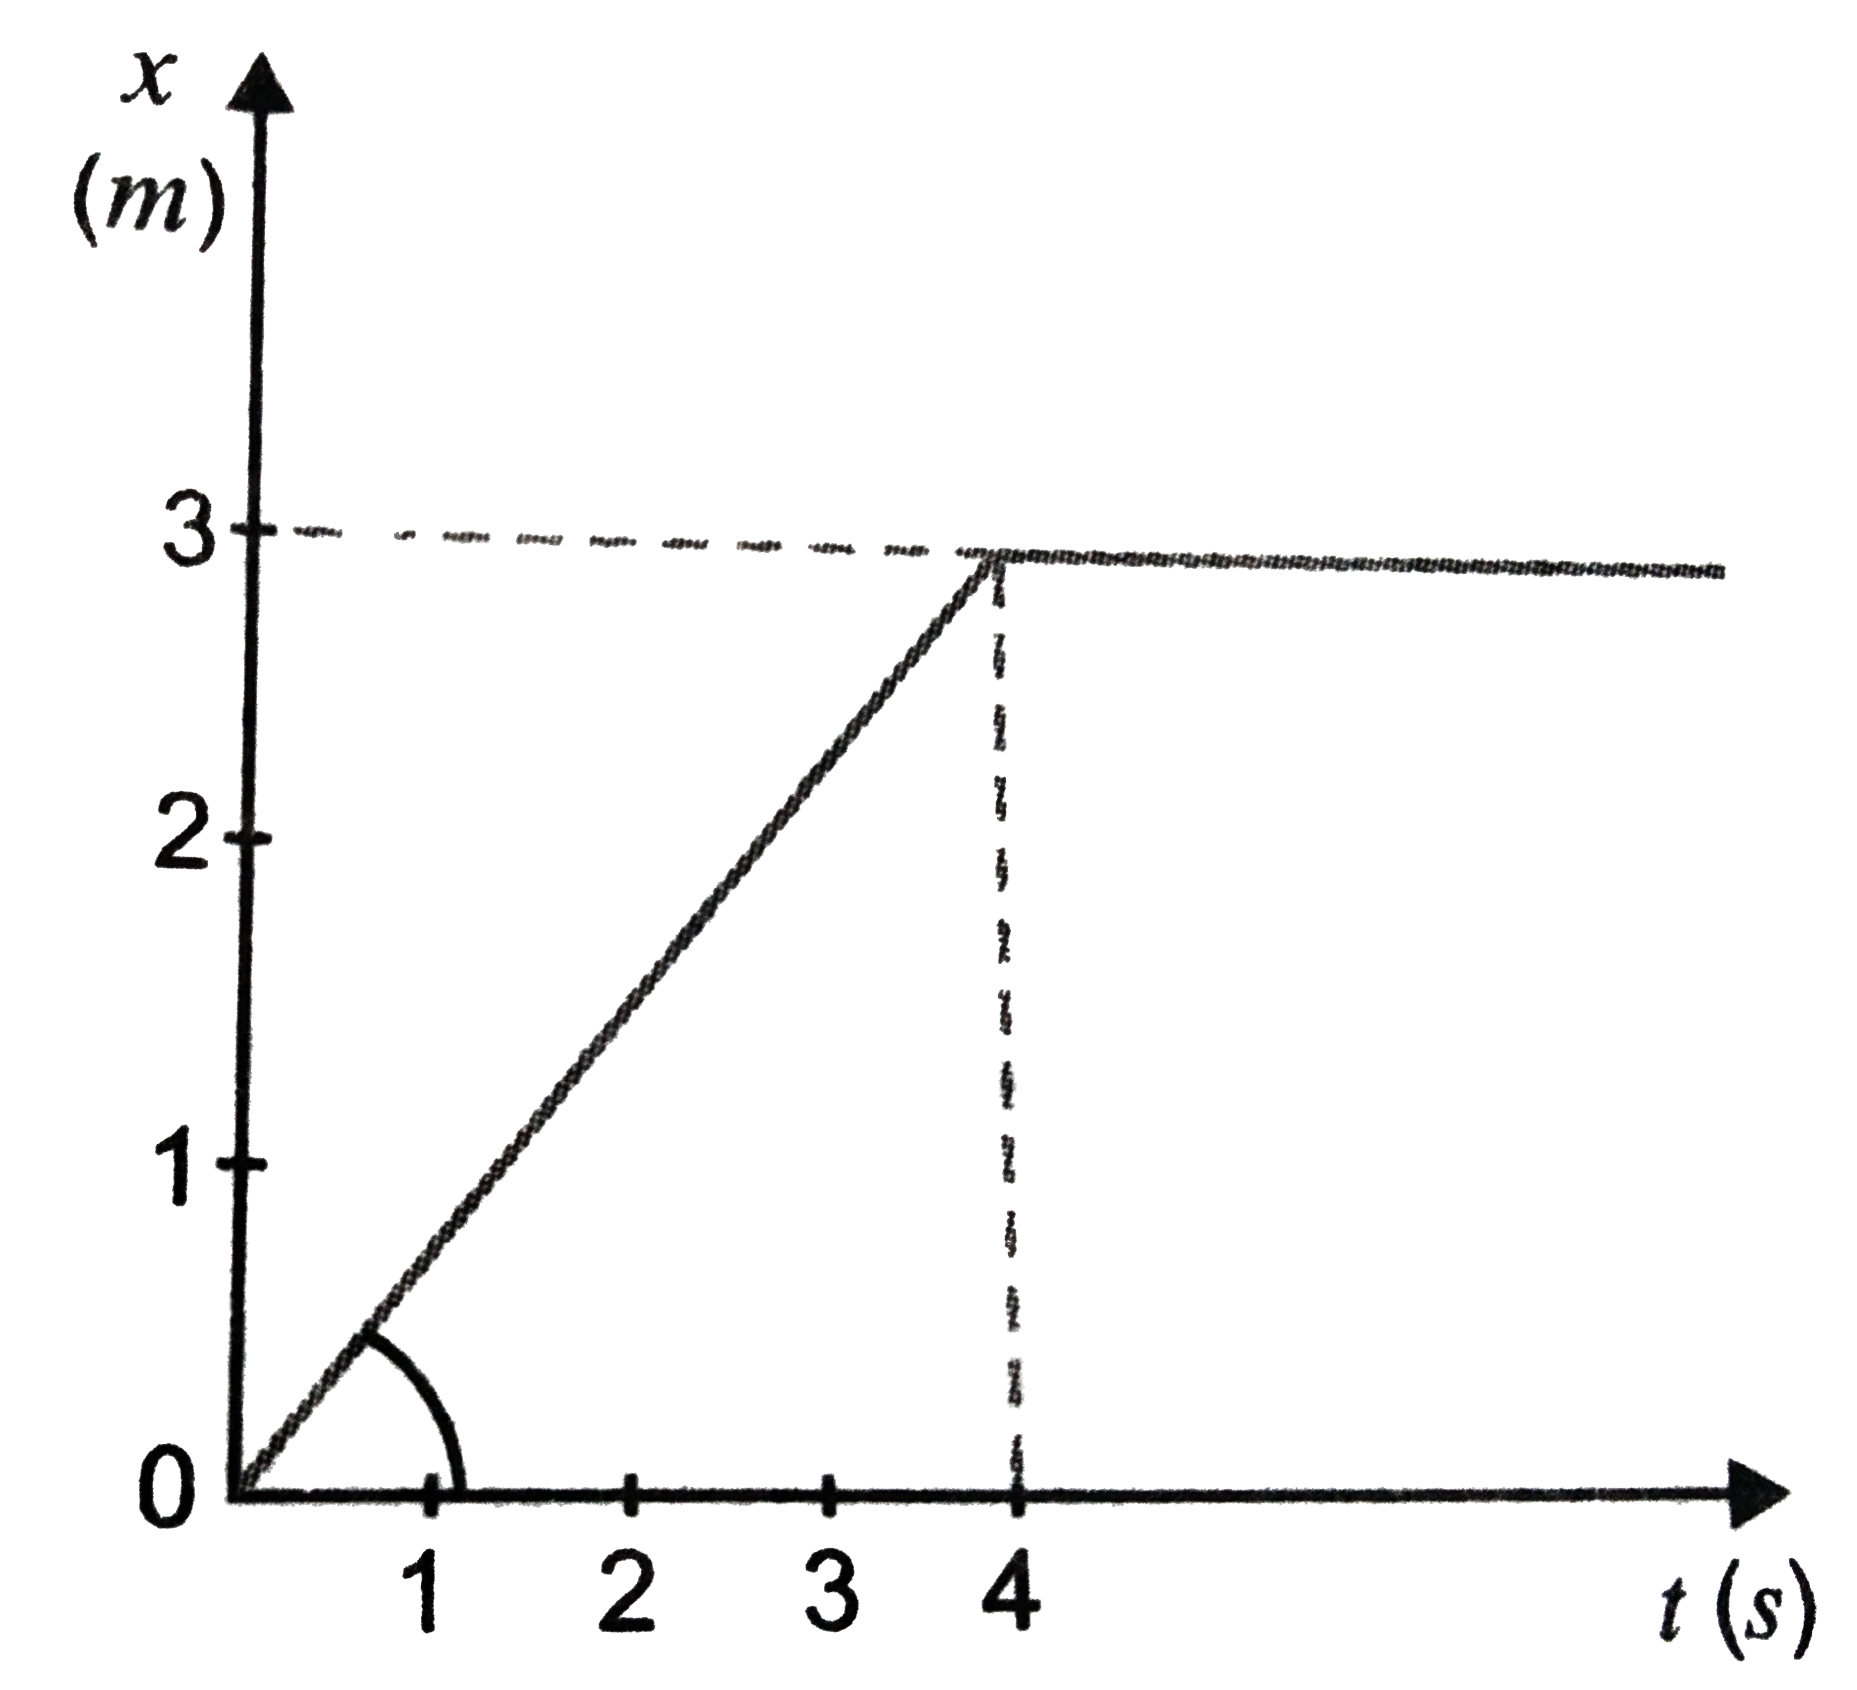
Position time graph of a particle of mass 2 kg is shown in figrure. Total work done on the particle from t=0 to t=4s is
 A8 JB4 JC0 JDCan't be determined
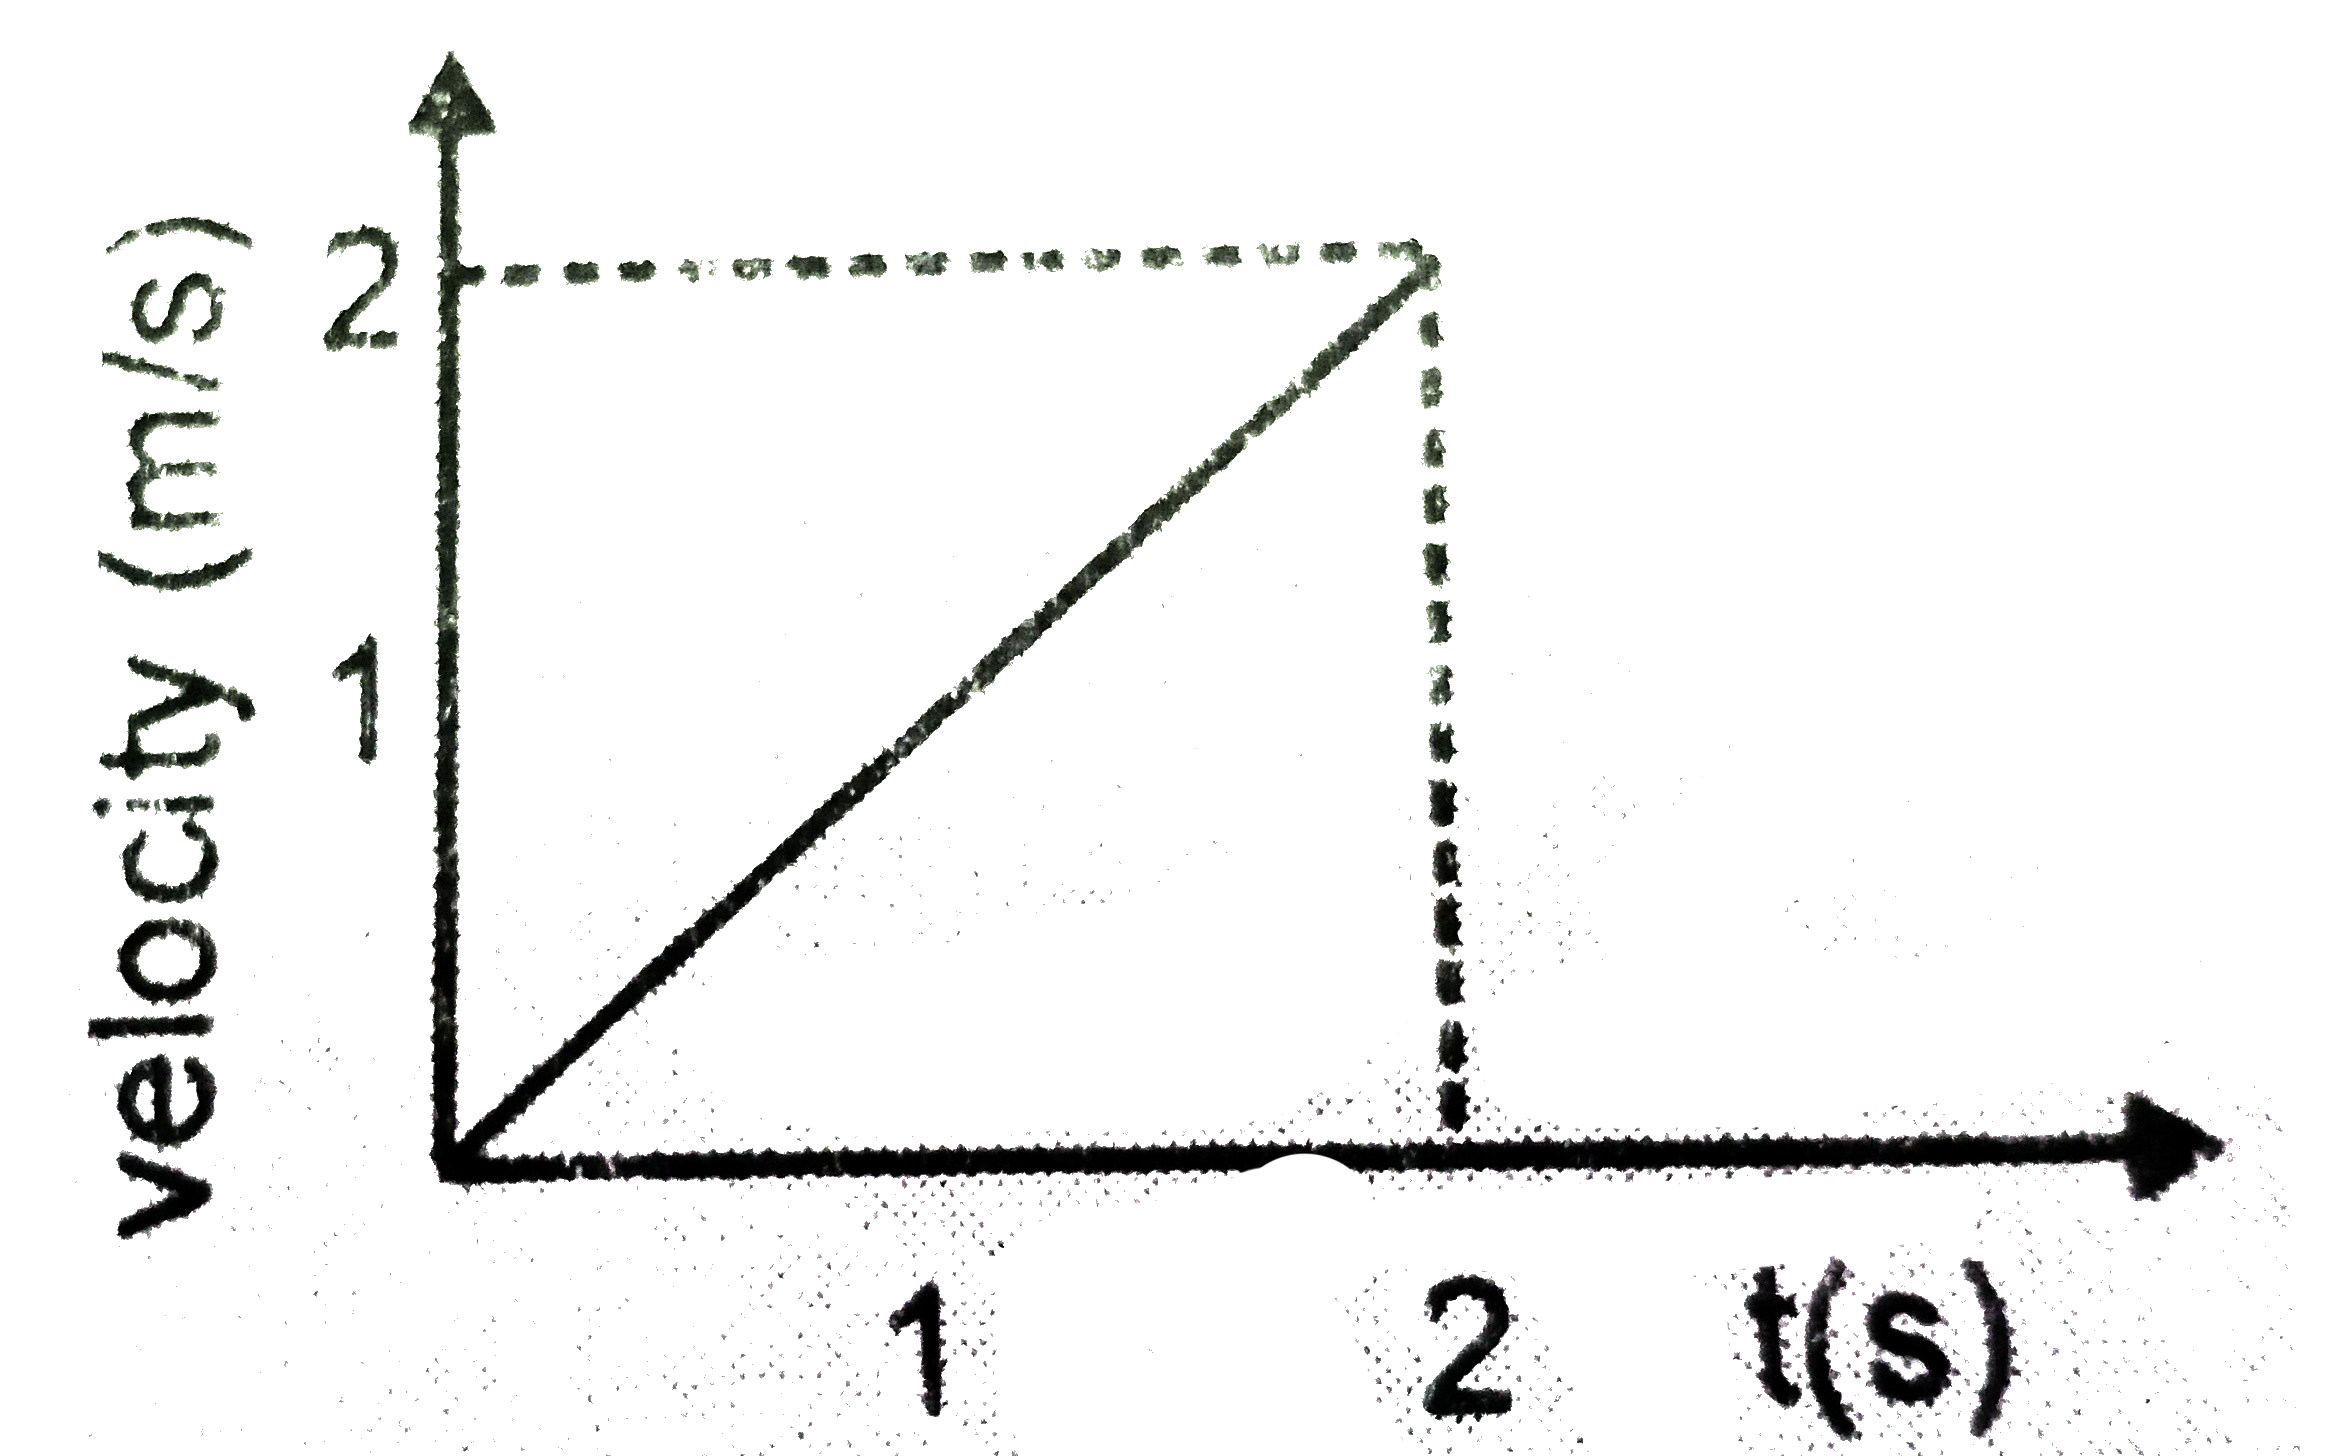
For body of 50 kg. mass, the velocity time graph is shown in figure. Then force acting on the body is :-
 A25NB50NC12.5 ND100 N
The speed time graph of a body is as shown in Figure. Calculate
(i) acceleration of body, (ii) retardation of body, (iii) total distance travelled by the body.
View SolutionThe velocity versus time graph of a body moving along a straight path is shown below.
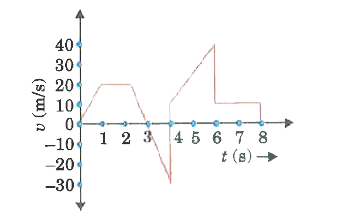
(i) Calculate the distance covered by the body from t=0 to t=8s.
(ii) find its net displacement from t=0 to 8 s.
View SolutionVelocity -time graph for a body of mass 10 kg is shown in figure. Work -done on the body in first two seconds of the motion is :
View SolutionThe displacement time graph of a body in motion is given as shown in the figure. Velocity of body is? (in m/s)
View SolutionThe position time graph of a body of mass 2kg is as given in What is the impulse on the body at t=0 s and t=4s ?
 .
.
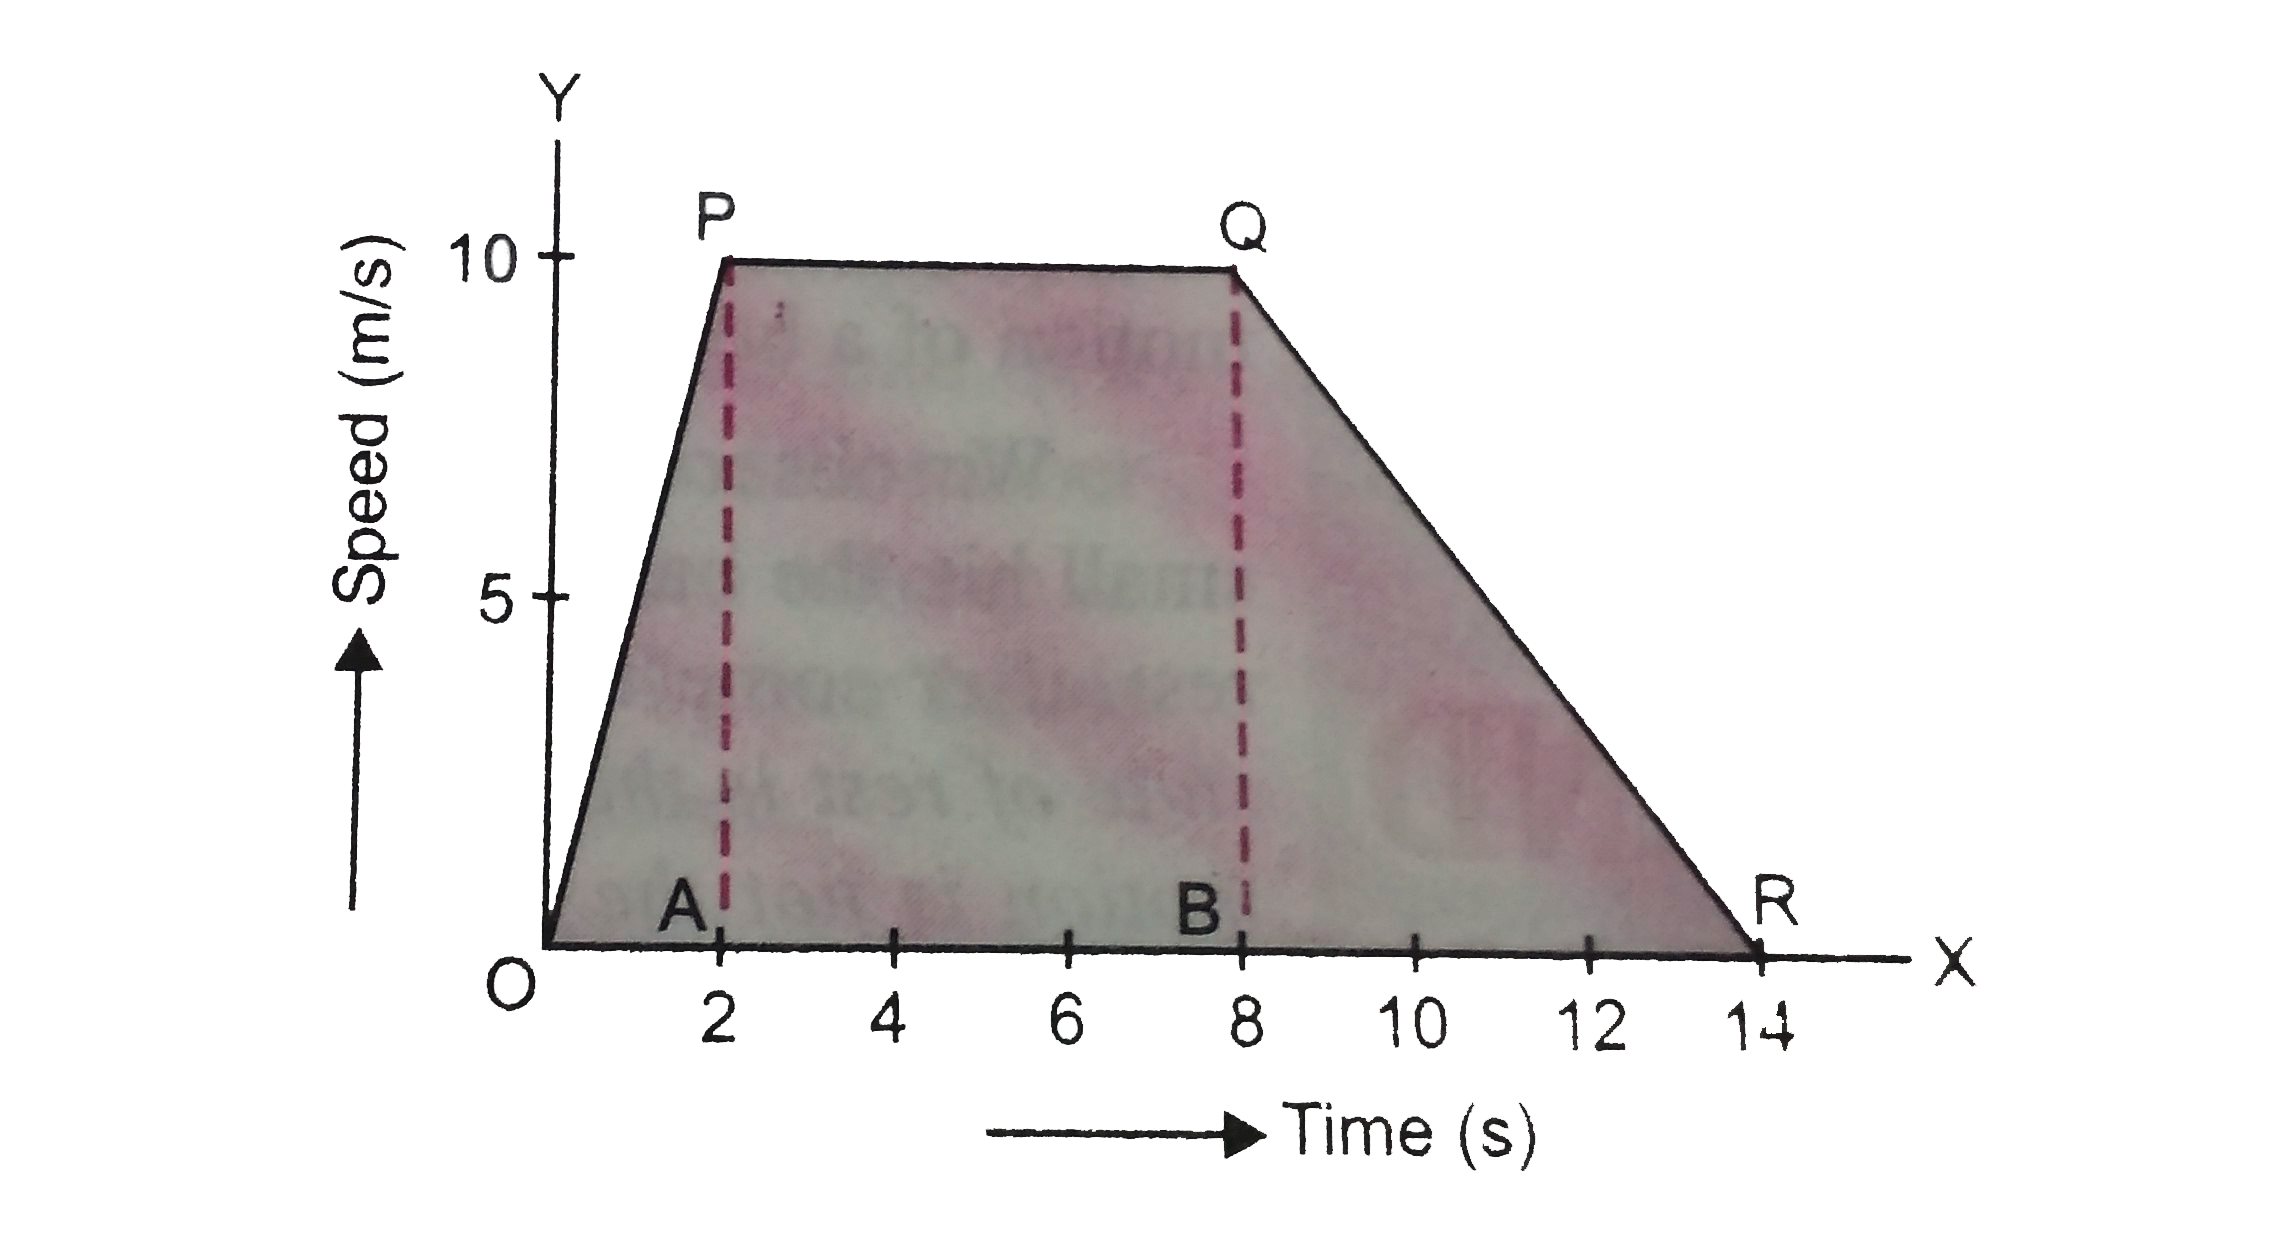
View SolutionThe speed time graph of a body is shown in Figure. Observer the graph carefully and answer the following :
(i) What kinds of motion are represented by OP,PQ and QR ?
(ii) Calculate acceleration of the body for the first 2sec.
(iii) Calculate retardation of body from 8s to 14s.
View Solution

