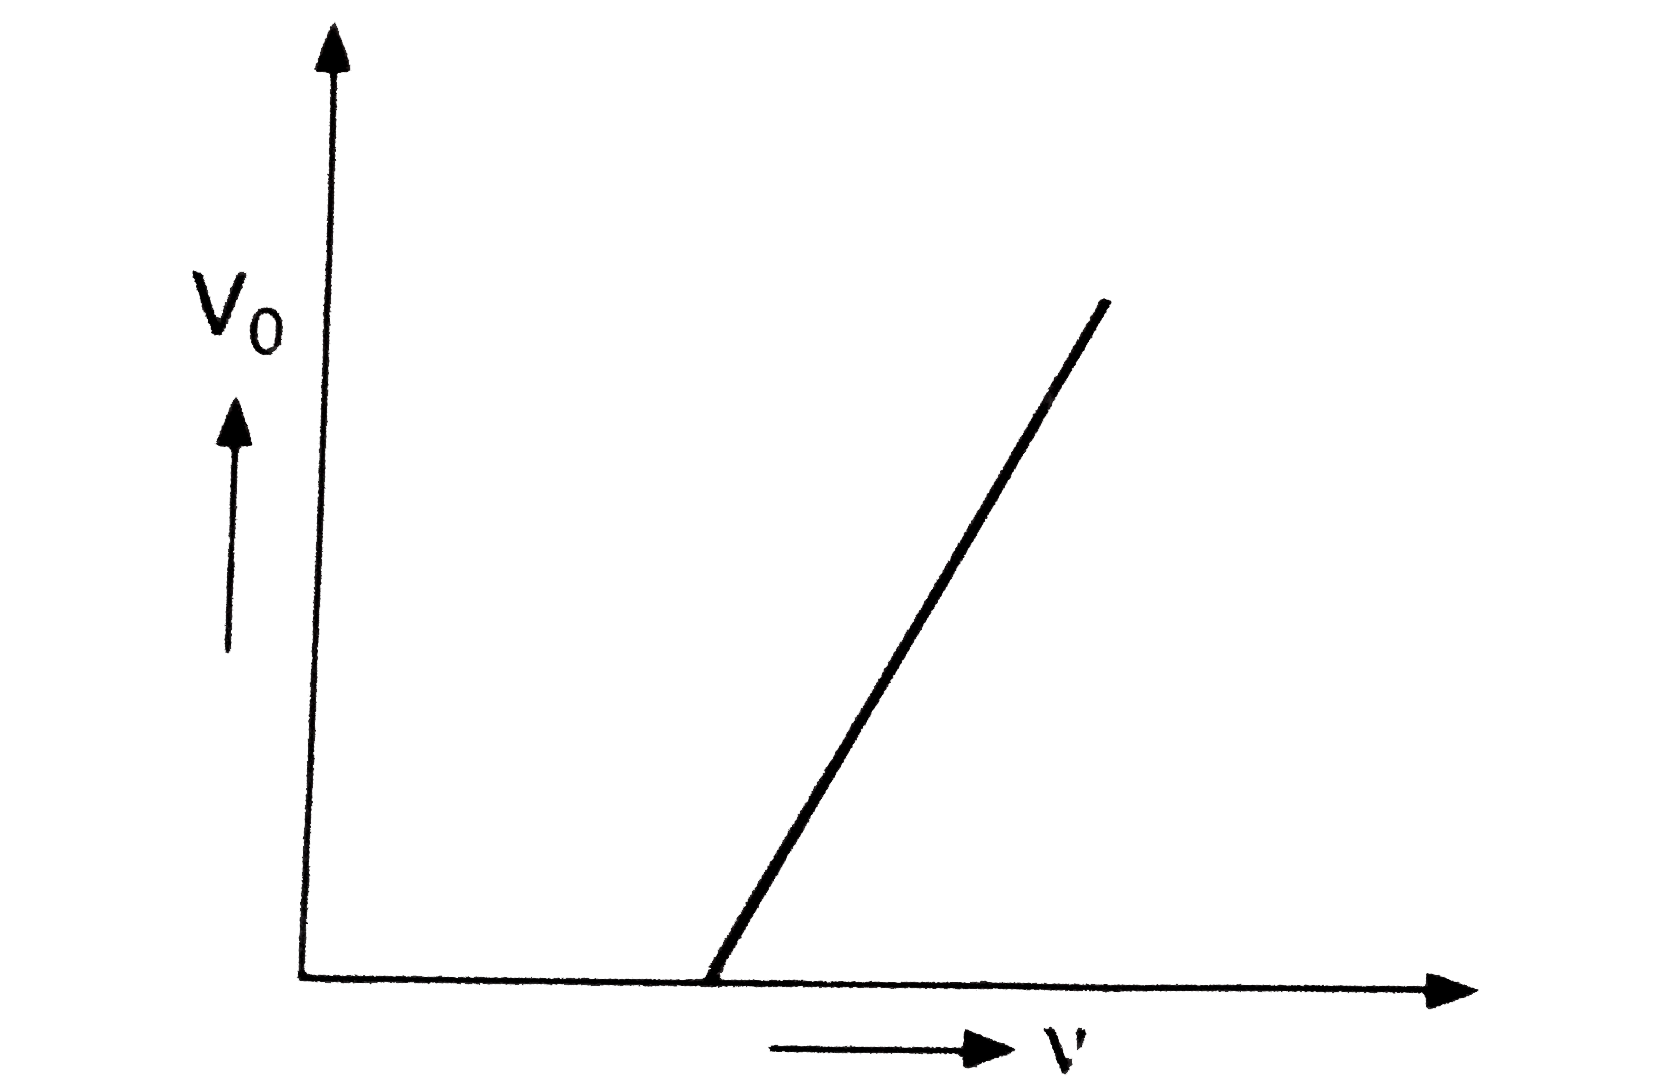
The stopping potential V for photo-electric emission from a metal surface is plotted along Y-axis and frequency v of incident light along X-axis. A straight line is obtained as shown . Planck's constant is given by 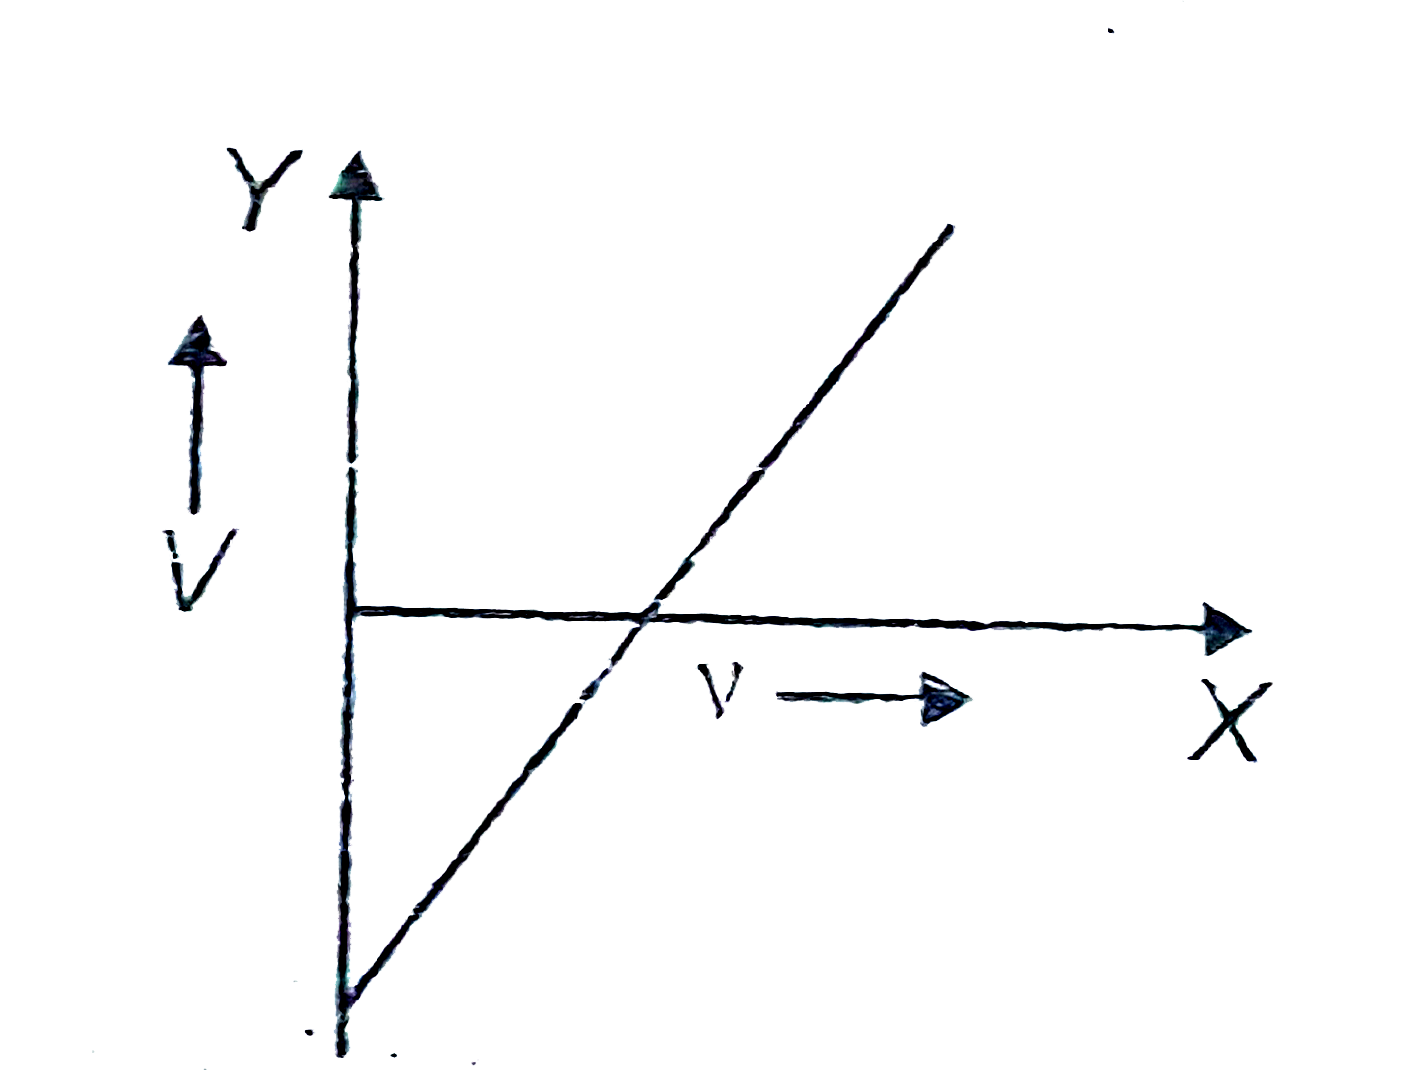
slope of the line
product of slope on the line and charge on the electron
product of intercept along Y-axis and mass of the electron
product of slope and mass of electron
Step by step video & image solution for The stopping potential V for photo-electric emission from a metal surface is plotted along Y-axis and frequency v of incident light along X-axis. A straight line is obtained as shown . Planck's constant is given by by Physics experts to help you in doubts & scoring excellent marks in Class 10 exams.
Updated on:21/07/2023Topper's Solved these Questions
- NATURE OF LIGHT AND PHOTOELECTRIC EFFECTBOOK - CENGAGE PHYSICSCHAPTER - NATURE OF LIGHT AND PHOTOELECTRIC EFFECTEXERCISE - Challenging Exercise
3 Videos
- MAGNETISMBOOK - CENGAGE PHYSICSCHAPTER - MAGNETISMEXERCISE - OLYMPIAD AND NTSE LEVEL EXERCISES
8 Videos
- OPTICAL INSTRUMENTS BOOK - CENGAGE PHYSICSCHAPTER - OPTICAL INSTRUMENTS EXERCISE - OLYMPLAD AND NTSE LEVEL EXERCISES
10 Videos
Similar Questions
Figure shows the stopping potential (V0) for the photo electron vers (1λ) graph, for two metals A and B, λ being the wavelength of incident light.
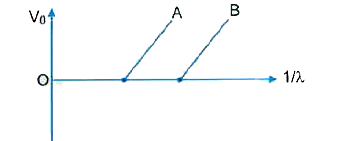
How is the value of Planck's constant determined from the graph ?
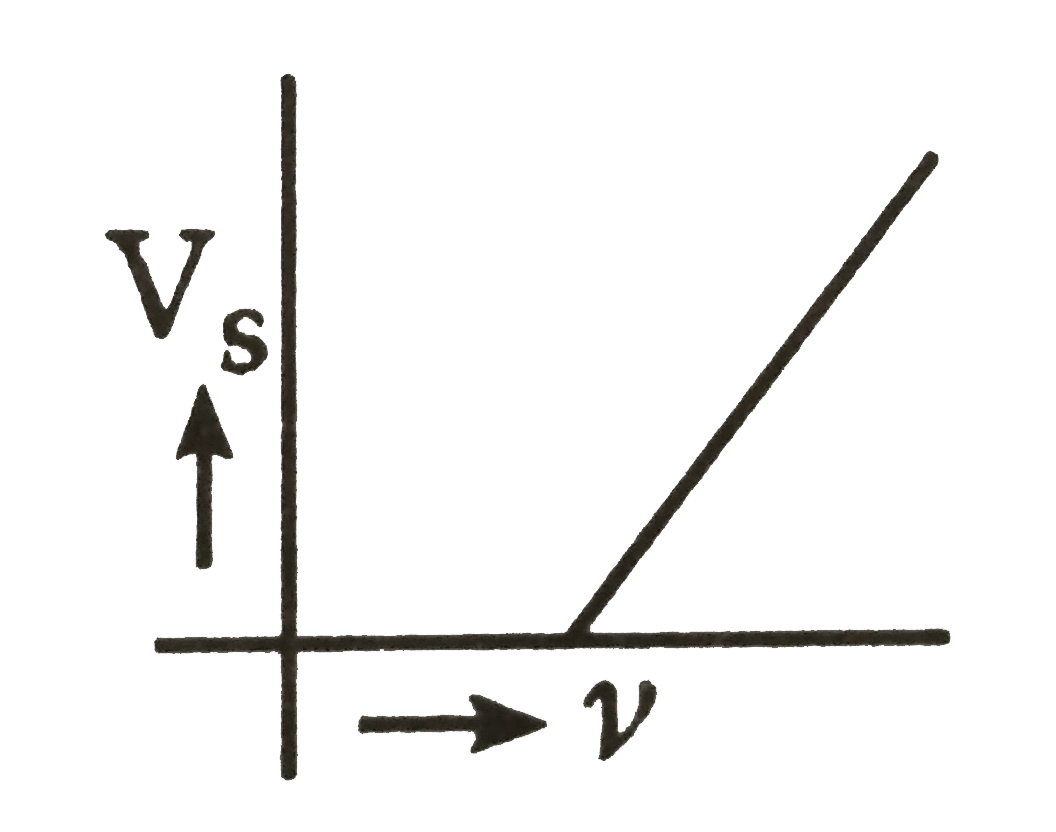
View SolutionIn photoelectric effect the slope of straight line graph between stopping potential (Vs) and frequency of incident light (v) gives
View Solution
Knowledge Check
The stopping potential for photoelectrons from a metal surface is V1 when monochromatic light of frequency υ1 is incident on it. The stopping potential becomes V2 when monochromatic light of another frequency is incident on the same metal surface. If h be the Planck’s constant and e be the charge of an electron, then the frequency of light in the second case is:
Aυ1−eh(V2+V1)Bυ1+eh(V2+V1)Cυ1−eh(V2−V1)Dυ1+eh(V2−V1)In a photoelectric experiment, the graph of frequency v of incident light (in Hz) and stopping potential V (in V) is as shown in the figure. Planck's constant is (e is the elementary charge)
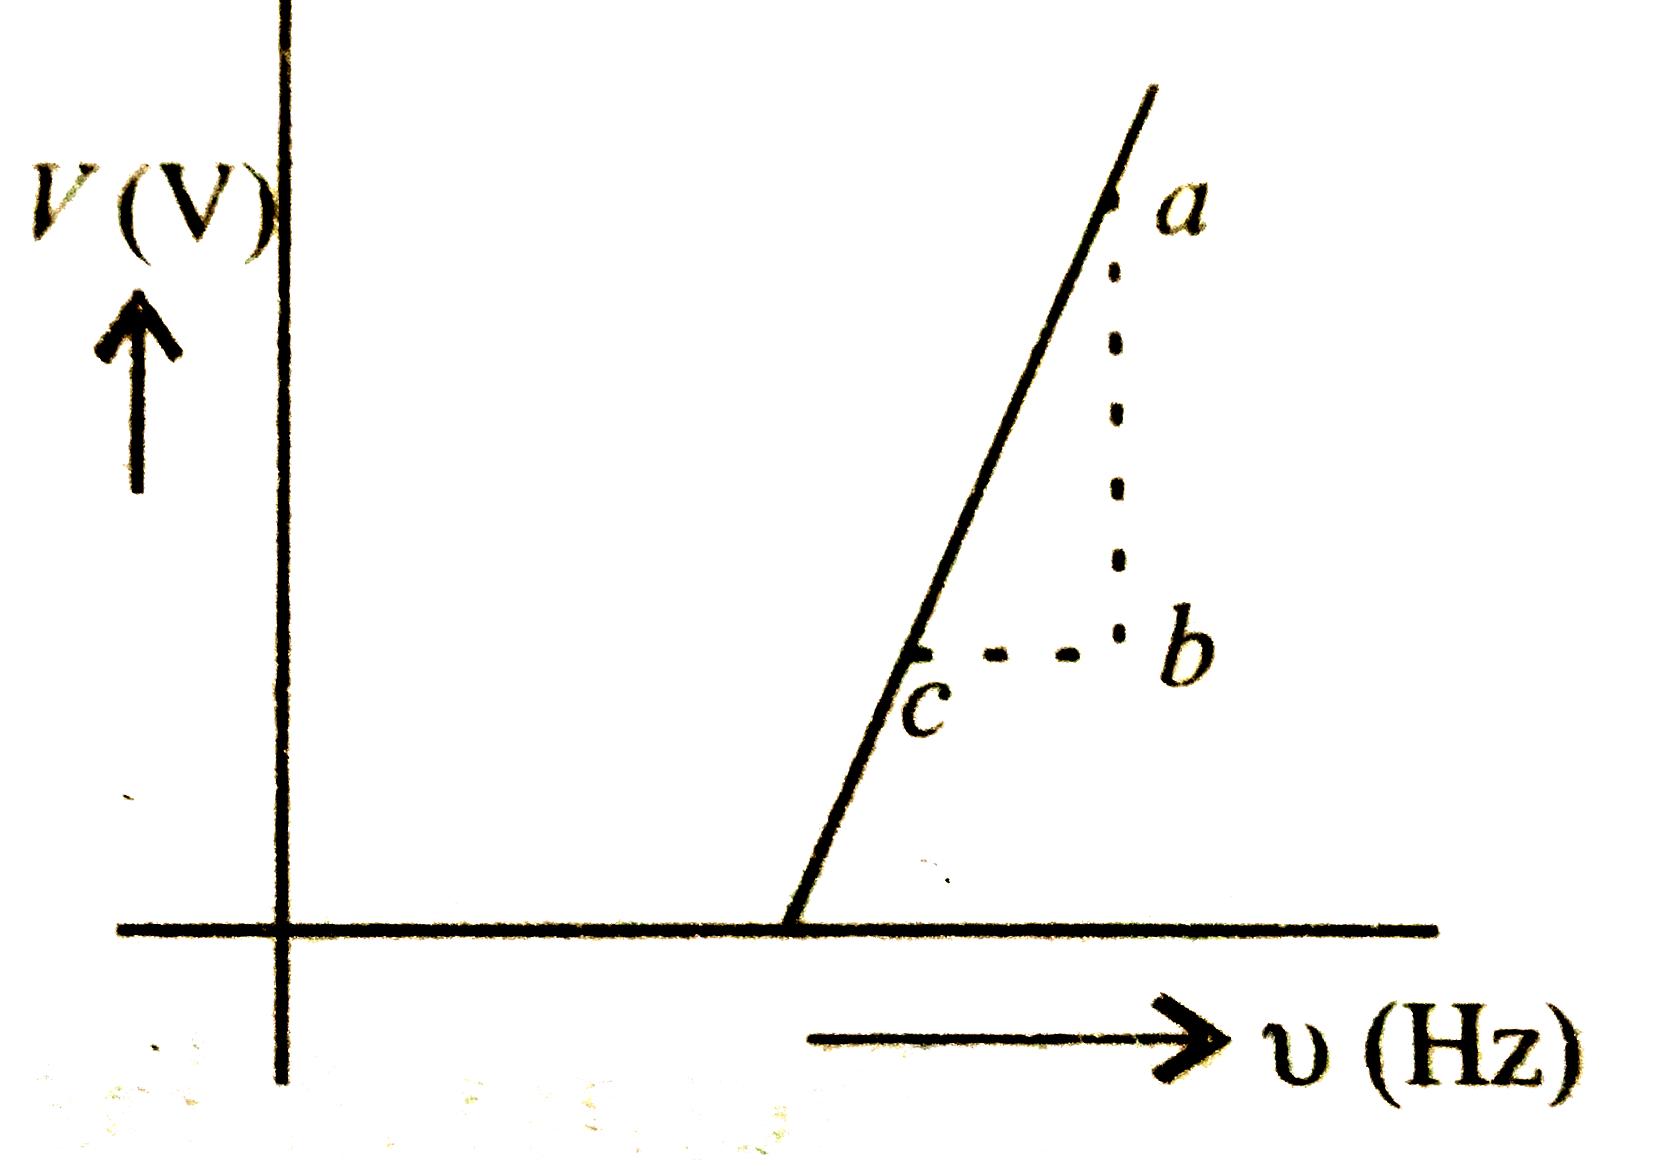 AeabbcBecbacCeacbcDeacab
In a photoelectric experiment , the stopping potential Vs is plotted against the frequency v of the incident light . The resulting curve is a straight line which makes an angle θ with the v - axis. Then tanθ will be equal to (Here E0 = work function of the surface_
AheBehC−ϕeDehϕ
In a photoelectric experiment , the stopping potential Vs is plotted against the frequency v of the incident light . The resulting curve is a straight line which makes an angle θ with the v - axis. Then tanθ will be equal to (Here E0 = work function of the surface_
View SolutionIn photo electric effect, the slope of the straight line graph between stopping potential and frequency of the incident light gives the ratio of Planck's constant to
View SolutionIn photoelectric effect the slope of straight line graph between stopping potential (V0) and freqency of incident light (v) gives:
View SolutionGraph of stopping potential for most energetic emitted photoelectron (VS) with frequency of incident radiation on metal is given below.

The value of ABBC, in graph is
(h=Planck's constant, e = electronic charge)
View SolutionA photon of frequency v causes photo electric emission from a surface with threshold frequency v0. The de-Broglies wavelength (λ) of the photo electron emitted is given by:
View Solution
