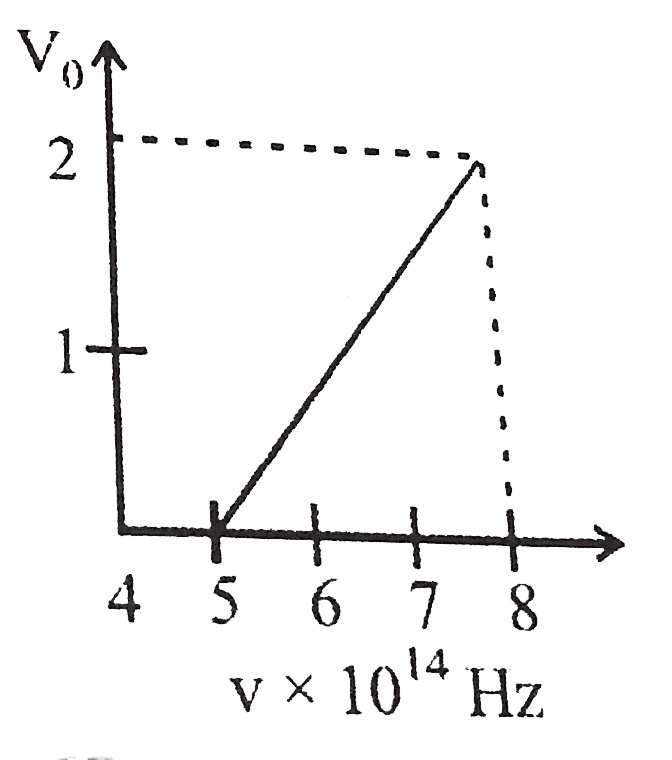
The stopping potential (VS) against frequency graph of a substance is shown in the figure. The threshold wavelength is

4000 Å
5000 Å
6000 Å
7500 Å
The correct Answer is:B
From the figure, v0=6×10¹⁴ Hz = Threshold frequency = Intercept on v-axis
∴λ0=cv0=3×1086×1014=5×10−7=5000Å
Topper's Solved these Questions
- ELECTRONS AND PHOTONS BOOK - MARVEL PUBLICATIONCHAPTER - ELECTRONS AND PHOTONS EXERCISE - TEST YOUR GRASP - 17
15 Videos
- ELECTROMAGNETIC INDUCTION AND ALTERNATING CURRENTS BOOK - MARVEL PUBLICATIONCHAPTER - ELECTROMAGNETIC INDUCTION AND ALTERNATING CURRENTS EXERCISE - TEST YOUR GRASP - 16
30 Videos
- ELECTROSTATICSBOOK - MARVEL PUBLICATIONCHAPTER - ELECTROSTATICSEXERCISE - TEST YOUR GRASP
20 Videos
Similar Questions
The stopping potential (V0) versus frequency (v) plot of a substance is shown in figure, the threshold wavelength is
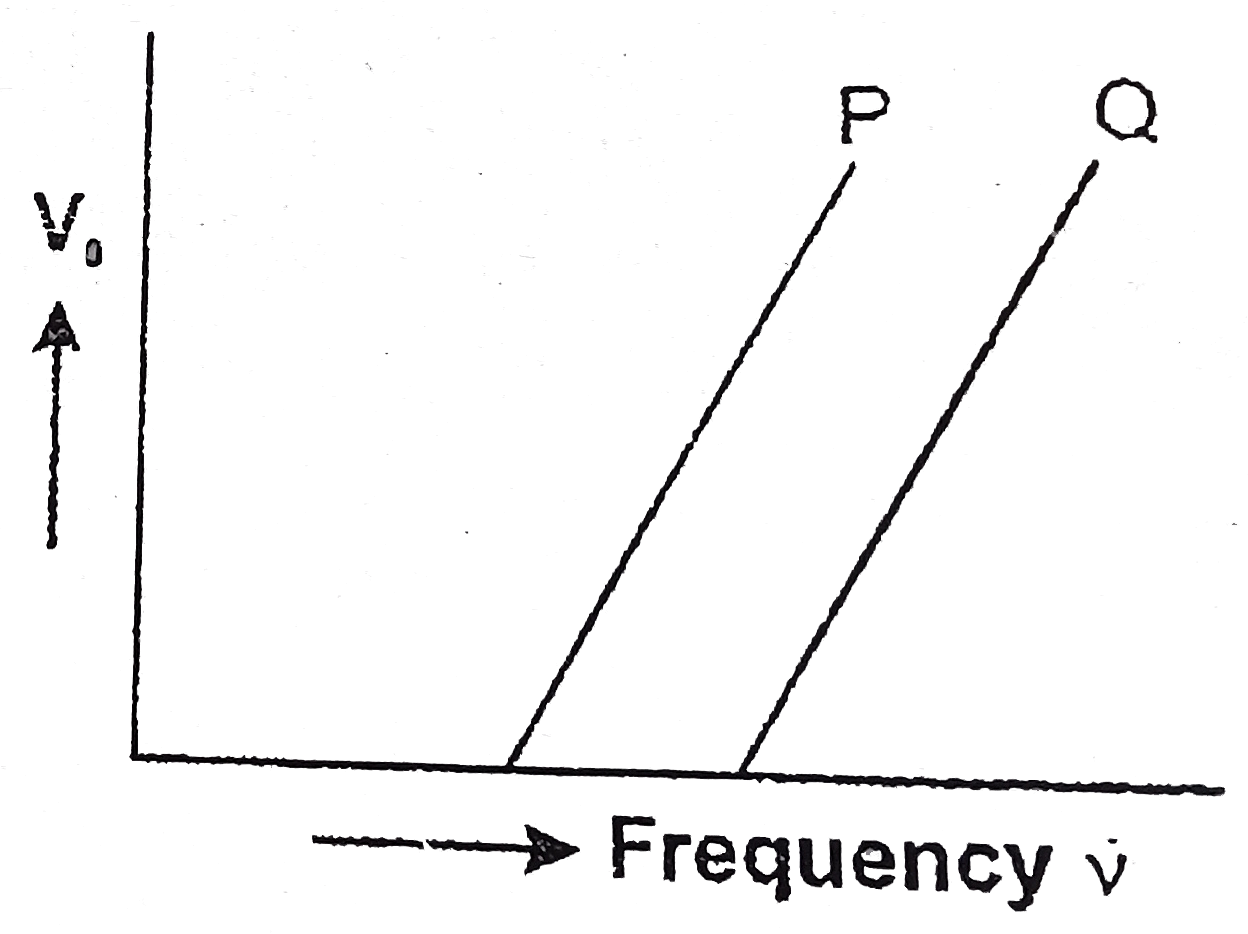
View SolutionThe graph between the stopping potential V0 and frequency v for two different metal plates P and Q are shown in the figure. Which of the metals has greater threshold wavelength and work function.
View Solution
Knowledge Check
The stopping potential vs frequency plot for a substance is shown in the figure. The work function of the substance is
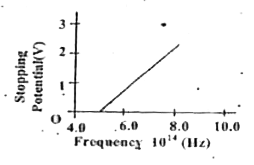 A3.331 eVB4.02 eVC2.07 eVD3.02e V
Graph between stopping potential and frequency of light as shown find the work function
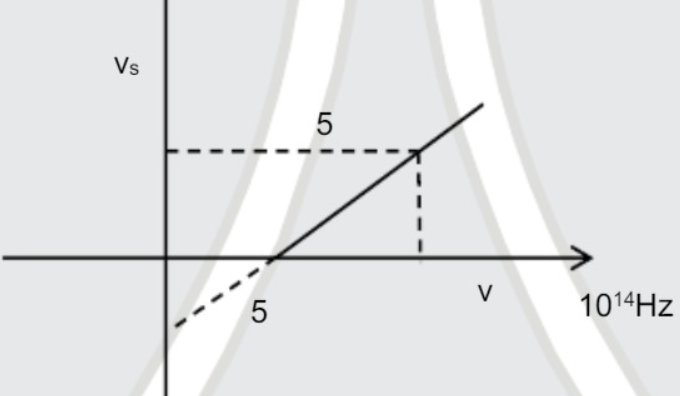 A4.01 evB2.07 evC5.01 evD2.09 ev
The graph between the stopping potential V0 and frequency v for two different metal plates P and Q are shown in the figure. Which of the metals has greater threshold wavelength and work function.

View SolutionIn a photoelectric effect experiment, the graph of stopping potential V versus reciprocal of wavelength obtained is shown in the figure. As the intensity of incident radiation is increased :
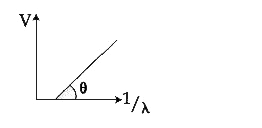
View SolutionIn a photoelectric effect experiment, the graph of stopping potential V versus reciprocal of wavelength obtained is shown in the figure. As the intensity of incident radiation is increased :

View SolutionGraph between stopping potential and frequency of light as shown find the work function

View SolutionWhen a metal is illuminated by light of wavelength λ , the stopping potential is V∘ and for wavelength 2λ, it is 3V∘.Then the threshold wavelength is ?
View SolutionWhen incident wavelength is λ, stopping potential is 3V0. If incident wavelength is 2λ then stopping potential is V0. Find out threshold wavelength in terms of λ.
View Solution
