The V-I graph for a conductor at temperature T1 and T2 are as shown in the figure. The term (T2−T1) is proportional to

cos2θ
sinθ
cot2θ
tanθ
The correct Answer is:C
Step by step video & image solution for The V-I graph for a conductor at temperature T_(1) and T_(2) are as shown in the figure. The term (T_(2)-T_(1)) is proportional to by Physics experts to help you in doubts & scoring excellent marks in Class 12 exams.
Updated on:21/07/2023Topper's Solved these Questions
- ELECTRIC CURRENT & CIRCUITSBOOK - CENGAGE PHYSICS ENGLISHCHAPTER - ELECTRIC CURRENT & CIRCUITSEXERCISE - Combination of Resistance 1
14 Videos
- ELECTRIC CURRENT & CIRCUITSBOOK - CENGAGE PHYSICS ENGLISHCHAPTER - ELECTRIC CURRENT & CIRCUITSEXERCISE - Combination of Resistance 2
14 Videos
- COULOMB LAW AND ELECTRIC FIELDBOOK - CENGAGE PHYSICS ENGLISHCHAPTER - COULOMB LAW AND ELECTRIC FIELDEXERCISE - Single Answer Correct Type
22 Videos
- ELECTRIC CURRENT AND CIRCUITBOOK - CENGAGE PHYSICS ENGLISHCHAPTER - ELECTRIC CURRENT AND CIRCUITEXERCISE - Interger
8 Videos
Similar Questions
Assertion : Current versus potential difference (i-V) graph for a conductor at two different temperatures T1 and T2 is shown in figure. Hence T1>T2.
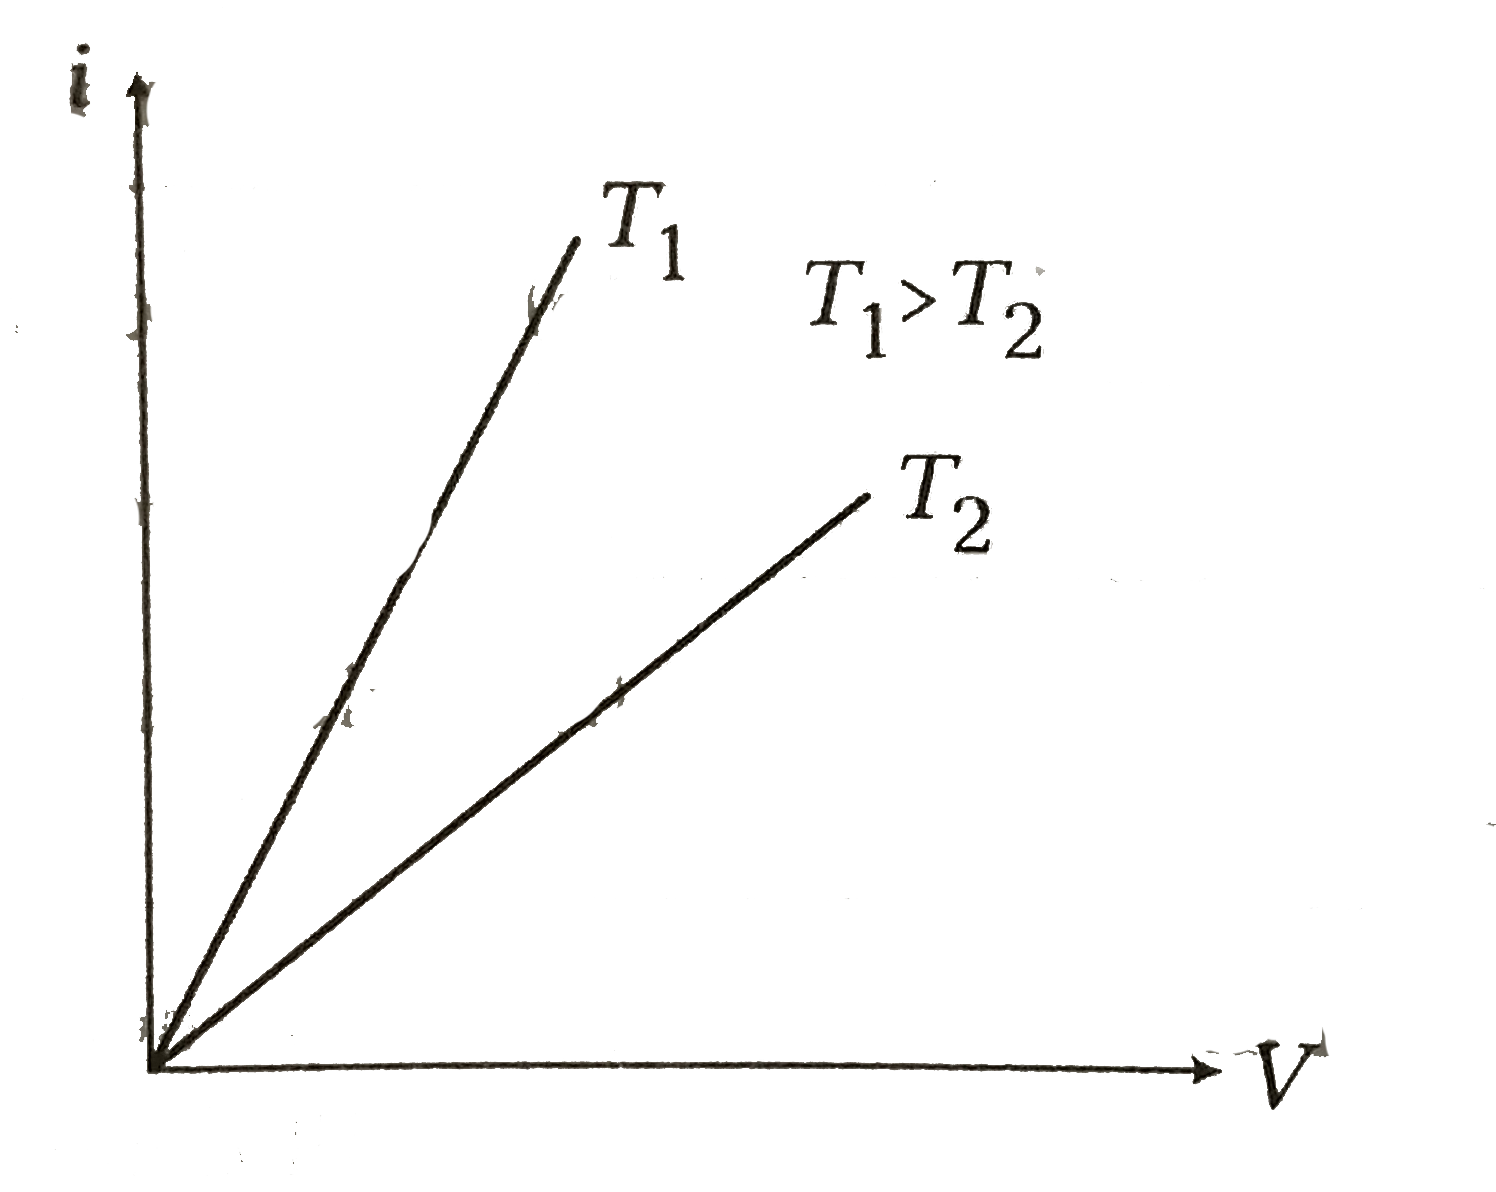
Reason : Resistance of a conductor increases with rise in temperature.
View SolutionThe current - voltage graphs for a given metallic wire at two different temperatures T1andT2 are shown in the figure.
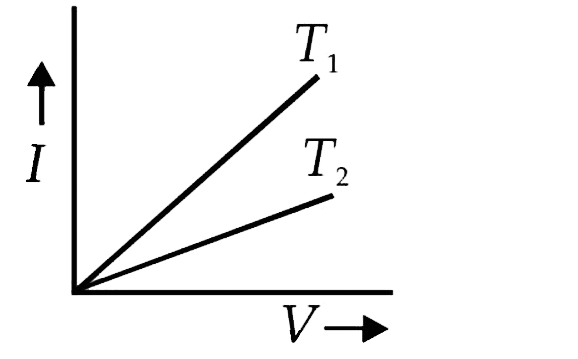
The temperature T2 is greater than T1.
View Solution
Knowledge Check
Assertion : Current versus potential difference (i-V) graph for a conductor at two different temperatures T1 and T2 is shown in figure. Hence T1>T2.

Reason : Resistance of a conductor increases with rise in temperature.Acos2θBsin2θCcot2θDtan2θThe voltage V and current I v graphs for a conductor at two different temperatures T1andT2 are shown in the figure. The relation between T1andT2 is
 AT1>T2BT1<T2CT1=T2DT1=1T2
The current - voltage graphs for a given metallic wire at two different temperatures T1andT2 are shown in the figure.

The temperature T2 is greater than T1.
View SolutionThe current voltage graphs for a given metalic wire two different temperature T1 and T2 are shown in figure The temperature T2 is greater than T1. Is this statement true or false?
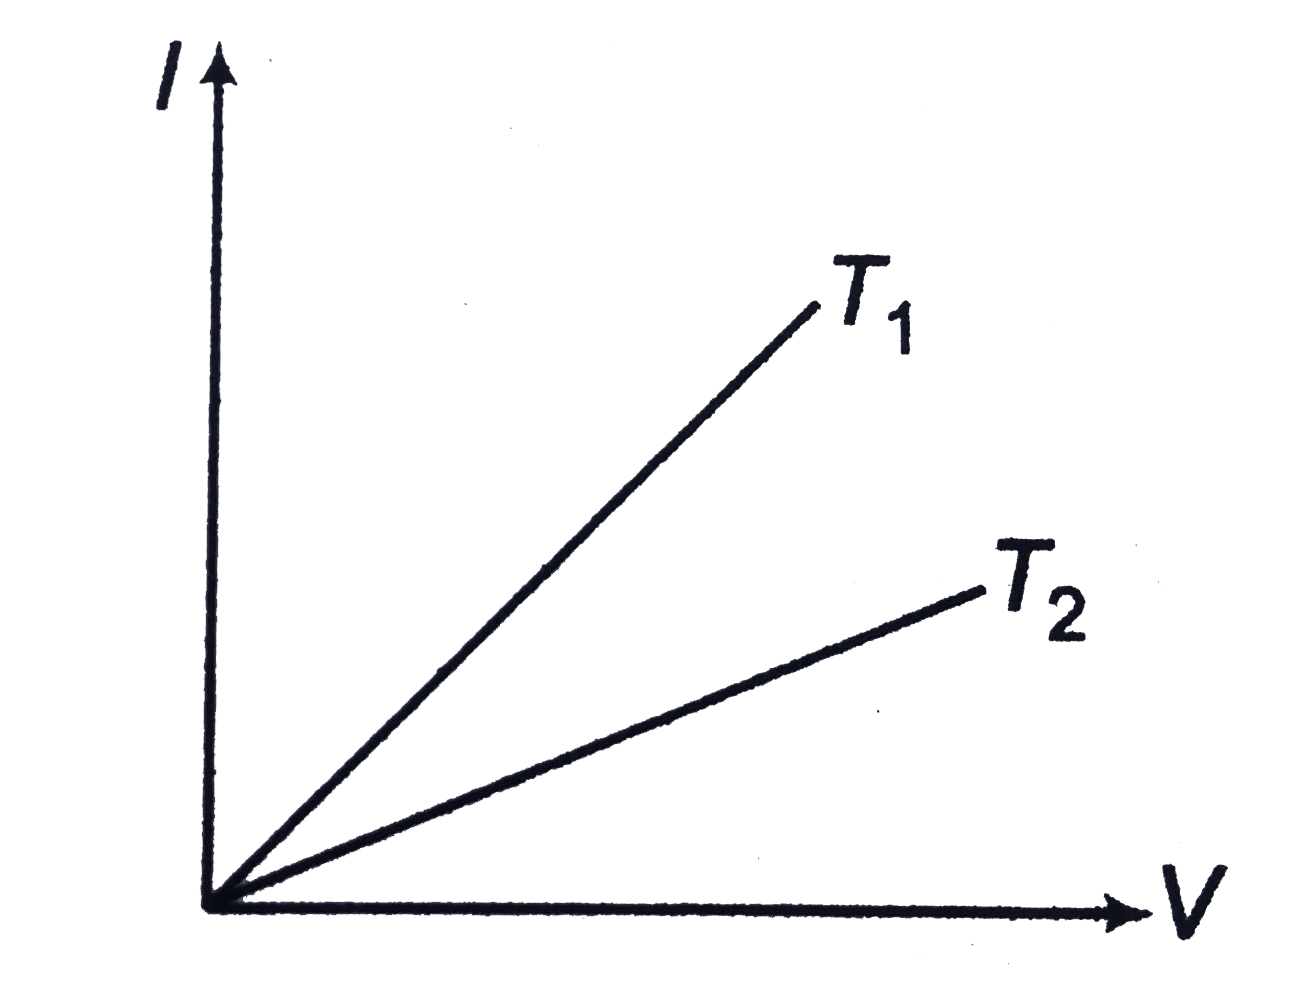
View SolutionThe current voltage graphs for a given metalic wire two different temperature T1 and T2 are shown in figure The temperature T2 is greater than T1. Is this statement true or false?

View SolutionDetermine the tensions T1 and T2 in the string as shown in figure.
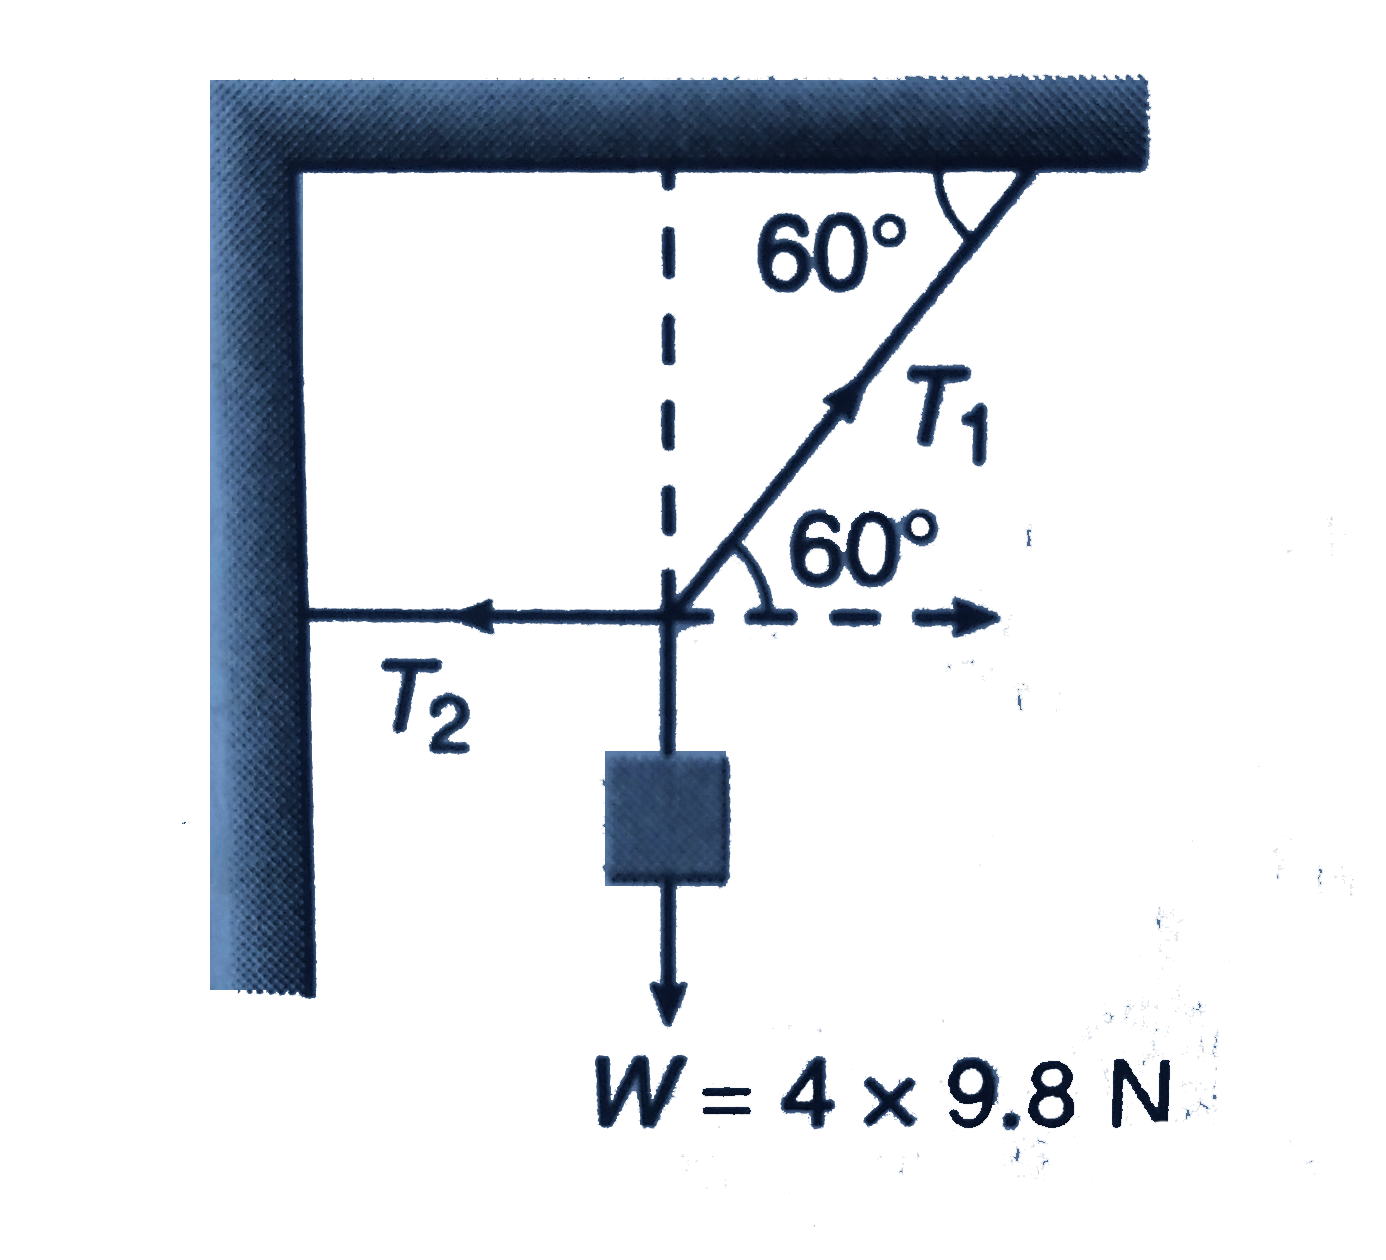
View SolutionDetermine the tensions T1 and T2 in the string as shown in figure.

View SolutionT1andT2 in the given figure are
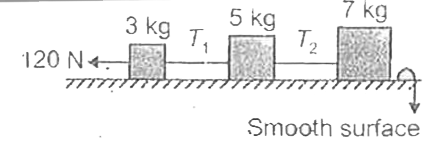
View Solution
