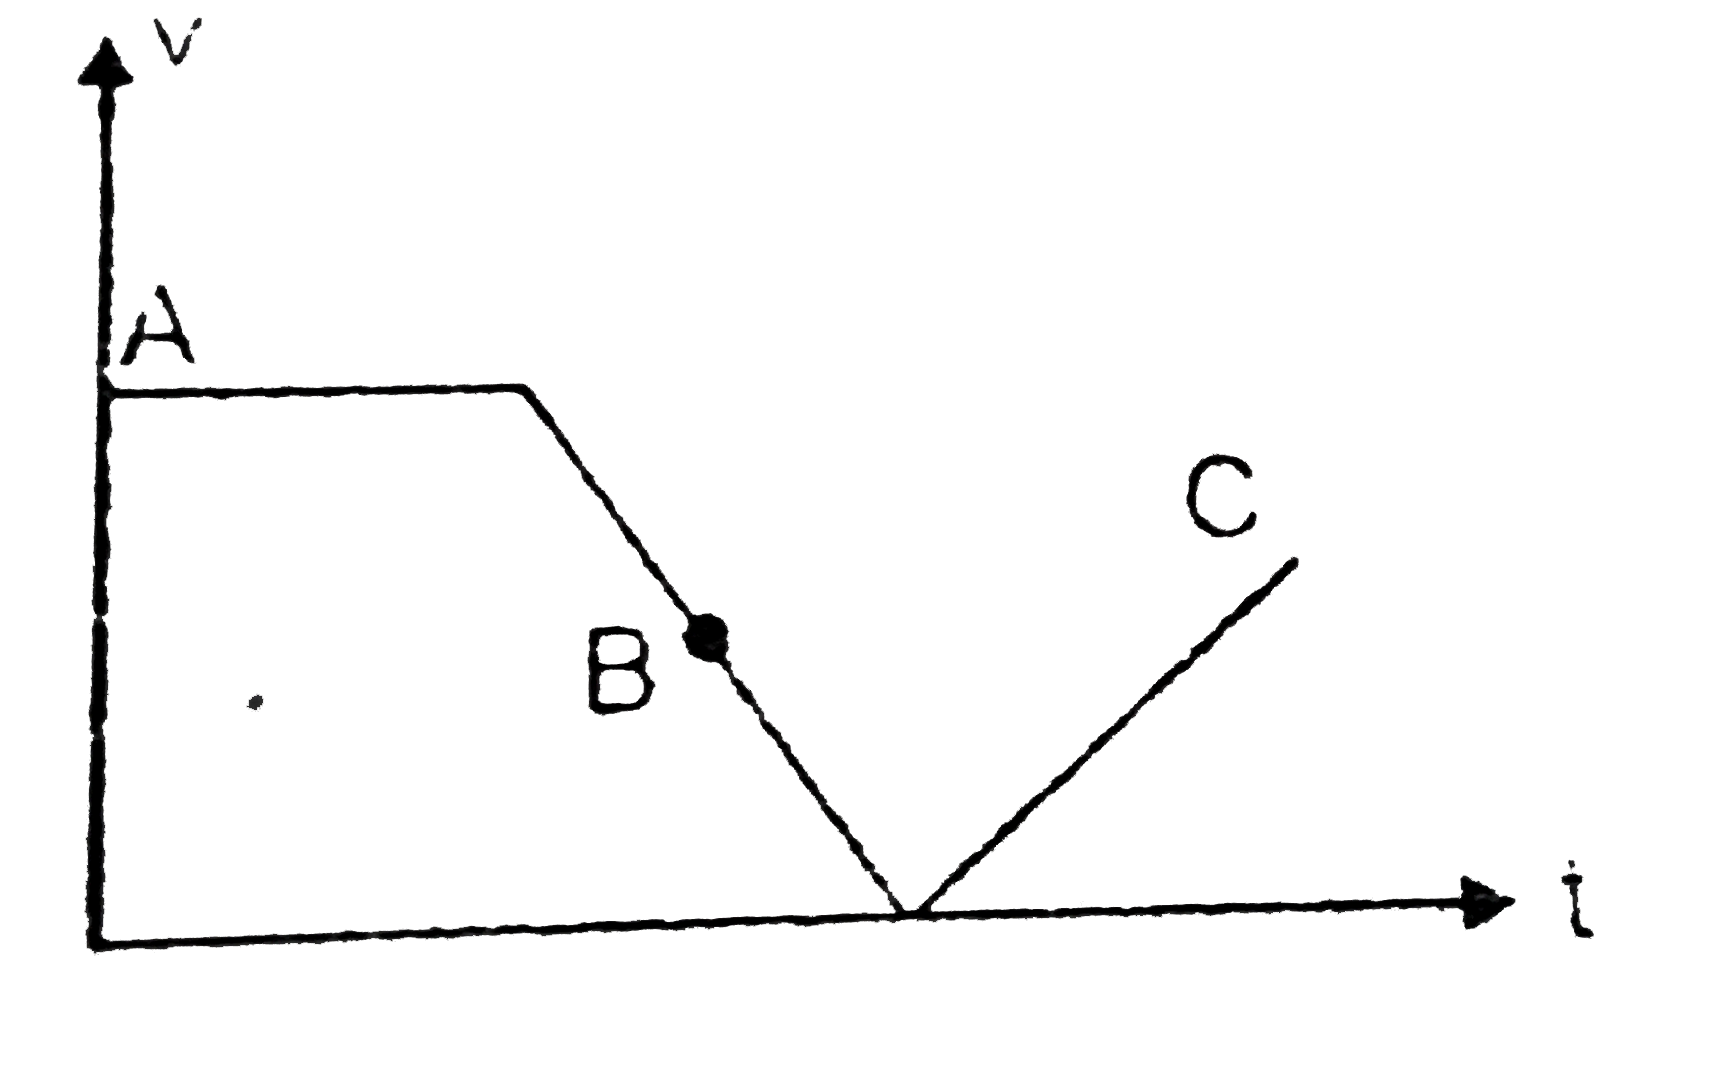
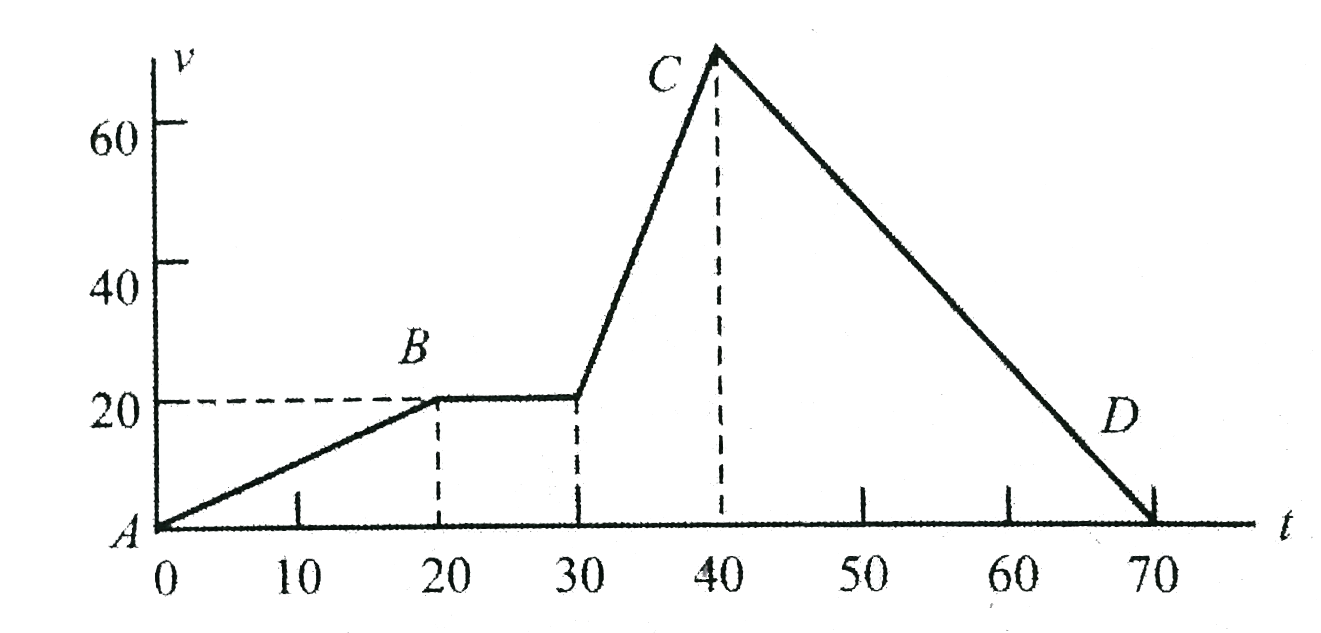
The velocity time curve of a moving point is shown in Fig. Find the retardation of the particle for the portion CD.
 .
.
A
1cm/sec2
B
2cm/sec2
C
3cm/sec2
D
4cm/sec2
Video Solution
Text Solution
The correct Answer is:B
a=v2−v1t2−t1=0−6070−40=−2m/s2
|
Topper's Solved these Questions
- MOTION IN A STRAIGHT LINEBOOK - GRB PUBLICATIONCHAPTER - MOTION IN A STRAIGHT LINEEXERCISE - More than one choice is correct
16 Videos
- MOTION IN A STRAIGHT LINEBOOK - GRB PUBLICATIONCHAPTER - MOTION IN A STRAIGHT LINEEXERCISE - Assertion Reason
12 Videos
- MOTION IN A STRAIGHT LINEBOOK - GRB PUBLICATIONCHAPTER - MOTION IN A STRAIGHT LINEEXERCISE - Problems and Practice
16 Videos
- FRICTION AND CIRCULAR MOTION BOOK - GRB PUBLICATIONCHAPTER - FRICTION AND CIRCULAR MOTION EXERCISE - Comprehension type
11 Videos
- MOTION IN TWO AND THREE DIMENSIONSBOOK - GRB PUBLICATIONCHAPTER - MOTION IN TWO AND THREE DIMENSIONSEXERCISE - All Questions
210 Videos
Similar Questions
Knowledge Check
The velocity time curve of a moving point is shown in Fig. Find the retardation of the particle for the porion CD.
 .A4ms−2B2ms−2C3ms−2D6ms−2
velocity time graph of a particle is shown in figure. Find displacement of the particle.
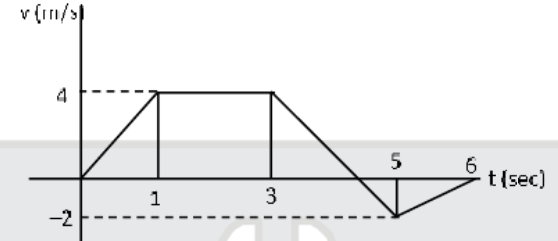 A7B11C5D15
The displacement time curve of a particle is shown in the figure. The external force acting on the particle is :
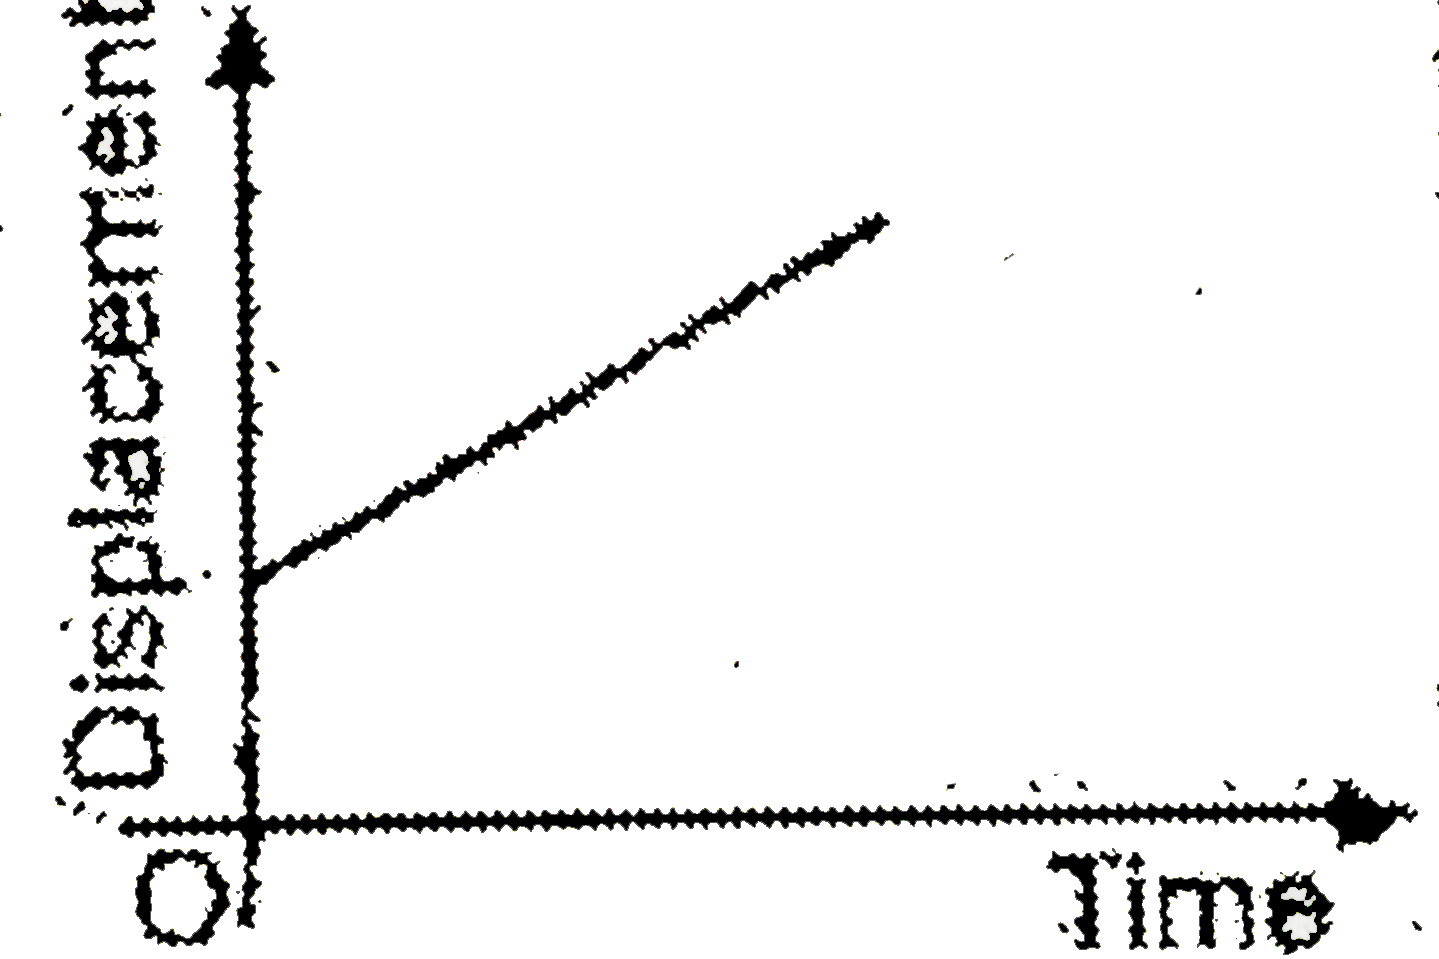 AActing at the beginning part of motionBZeroCNot zeroDNone of these
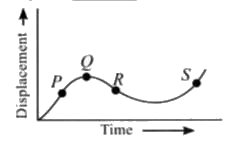
The displacement-time graph of a moving particle is shown in the figure. The velocity of the particle is zero at the point ______.
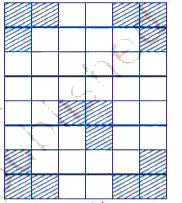
View SolutionFind the ratio of the shaded portion to the unshaded portion in Fig. 8.1
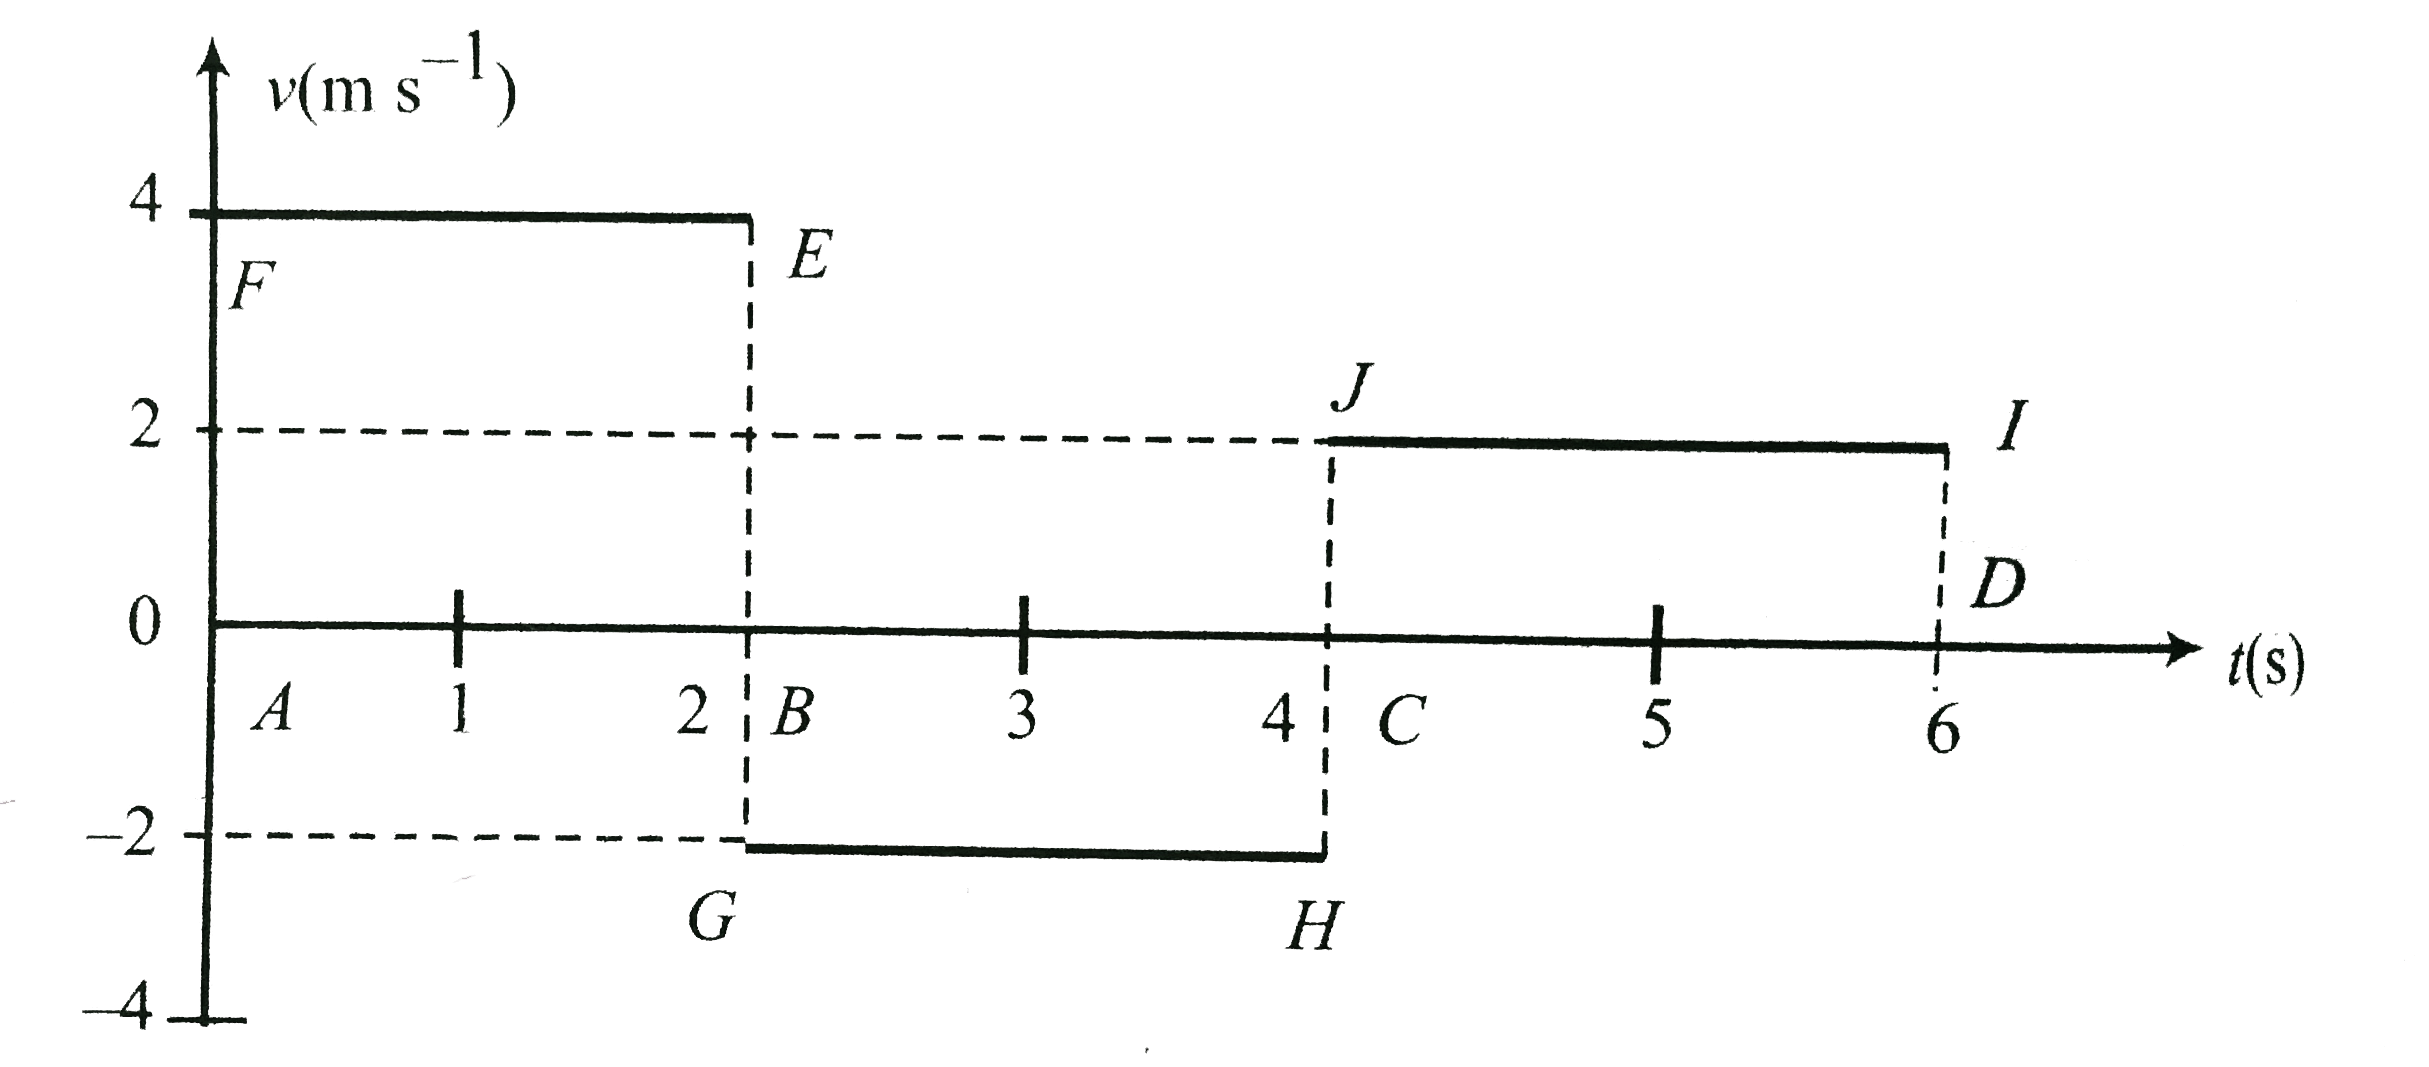
View SolutionThe velocity-time graph of a particle moving in a staight line is shown in the . Find the displacement and the distance trav elled by the particle in 6s.
 .
.
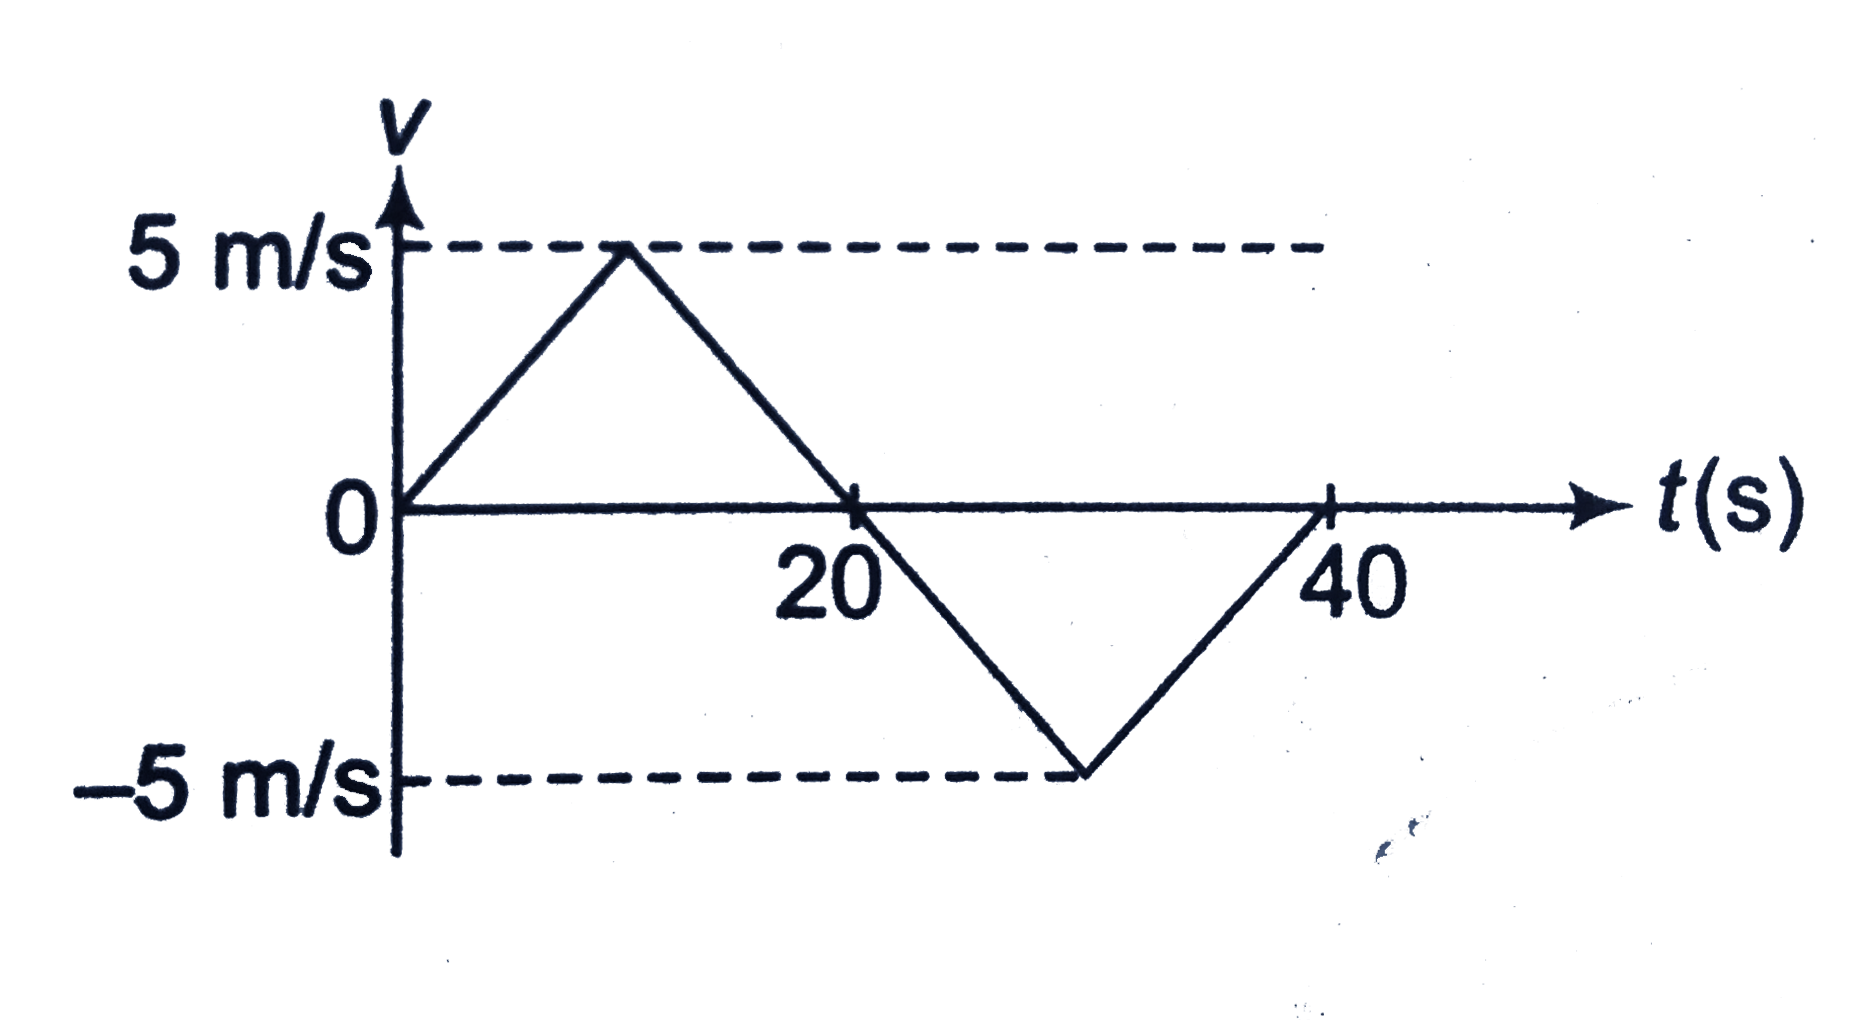
View SolutionFrom the velocity-time plot shown in Fig. find the distance travelled by the particle during the first 40s. Also find the average velocity during this period.
View SolutionThe velocity time plot for a particle moving on straight line is shown in the figure.
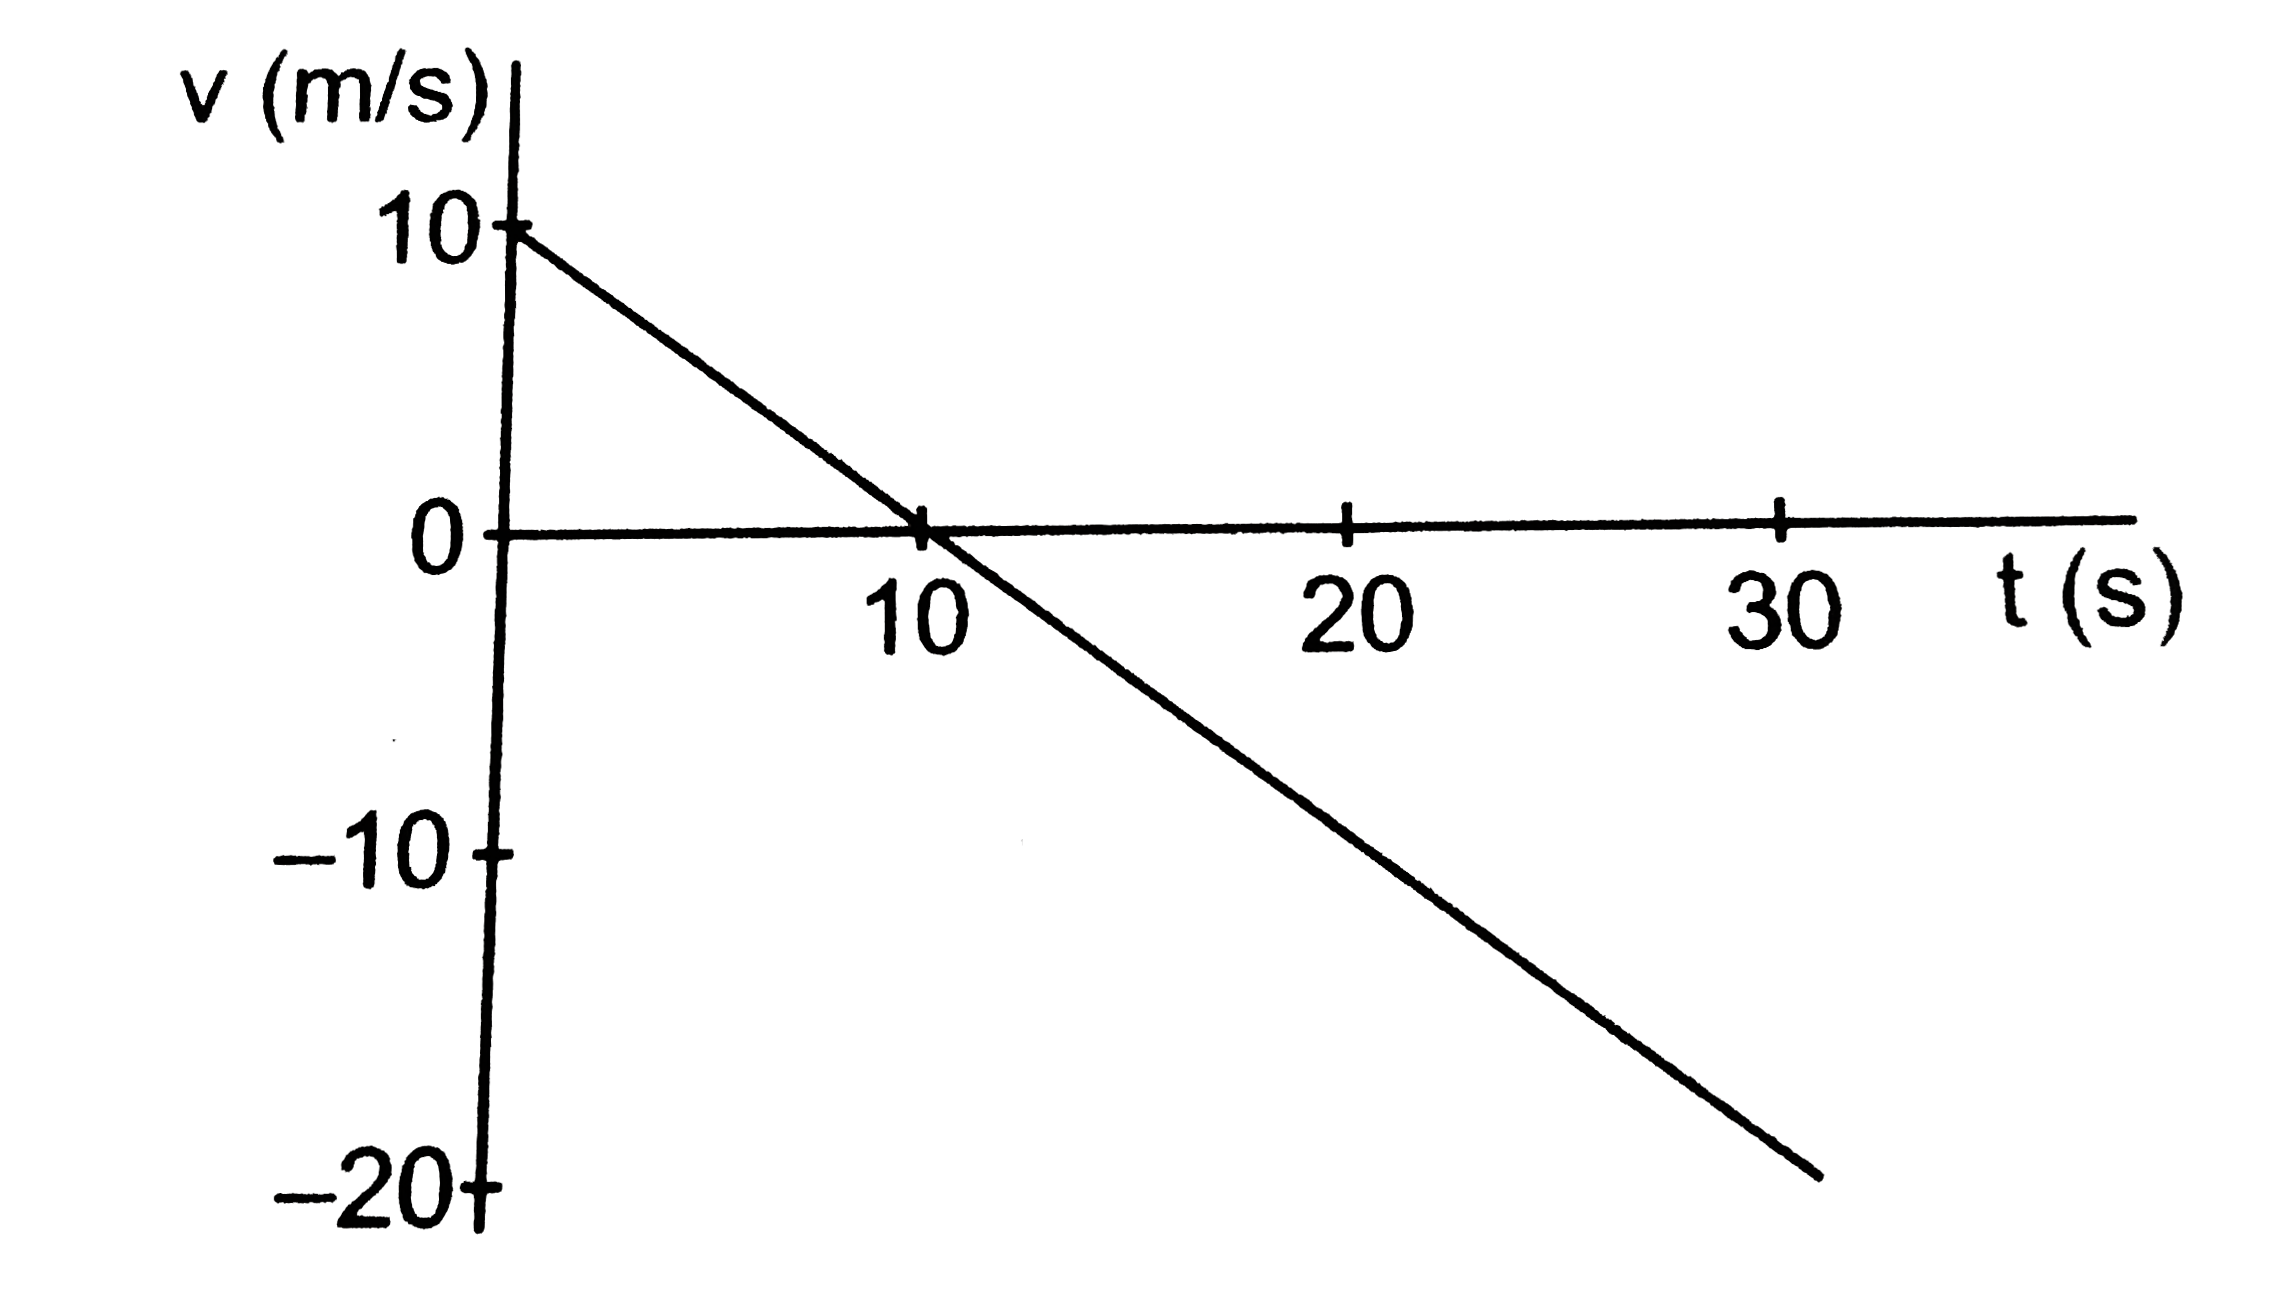
View Solution

