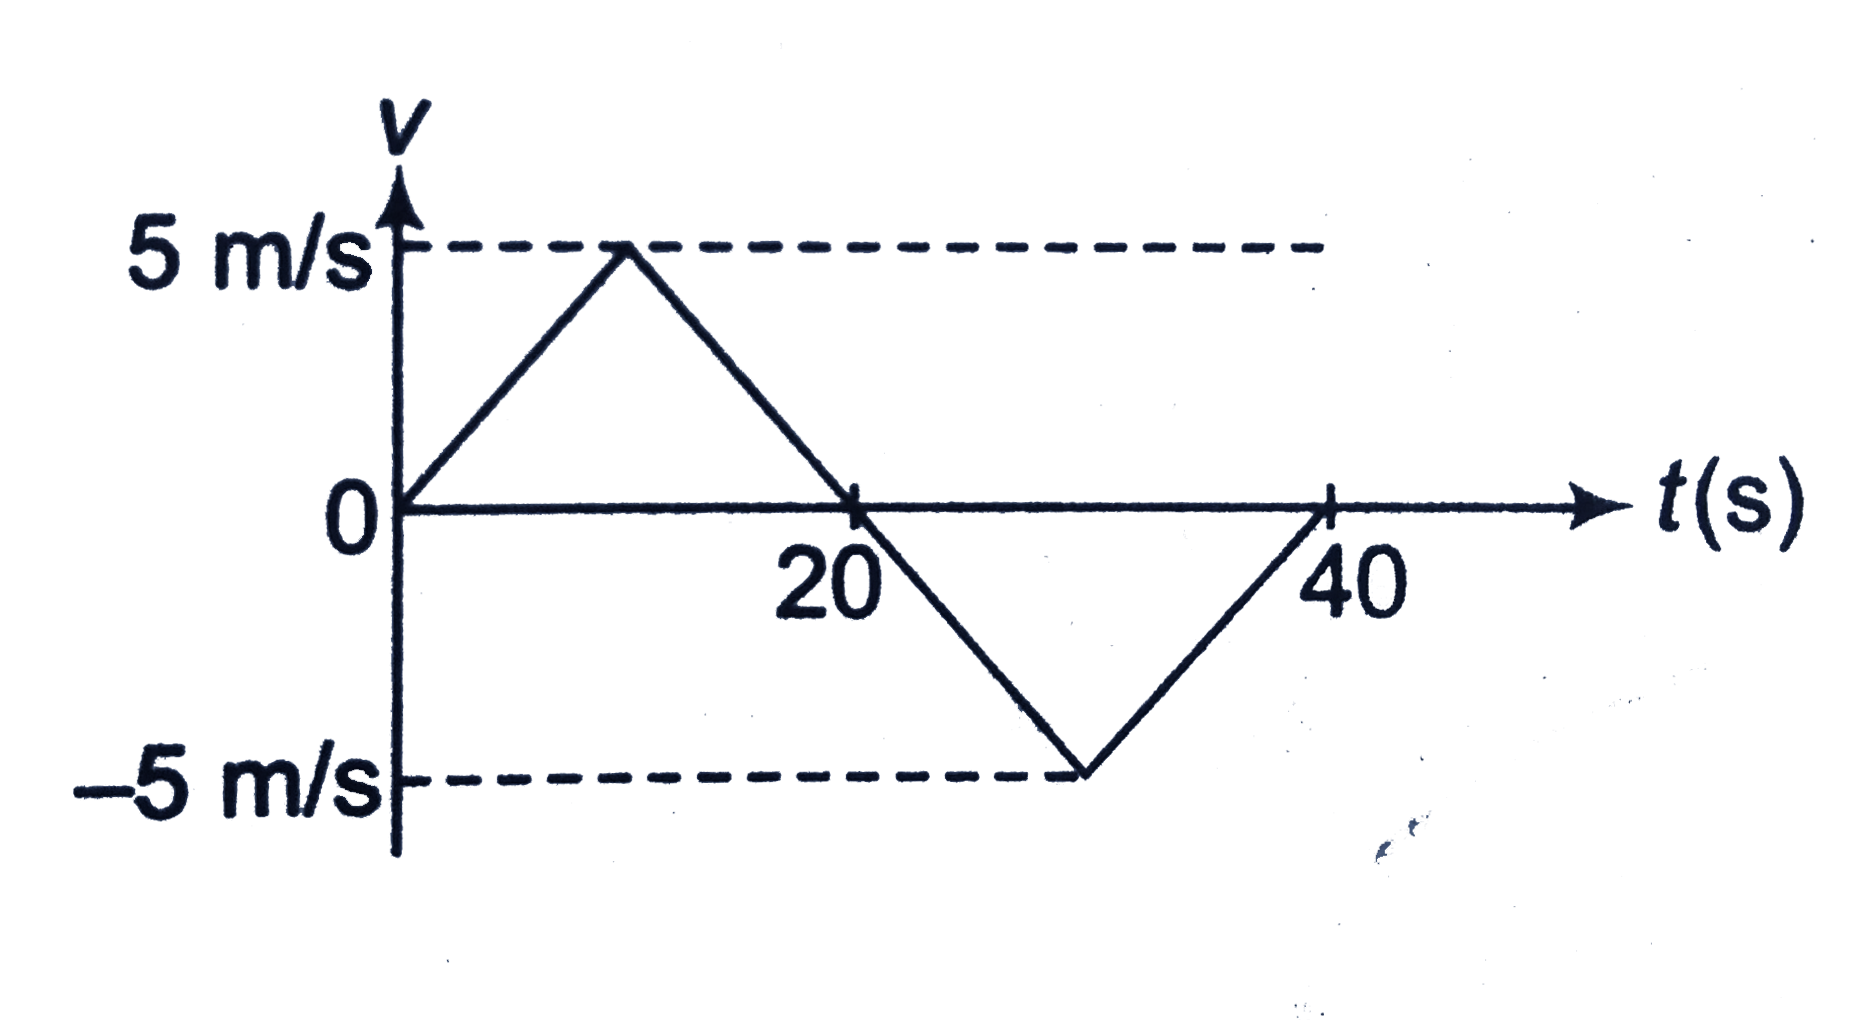
From the velocity-time plot shown in Fig. find the distance travelled by the particle during the first 40s. Also find the average velocity during this period.
The correct Answer is:A
From 0 to 20s,
displacement s1=area under v-t graph
+50m (as is negative)
From 20 to 40s,
displacement s2=area under v-t graph
=−50m (as v is negative)
Total distance travelled =s1+|s2|=100m
Average velocity=st=s1+s2t
=50−5040=0
Topper's Solved these Questions
- BOOK - DC PANDEYCHAPTER - KINEMATICSEXERCISE - Exercise 6.96videos
KINEMATICS
- BOOK - DC PANDEYCHAPTER - KINEMATICSEXERCISE - Assertion And Reason12videos
KINEMATICS
- BOOK - DC PANDEYCHAPTER - KINEMATICSEXERCISE - Exercise 6.73videos
KINEMATICS
- BOOK - DC PANDEYCHAPTER - GRAVITATIONEXERCISE - (C) Chapter Exercises45videos
GRAVITATION
- BOOK - DC PANDEYCHAPTER - KINEMATICS 1EXERCISE - INTEGER_TYPE15videos
KINEMATICS 1
Similar Questions
From the velocity time plot shown in figure find the distance travelled by the particle dureing the first 40 seconds. Also find the average velocity during this period.
 View Solution
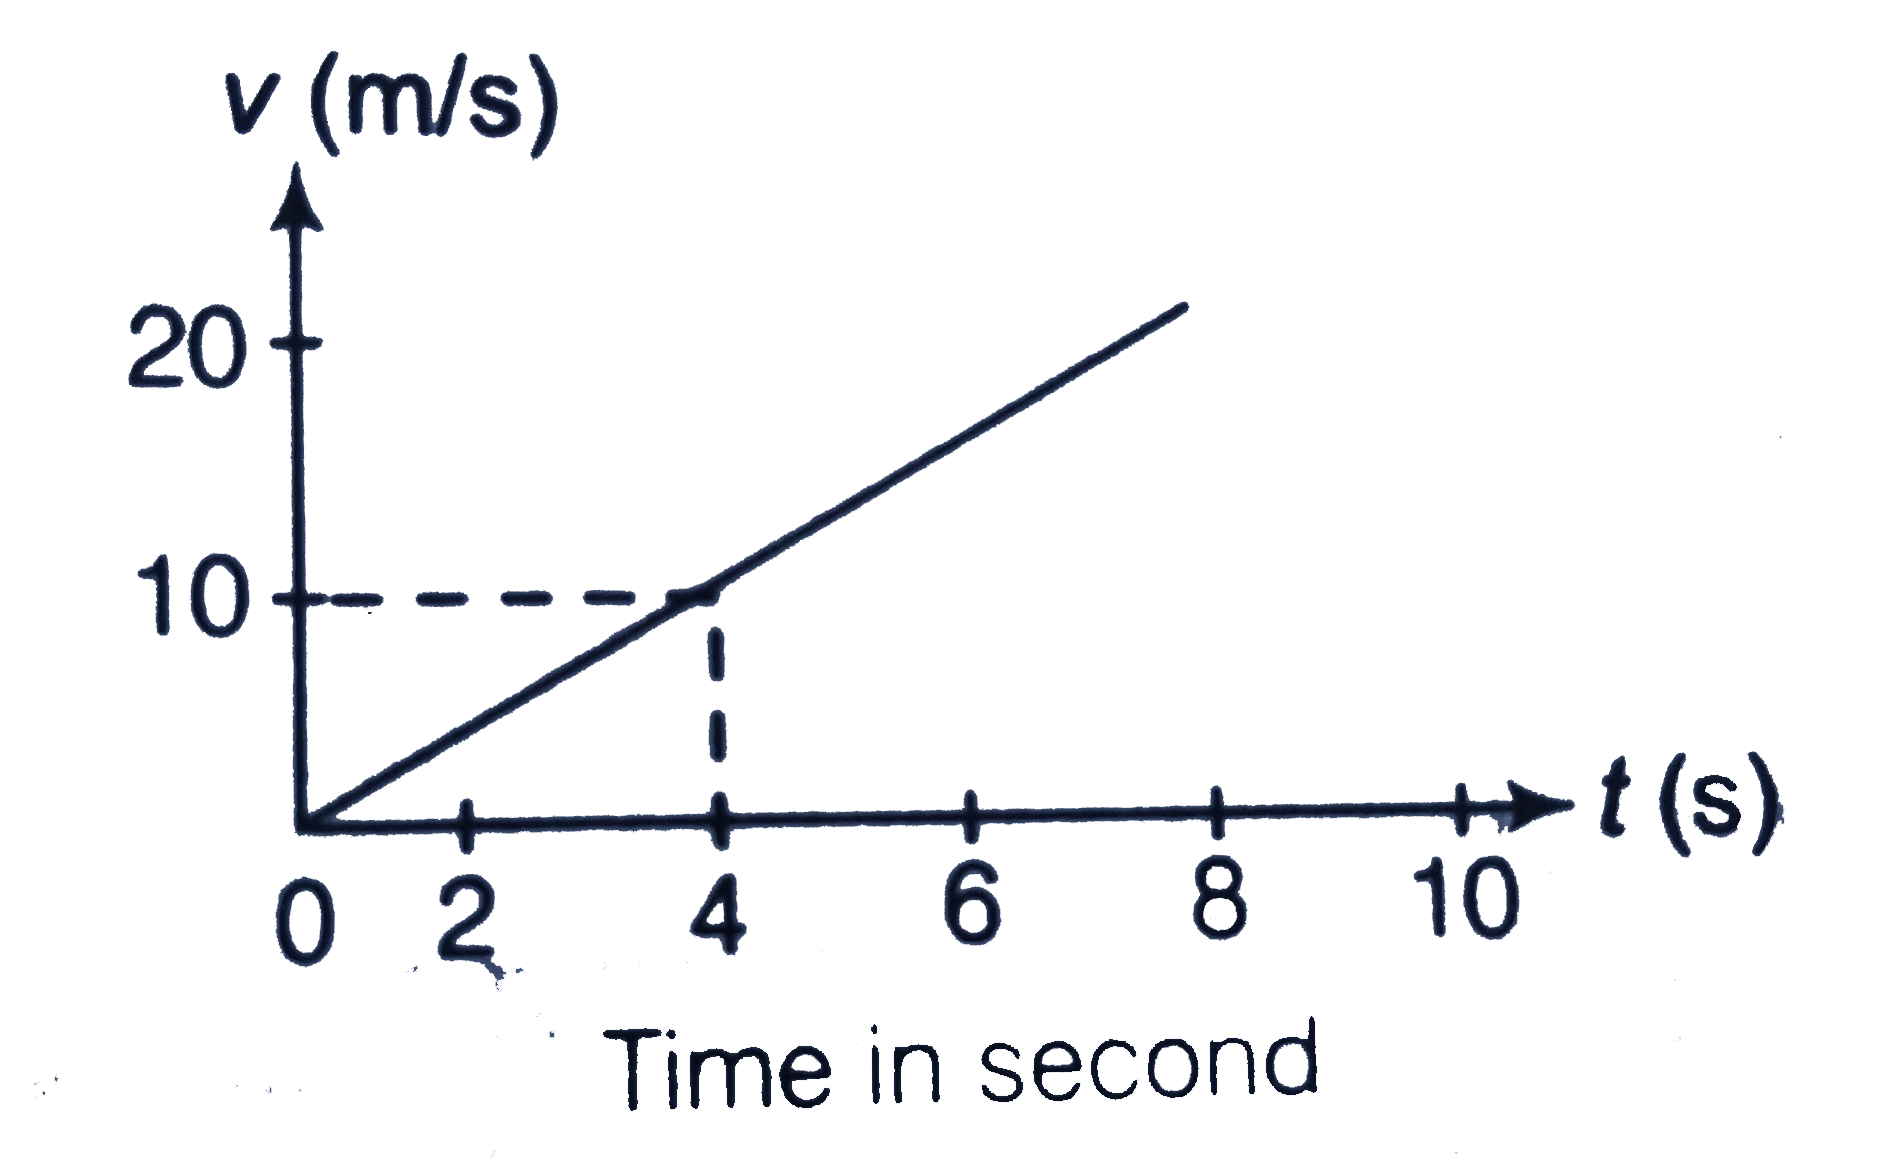
The velocity of a car as a function of time is shown in Fig. Find the distance travelled by the car in 8s and its acceleration.
 View Solution
Knowledge Check
- Question 1 - Select One
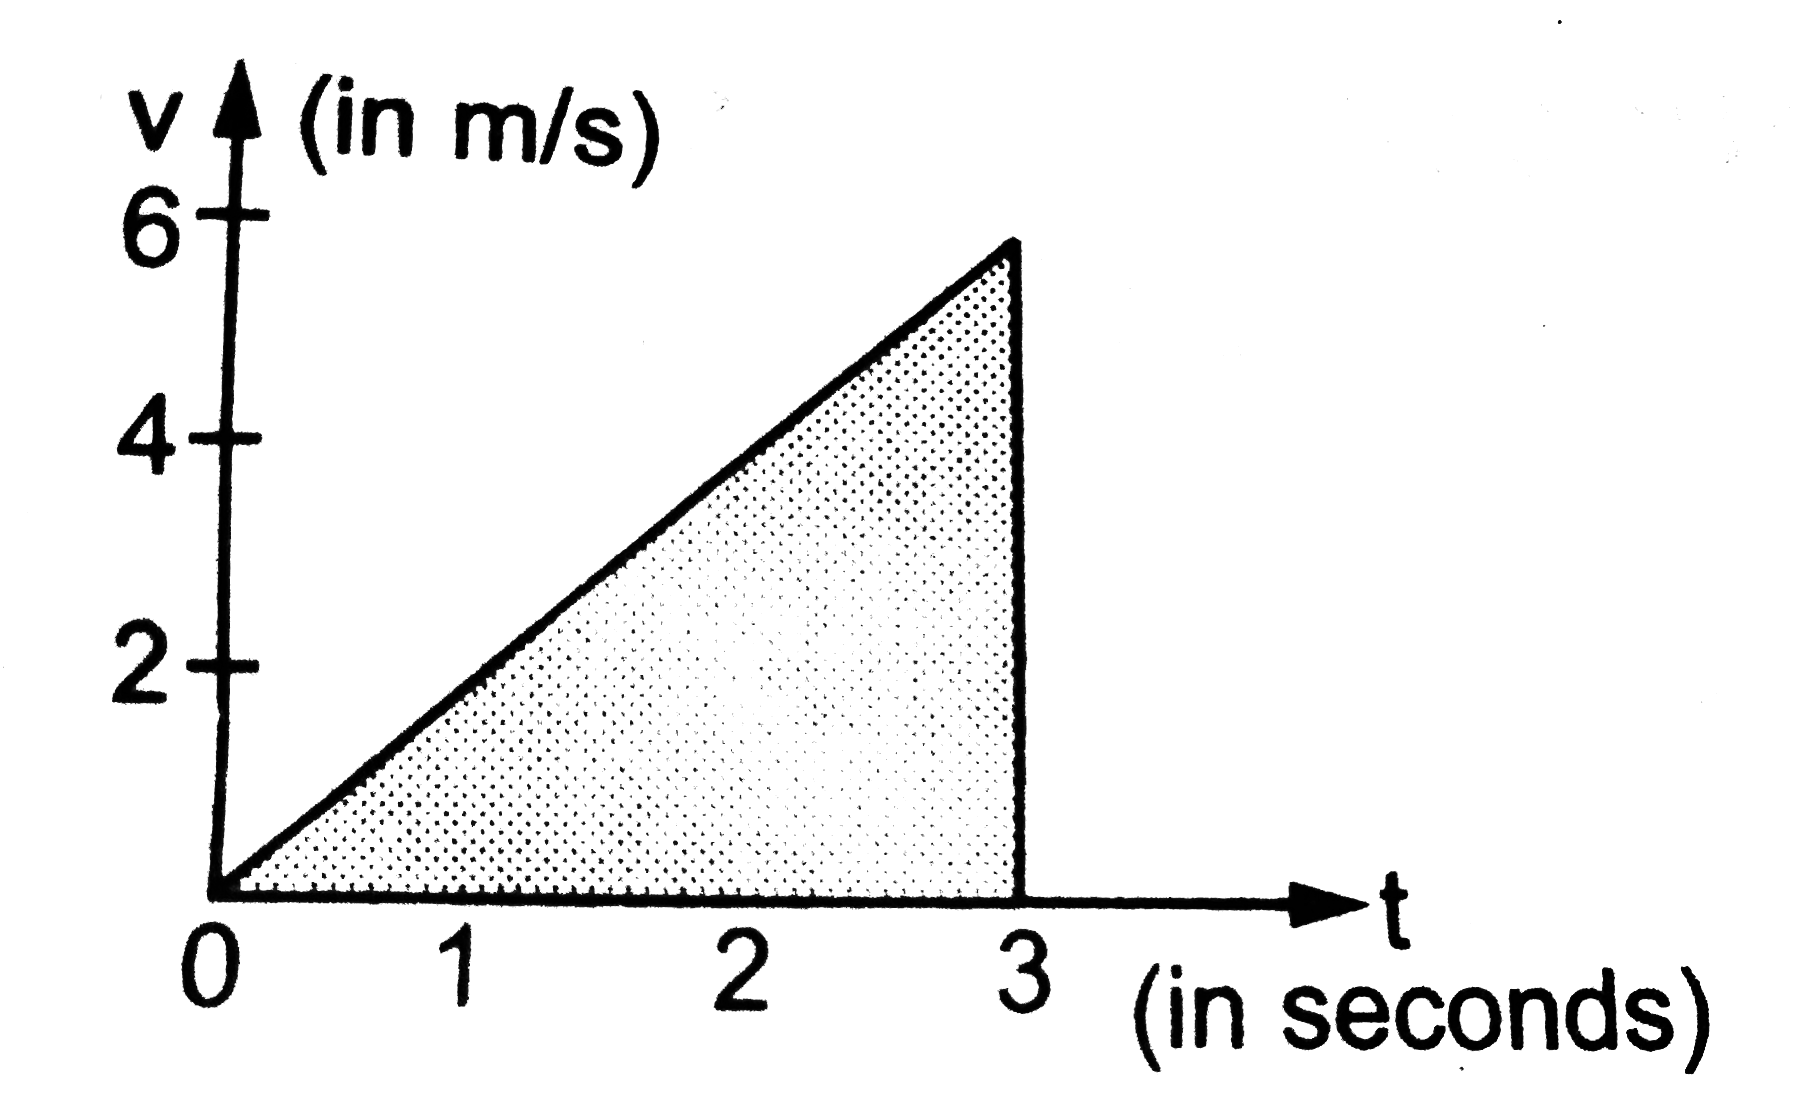
Figure shows the speed versus time graph for a particle. Find the distance travelled by the particle during the time t=0 to t=3s.
 A9mB5mC2mD1m
 - Question 2 - Select One
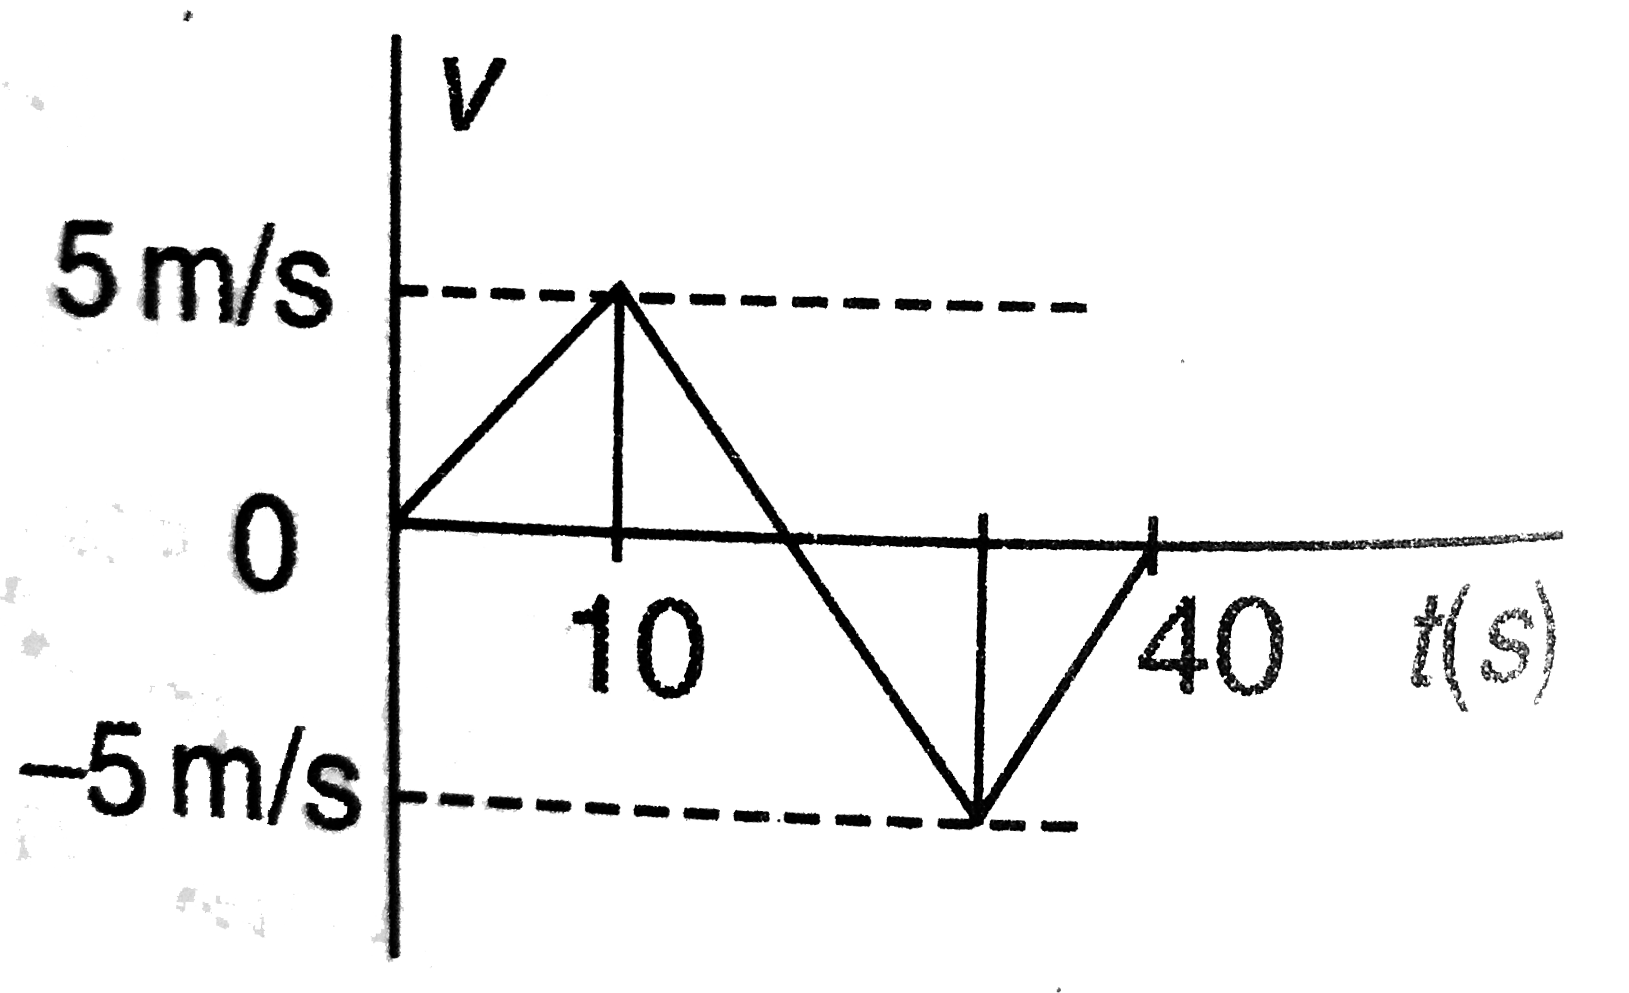
The velocity-time plot is shown in figure. Find the average speed in time interval t=0 to t=40s during the period.
 AzeroB2.5m/sC5m/sDnone
 - Question 3 - Select One
The velocity time curve of a moving point is shown in Fig. Find the retardation of the particle for the porion CD.
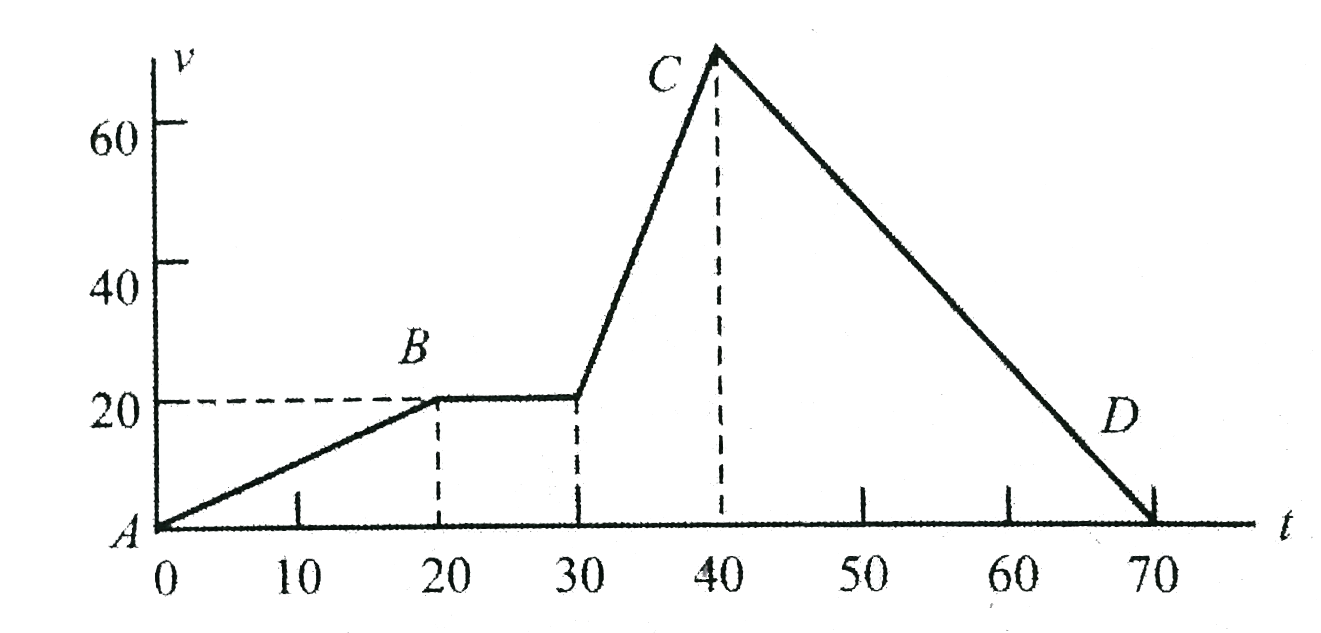 .A4ms−2B2ms−2C3ms−2D6ms−2
A particle is moving along positive x direction and experiences a constant acceleration of 4m/s2 in negative x direction. At time t=3 second its velocity was observed to be 10m/s in positive x direction.
(a) Find the distance travelled by the particle in the interval t=0 to t=3s. Also find distance travelled in the interval t=0 to t=7.5s..
(b) Plot the displacement – time graph for the interval t=0 to 7.5s.View SolutionA particle starts from rest and moves along a straight line with uniform acceleration. The ratio of distance travelled by the particle during the first three seconds to the distance travelled by the particle during the next three seconds is 3 о 2
View SolutionA particle starts from rest and moves along a straight line with uniform acceleration. The ratio of distance travelled by the particle during the first three seconds to the distance travelled by the particle during the next three seconds is 3 о 2
View SolutionIf velocity is depend on time such that v = 4 – 2t. Find out distance travelled by particle from 1 to 3 sec
View Solutionvelocity time graph of a particle is shown in figure. Find displacement of the particle.
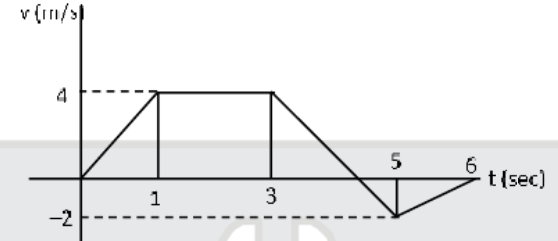 View Solution

